DISCLAIMER: Investing/ Trading involves significant financial risk and is not suitable for everyone. No communication from us should be considered as financial or trading advice. All information provided by it and Run Candlesticks Inc, its affiliates or representatives is intended for educational purposes only. You are advised to test any new approach before implementing it. Past performance does not guarantee future results. Terms of Service
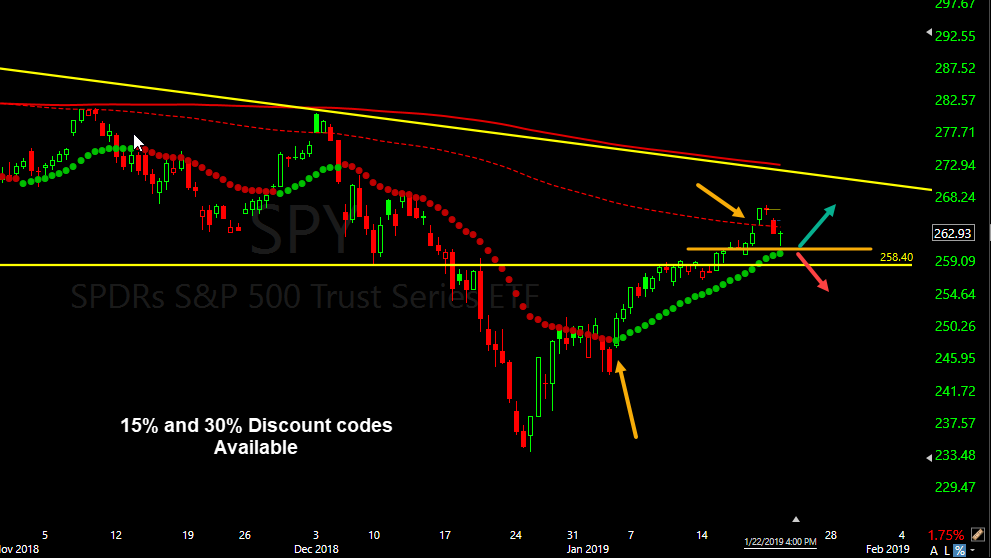
The trade war with China set off a little selling yesterday bringing in fear to the market, as stated yesterday we are cautiously bullish. As you can see from the 4-hour chart, the trend went from red to green. Price has followed the green dot trend challenging the Dotted Duece. Yesterdays fear brought in what looks like normal profit taking down to a minor support line and still above the $258.40 support line. With price closing above the $258.40 trend line and the Red/Green Dot trend, we will remain cautiously bullish until we see a compelling bearish candlestick pattern with follow-through the breaks the bullish trend.
For more information about the Red/Green Trend line, Dotted Deuce or anything about our charts, please consider joining us in the HRC trading room. We start at 9:10 Am each trading day.
VIX–X Chart – The Vix chart became a little bullish yesterday, and we are watching it like a hawk. If we see Bullish follow-through from the Morning Star signal printed yesterday, we will reevaluate ous trades and look at shorts/Puts
Stock picks or trade ideas without the education will cost you your hard earned money. HRC Watch-list Trade-Ideas – We are adding the following to our trade-list: BERY, BBBY, PG, EA, SLB. Learn how to trade before you trade. Past performance does not guarantee future.
Real-Time Market Scanner
Built-In (Included) Scan Definitions. Bullish and bearish, Continuation, moving average crossovers and bounces. (RBB) Rounded Bottom Breakout alerts, intra-day, daily and weekly, Candlesticks stick signals and more. Scan Definitions- Download FREE
DISCLAIMER: Investing/ Trading involves significant financial risk and is not suitable for everyone. No communication from us should be considered as financial or trading advice. All information provided by it and Run Candlesticks Inc, its affiliates or representatives is intended for educational purposes only. You are advised to test any new approach before implementing it. Past performance does not guarantee future results. Terms of Service
Last week on the daily chart the SPY broke through the 50-SMA and the following day price action produced bullish follow-through. As of Friday we have had an 11-day bullish T-Line Run showing the strength and determination of the bulls. Both the Dotted Duece and 200-SMA are just above for the bulls to take.
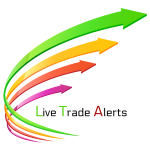
The weekly Candleless chart the 3-EMA is just now coming up to meet the T-Line (8-EMA), and both the 34-EMA and 50-SMA are still in bear territory. Over the years of trading, I have learned to respect the T-Line trend and how price action and other moving averages act around it. The daily chart has cut through the first layer of the resistance skin and is suggesting a good bullish trend working its way back up through the 50SMA while price moves up and down as it should. The week chart 3-EMA still lags below the T-Line. (Cautiously Bullish)
VIX–X Chart – 15-candles below the T-Line, Doji close Friday on the 200-SMA. The T2122 chart closed Friday at 99.27
Stock picks or trade ideas without the education will cost you your hard earned money. HRC Watch-list Trade-Ideas – We are adding the following to our trade-list: RMBS, EA, NVDA, WDAY, URI, RIG, DVN. Learn how to trade before you trade. Past performance does not guarantee future.
Real-Time Market Scanner
Built-In (Included) Scan Definitions. Bullish and bearish, Continuation, moving average crossovers and bounces. (RBB) Rounded Bottom Breakout alerts, intra-day, daily and weekly, Candlesticks stick signals and more. Scan Definitions- Download FREE
Road To Wealth With Rick Saddler
Road To Wealth Coaching Looking for extended coaching? Serious out trading? Work with Rick Saddler on a daily basis. Read More
DISCLAIMER: Investing/ Trading involves significant financial risk and is not suitable for everyone. No communication from us should be considered as financial or trading advice. All information provided by it and Run Candlesticks Inc, its affiliates or representatives is intended for educational purposes only. You are advised to test any new approach before implementing it. Past performance does not guarantee future results. Terms of Service
Here are a few stats from our Day Trading Division yesterday 1/17/19 (TopGun Day Trading). AA -$120.00 • AA trade $225.00/2-days •AA trade $183.00 • SQ trade +100.00 • MTCH trade $40.00 for a total $428.00. Steve Risner resides in Florida and heads up our Day Trading Division Trading Room 5-days a week. Steve shares his trades and day trading knowledge with fellow traders.
If you are interested in a day traders lifestyle, you might want to take a test run or give yourself 6-Months to learn the tricks of day trading.
Top Gun Day Trading Room is for
the active day/scalp trader looking to profit daily with no overnight risk.
Daily trade alerts and trading education. Read More
Bullish Wall Of Worry
The bullish wall of worry can be taxing for swing traders. Here at Hit and Run Candlesticks, we help with that navigation. The SPY is challenging the 50-day SMA and the 50% retracement of the October 2018 highs and the December 2018 lows. The bullish challenge thus far has been successful with price action and a bullish T-line Run working quite nicely together. The next challenge for the SPY will be in the $270 – $274 area. I continue to watch and manage the charts and our profits like a Hawk as price navigates through this minefield of resistance.
VIX–X Chart – We are watching the CBOE Market Volatility Index for signs of fear or the lack of. As of yesterday, the fear is low as the price action is approaching the 200-SMA. The 200-SMA could start a small fear movement, Note the TC2000 / T2122 chart is now pegged at 99.04
HRC Watch-list Trade-Ideas – No trade Ideas on Fridays, Enjoy a few profits! Past performance does not guarantee future.
Real-Time Market Scanner
Built-In (Included) Scan Definitions. Bullish and bearish, Continuation, moving average crossovers and bounces. (RBB) Rounded Bottom Breakout alerts, intra-day, daily and weekly, Candlesticks stick signals and more. Scan Definitions- Download FREE
Road To Wealth With Rick Saddler
Road To Wealth Coaching Looking for extended coaching? Serious out trading? Work with Rick Saddler on a daily basis. Read More
DISCLAIMER: Investing/ Trading involves significant financial risk and is not suitable for everyone. No communication from us should be considered as financial or trading advice. All information provided by it and Run Candlesticks Inc, its affiliates or representatives is intended for educational purposes only. You are advised to test any new approach before implementing it. Past performance does not guarantee future results. Terms of Service
The SPY holds its bullish trend from it’s December low, and the tug-a-war between the buyers and sellers is hot and heavy. Yesterday’s price action did fail to show strong follow-through after the Morningstar Signal and did not close above its 50-SMA. But price remains in a T-Line trend and above the $256.40 support line. Readers of this blog should know we have had a concern about the resistance starting about $258.00. While price is currently battling resistance; price is also managing the trend. Overall we will remain cautiously bullish above $256.40, and below $256.40 we would watch for a test of the $250.30 area.
VIX–X Chart – Yesterday’s Bullish Engulf following a Doji closing in on the 200-SMA is a clue to be a little cautious as the sellers may try to put together an attack to regain the T-Line. Also, note the TC2000 / T2122 chart is pegged at 97.46. Stay sharp and respect the charts.
HRC Watch-list Trade-Ideas – WYNN, GE, CRON, AMRN, URI, CIEN, TWLO, LGIH. We cover the trade details each morning starting at 9:10 am Eastern in the HRC trading room and throughout the day. Trade-Ideas posted today may not trigger today or any other day. The key to trading is understanding how to trade. A trade alert means nothing without the education. Past performance does not guarantee future.
Real-Time Market Scanner
Built-In (Included) Scan Definitions. Bullish and bearish, Continuation, moving average crossovers and bounces. (RBB) Rounded Bottom Breakout alerts, intra-day, daily and weekly, Candlesticks stick signals and more. Scan Definitions- Download FREE
Hit and Run Candlesticks – Join Rick Daily in trading room #1 membership required. Join in, ask questions and learn how Rick picks his trades and trades them. 2018 account + 307% starting with only $5,100. Become a member of Hit and Run Candlesticks and let’s bring on 2019 Read More
Right Way Options Room Update – The RWO trading room is now open all day to share ideas and watchlist suggestions. Watch and learn from Doug as he prepares and explains his trades. Learn More about Right Way Options – Read More
Top Gun Day Trading Room is for the active day/scalp trader looking to profit daily with no overnight risk. Daily trade alerts and trading education. Read More
DISCLAIMER: Investing/ Trading involves significant financial risk and is not suitable for everyone. No communication from us should be considered as financial or trading advice. All information provided by it and Run Candlesticks Inc, its affiliates or representatives is intended for educational purposes only. You are advised to test any new approach before implementing it. Past performance does not guarantee future results. Terms of Service
SPY, to challenge the 50-SMA on SPY? The slow grind wall of worry is working slowly but surely. Price action seems determined to challenge the 50-SMA after the December low followed by a High/Low – Higher/high and a successful challenge of the 34-EMA. Yesterday markered the 5th green bullish bar based on our 17-EMA red-green tracking line. Yesterdays Bullish Morning star is suggesting the buyers want to challenge the 50-SMA. At $258.00 the SPY entered a resistance minefield for the bulls to navigate.
VIX–X Chart – The price
action trend is still down and no fear as of yet. Stay on your toes.
HRC Watch list additions – CHK, WLL, FTNT, ROKU, BDX, EBAY, SQ, MS. We cover the trade details each morning starting at 9:10 am Eastern in the HRC trading room and throughout the day. The key to trading is understanding how to trade. A trade alert means nothing without the education. Past performance does not guarantee future.
Real-Time Market Scanner
Built-In (Included) Scan Definitions. Bullish and bearish, Continuation, moving average crossovers and bounces. (RBB) Rounded Bottom Breakout alerts, intra-day, daily and weekly, Candlesticks stick signals and more. Scan Definitions- Download FREE
The LTA – Live Trading Alert Program is software that runs independently of any charting programs, an in real time finds chart setups. Hi, this is Rick Saddler founder of Hit and Run Candlesticks, as you know I have been using a live scan most of my trading career. It wasn’t until after I started to use the scanner that I became successful. Some people even say I am one of the best directional swing traders they have ever seen, that just not true; it’s because of the Live Scanner and what it does for me. It would be very hard for me to give up the scanner and believe every trader that wants to succeed needs to consider this tool.
You can get then scanner for a 30-day trial, but please keep it for at least 6-months to give it and you a chance. Below are a few scans it currently can run and we can customize scans for you! 30-Day Trial
Hit and Run Candlesticks – Join Rick Daily in trading room #1 membership required. Join in, ask questions and learn how Rick picks his trades and trades them. 2018 account + 307% starting with only $5,100. Become a member of Hit and Run Candlesticks and let’s bring on 2019 Read More
Right Way Options Room Update – The RWO trading room is now open all day to share ideas and watchlist suggestions. Watch and learn from Doug as he prepares and explains his trades. Learn More about Right Way Options – Read More
Top Gun Day Trading Room is for the active day/scalp trader looking to profit daily with no overnight risk. Daily trade alerts and trading education. Read More
DISCLAIMER: Investing/ Trading involves significant financial risk and is not suitable for everyone. No communication from us should be considered as financial or trading advice. All information provided by it and Run Candlesticks Inc, its affiliates or representatives is intended for educational purposes only. You are advised to test any new approach before implementing it. Past performance does not guarantee future results. Terms of Service
Follow-through below yesterdays low could lead price back to test the $254.55 / $252.85 area. The past four days the buyers have been able to string together four new highs and four new lows, however, the $258.00 area is proving to be more of a task then the buyers anticipated with the narrowing of the range. Follow-through below yesterdays low could lead price back to test the $254.55 / $252.85 area. The $258.00 resistance line is what we have talked about the last few days is also where the 60-min. 200-SMA has camped out.
The LTA – Live Trading Alert Program is software that runs independently of any charting programs, an in real time finds chart setups. Hi, this is Rick Saddler founder of Hit and Run Candlesticks, as you know I have been using a live scan most of my trading career. It wasn’t until after I started to use the scanner that I became successful. Some people even say I am one of the best directional swing traders they have ever seen, that just not true; it’s because of the Live Scanner and what it does for me. It would be very hard for me to give up the scanner and believe every trader that wants to succeed needs to consider this tool.
You can get then scanner for a 30-day trial, but please keep it for at least 6-months to give it and you a chance. Below are a few scans it currently can run and we can customize scans for you! 30-Day Trial
VIX–X Chart – The VIX chart shows not bullish sign as of yesterday’s close but very oversold, Side note: The T2122 4wk New High/Low Ratio chart is pegged in the overbought area.
HRC Watch list additions – It’s Friday, no trade ideas today. We cover the details of these trade ideas and others in the trading room throughout the day. We hope you join us to learn the trade details and how we plan to trade our trades. Past performance does not guarantee future.
Hit and Run Candlesticks – Join Rick Daily in trading room #1 membership required. Join in, ask questions and learn how Rick picks his trades and trades them. 2018 account + 307% starting with only $5,100. Become a member of Hit and Run Candlesticks and let’s bring on 2019 Read More
Right Way Options Room Update – The RWO trading room is now open all day to share ideas and watchlist suggestions. Watch and learn from Doug as he prepares and explains his trades. Learn More about Right Way Options – Read More
Top Gun Day Trading Room is for the active day/scalp trader looking to profit daily with no overnight risk. Daily trade alerts and trading education. Read More
DISCLAIMER: Investing/ Trading involves significant financial risk and is not suitable for everyone. No communication from us should be considered as financial or trading advice. All information provided by it and Run Candlesticks Inc, its affiliates or representatives is intended for educational purposes only. You are advised to test any new approach before implementing it. Past performance does not guarantee future results. Terms of Service
Follow-through below yesterdays low could lead price back to test the $254.55 / $252.85 area. The past four days the buyers have been able to string together four new highs and four new lows, however, the $258.00 area is proving to be more of a task then the buyers anticipated with the narrowing of the range. Follow-through below yesterdays low could lead price back to test the $254.55 / $252.85 area. The $258.00 resistance line is what we have talked about the last few days is also where the 60-min. 200-SMA has camped out.
VIX–X Chart – The VIX chart tested our $ 19.70 line with an Inverted Hammer with nine new lows out of ten candles. An oversold bounce seems to be logical within the next day or two. Side note: The T2122 4wk New High/Low Ratio chart is pegged in the overbought area.
HRC Watch list additions – CGC, KL, ROKU, TNDM, FB, PHYS, GE. We cover the details of these trade ideas and others in the trading room throughout the day. We hope you join us to learn the trade details and how we plan to trade our trades. Past performance does not guarantee future.
Hit and Run Candlesticks – Join Rick Daily in trading room #1 membership required. Join in, ask questions and learn how Rick picks his trades and trades them. 2018 account + 307% starting with only $5,100. Become a member of Hit and Run Candlesticks and let’s bring on 2019 Read More
Right Way Options Room Update – The RWO trading room is now open all day to share ideas and watchlist suggestions. Watch and learn from Doug as he prepares and explains his trades. Learn More about Right Way Options – Read More
Top Gun Day Trading Room is for the active day/scalp trader looking to profit daily with no overnight risk. Daily trade alerts and trading education. Read More
2 Hours Private coaching – Read More
Road To Wealth Coaching With Rick Saddler
Road To Wealth Coaching Looking for extended coaching? Serious out trading? Work with Rick Saddler on a daily basis. Read More
DISCLAIMER: Investing/ Trading involves significant financial risk and is not suitable for everyone. No communication from us should be considered as financial or trading advice. All information provided by it and Run Candlesticks Inc, its affiliates or representatives is intended for educational purposes only. You are advised to test any new approach before implementing it. Past performance does not guarantee future results. Terms of Service
The SPY moved closer to the $258.00 resistance area yesterday on bullish follow-through from the Bullish J-Hook continuation pattern drawn yesterday. We have moved our Bull/Bear line from $248.450 to $250.10. A close above $250.10 we will consider bullish. A close above $258.00 could draw in buyers to challenge $263.75. Keep in mind above $258.00 puts price action in a dangerous area.
VIX–X Chart – Extended it’s downtrend yesterday closing below its 50-SMA, we have seen support approaching, and a bounce could be near. The government shut down, and China will play a big part in how the VIX acts.
Hit and Run Candlesticks Watch-List AMD, GLUU, GE, JD, FDX, LLY, PG Past performance does not guarantee future results. To learn the trade details and how we plan to trade our watch-list and double our trading account in 2019 – Join In
3 Different Service to Choose From – Choose the One That Fits Your Needs
Hit and Run Candlesticks – Join Rick Daily in trading room #1 membership required. Join in, ask questions and learn how Rick picks his trades and trades them. 2018 account + 307% starting with only $5,100. Become a member of Hit and Run Candlesticks and let’s bring on 2019 Read More
Right Way Options Room Update – The RWO trading room is now open all day to share ideas and watchlist suggestions. Watch and learn from Doug as he prepares and explains his trades. Learn More about Right Way Options – Read More
Day Trading Room– Began the new year with some decent trades while risking only $100 or less per trade. If your a day trader or aspiring to be a day trader, this is the place to be. Steve proves hisself every day day trading and sleeping well at night.
DISCLAIMER: Investing/ Trading involves significant financial risk and is not suitable for everyone. No communication from us should be considered as financial or trading advice. All information provided by it and Run Candlesticks Inc, its affiliates or representatives is intended for educational purposes only. You are advised to test any new approach before implementing it. Past performance does not guarantee future results. Terms of Service
The SPY is forming a Bullish J-Hook pattern off what could be a reversal bottom. With bullish follow-through from the close on Friday. Price action will start to feel resistance in the $258.00 area or the 34-EMA. Any close above $248.40 we will consider Bullish, and a challenge of $258.00 – $259.00 is probable. VIX–X Chart – Closed last week with a Shooting Star candle signal giving the bullish in the broader market a chance to recoup bullish profits. With selling follow through the 50-SMA could be in for a test.
VIX–X Chart – Closed last week with a Shooting Star candle signal giving the bullish in the broader market a chance to recoup bullish profits. With selling follow through the 50-SMA could be in for a test.
Right Way Options Room Update – The RWO trading room is now open all day to share ideas and watchlist suggestions. Watch Doug as he prepares and explains his trades. Learn More about Right Way Options – Click Here
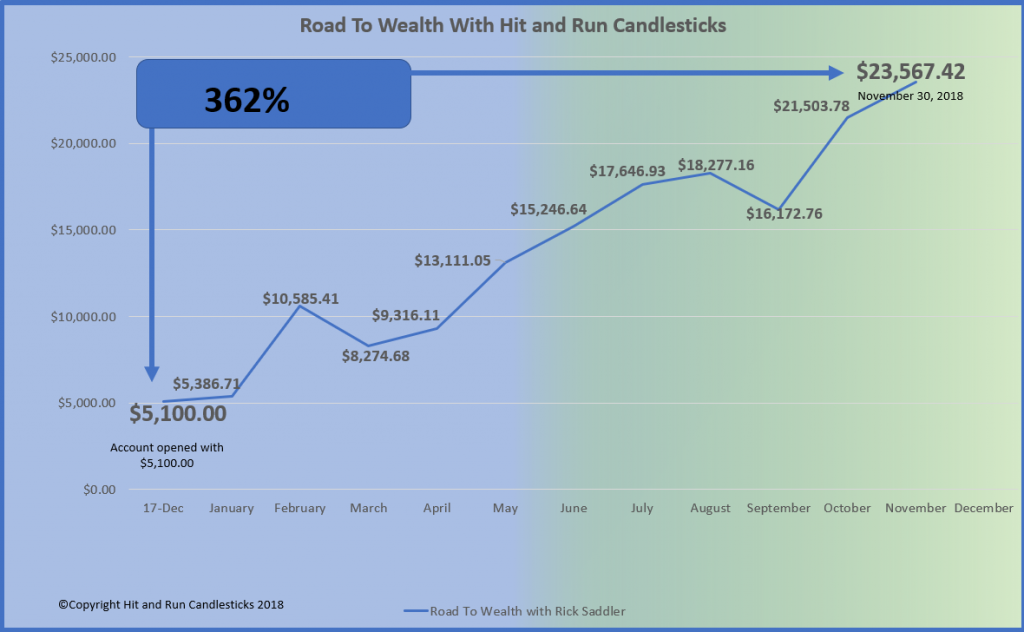
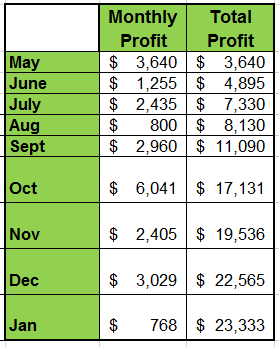
The Road to Wealth • Inner Circle – January of 2018, Rick decided to open a small $5,000.00 trading account to show small and large account traders can make a difference in the financial future. For 2019 Rick plans on taking the now $23,567.00 account to $50,000.00 before December 31, 2019. Remember he already has increased the account $5,000.00 to $23,567.00 or 362% in 2018.
From HRC Trading Desk
Dear trader, trading on stock pics alone, even with entries, targets and stops will likely not work out so good for you. You must have the proper discipline and trading education. Stocks we add to our trade watch-list does not mean they are a trade today.
You might not be ready to trade if:
All you want is a stock pic
You think every trade should work out
If you have to ask; is this a long or a short
If you think you have to stare at a computer all day
The following tickers are setting up on our trade list: NFLX, JD, LVS, PYPL, MRK, MO, EBAY, GE, PG. Past performance does not guarantee future results. Learn how to trade before you trade.
For 2019 Rick plans on taking the now $23,567.00account to $50,000.00 before December 31, 2019. Remember he already has increased the account $5,000.00 to $23,567.00 or 362% in 2018. Would you like to learn from someone that truly makes money, not just one hit wonders and backs it up with his account statement!
DISCLAIMER: Investing/ Trading involves significant financial risk and is not suitable for everyone. No communication from us should be considered as financial or trading advice. All information provided by it and Run Candlesticks Inc, its affiliates or representatives is intended for educational purposes only. You are advised to test any new approach before implementing it. Past performance does not guarantee future results. Terms of Service