VIX Closed With A Doji
The COBE Market Volatility Index “VIX” closed with a Doji on the 34-EMA yesterday and with the previous day’s candle, we have a Bearish Doji Continuation Pattern. With a close below the 34-SMA and follow-through price action may want to test the $20.40 area or the 34-EMA on the 3-day chart.
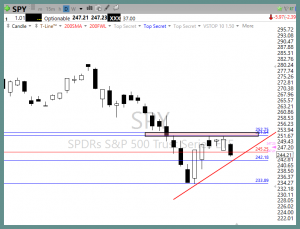
On the daily SPY chart, you can see the relief rally from the Bullish Morning Start in late December, a nice rally until a little resistance. As of yesterdays close the last four candles have been a bullish pullback working on a “Lower Low.”
A close today or the very near future over $252.75 would set up a “Low/High-Higher Low/ Higher High chart pattern, also called a continuation pattern. Of Course, a close below $245.25 would suggest the sellers are stronger than the buyers.
Right Way Options Trading Room
Right Way Options Room Update – The RWO trading room is now open all day to share ideas and watchlist suggestions. Watch Doug as he prepares and explains his trades. Learn More about Right Way Options – Click Here
Testimonial From Rick Saddler Fonder of Hit and Run Candlesticks – After 30-years of stock swing trading I now swing trade Simple Directional Options, and my 2018 trading account is up over 360%. Thank
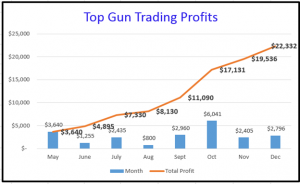
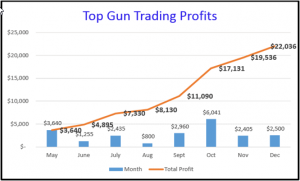
Top Gun Day Trading Room
Day Trading Room Update – The Top Gun Trading room began the new year with some decent trades up over $300 while risking only $100 per trade. Our latest trades include:
- 1 x TSLA Put trade for +$125
- 2 x QLD trades for +65
- 2 x SPXS trades for $114
- Learn More about Top Gun Day Trading – Click Here
Hit and Run Candlesticks Trading Room
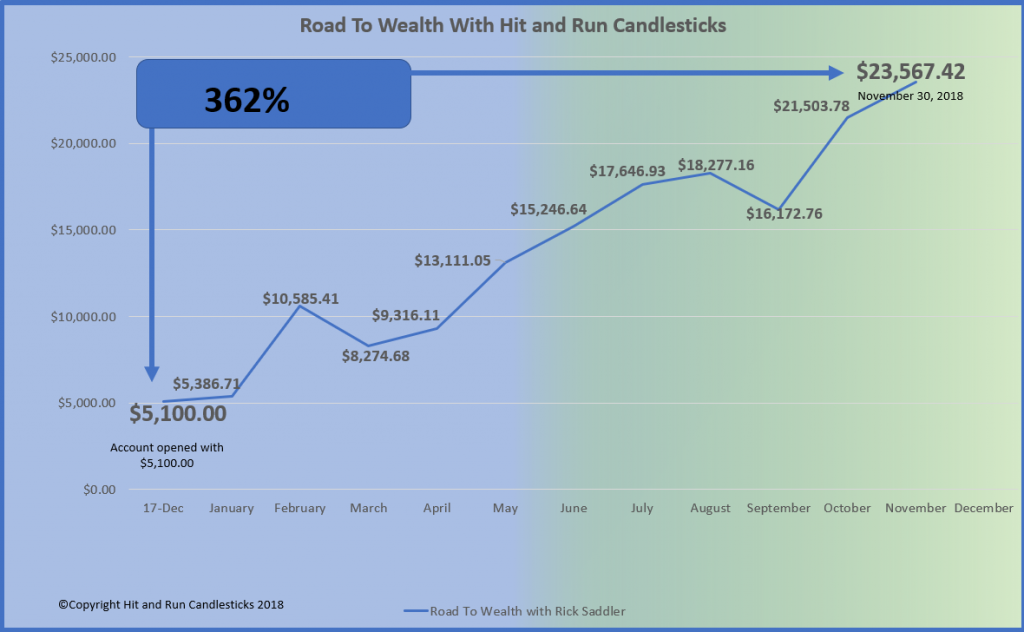
The Road to Wealth • Inner Circle – January of 2018, Rick decided to open a small $5,000.00 trading account to show small and large account traders can make a difference in the financial future.
For 2019 Rick plans on taking the now $23,567.00 account to $50,000.00 before December 31, 2019. Remember he already has increased the account $5,000.00 to $23,567.00 or 362% in 2018.
If you are interested in working with Rick Saddler and the Inner Circle click the button below and ask for more information. – Learn More Here
For 2019 Rick plans on taking the now $23,567.00account to $50,000.00 before December 31, 2019. Remember he already has increased the account $5,000.00 to $23,567.00 or 362% in 2018. Would you like to learn from someone that truly makes money, not just one hit wonders and backs it up with his account statement!
Trading Services We Offer
Free YouTube Education • Subscription Plans • Private 2-Hour Coaching
DISCLAIMER: Investing/ Trading involves significant financial risk and is not suitable for everyone. No communication from us should be considered as financial or trading advice. All information provided by it and Run Candlesticks Inc, its affiliates or representatives is intended for educational purposes only. You are advised to test any new approach before implementing it. Past performance does not guarantee future results. Terms of Service