The focus will be onMr. Powell and the FOMC at 2:00 pm today. Does Powel announce a rate hike today? The words he uses for the future will be just as important, but more importantly is how the market interprets the information given.
No surprise the price action of the SPY is still bearish in relationship to the T-Line and the T-Line, 34-EMA, and 50-SMA are trending lower below the 200-SMA. The candle actionof the last two days has printed a Tweezer Bottom in a possible support area. ATweezer Bottom on support is just a clue in the big picture. Bullish follow-throughis required for any bullish meaning. And support means very little withoutbullish confirmation. Let’s fasten our seatbelts and keep our arms and legsinside the bus, could get crazy today.
Hit and RunCandlesticks and Right Way Options have opened our doors forthe holidays; this would be a great time to get to know us, ask a question aboutour service and put a few $$$ in your pocket. Trading Rooms #1 and #2 no password required – https://hitandruncandlesticks.com/trading-rooms/
Long and ShortTrade-Ideas
AG, FSM, PHM, NEM, AES, USFD, ESRX, AVGO, COP, SEAS are on our watchlist for a possible trade today or within the next few days.
AG is our featured trade-idea today because it alerted an (RBB) RoundedBottom Breakout with a Stock Swing Trade of about 10% or more and an Options Trade of 30% or more. Members log in for more details. Past performance does not guarantee future results.
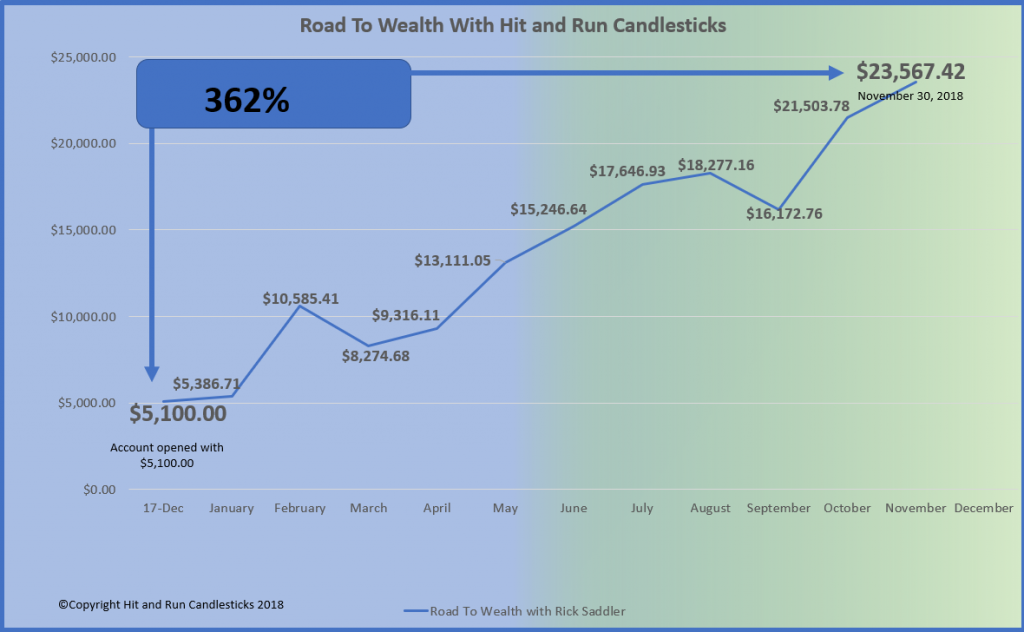
For 2019 Rick plans on taking the now $23,567.00account to $50,000.00 before December 31, 2019. Remember he already has increased the account $5,000.00 to $23,567.00 or 362% in 2018. Would you like to learn from someone that truly makes money, not just one hit wonders and backs it up with his account statement.
DISCLAIMER: Investing/ Trading involves significant financial risk and is not suitable for everyone. No communication from us should be considered as financial or trading advice. All information provided by it and Run Candlesticks Inc, its affiliates or representatives is intended for educational purposes only. You are advised to test any new approach before implementing it. Past performance does not guarantee future results. Terms of Service
A traders code for (Bullish trends), Higher highs and lower lows, and the opposite for (Bearish trends) Lower lows and Lower highs. The following charts have been following the bearish code. IYT, SMH, FDX, and COPX are a few charts I watch to get the pulse of the market. You can get the same picture by using three moving averages such as The 3-EMA, T-Line, and 34-EMA, another popular combo is the 3-EMA, T-Line, and17-EMA or simply three moving averages that make sense to that fit in your trading world. When you look at the above charts and the moving average groupings what do you see?
Hit and RunCandlesticks and Right Way Options have opened our doors forthe holidays; this would be a great time to get to know us, ask a question aboutour service and put a few $$$ in your pocket. Trading Rooms #1 and #2 no password required – https://hitandruncandlesticks.com/trading-rooms/
Watchlist Ideas
Becauseof technical issues, we will not have any trade ideas for the watchlist today.After the market open the LTA scanner will find up more we can trade. Thank you for your understanding.
For 2019 Rick plans on taking the now $23,567.00account to $50,000.00 before December 31, 2019. Remember he already has increased the account $5,000.00 to $23,567.00 or 362% in 2018. Would you like to learn from someone that truly makes money, not just one hit wonders and backs it up with his account statement.
DISCLAIMER: Investing/ Trading involves significant financial risk and is not suitable for everyone. No communication from us should be considered as financial or trading advice. All information provided by it and Run Candlesticks Inc, its affiliates or representatives is intended for educational purposes only. You are advised to test any new approach before implementing it. Past performance does not guarantee future results. Terms of Service
The savvy trader knows how
to make money in all markets, but the savvy trader needs the right tools and understands
charts. Keep reading for a few of my thoughts. Bullish data is desperately needed,
or the bull will likely endure more pain. Currently, I see three events that could
potentially hurt or help the market. The first event is the FOMC statements this
week, the government shutdown, and the China trade issues. Currently, the SPY, DIA’s and QQQ’s are testing areas that could
lead to erasing 2017 gains just as we have seen in the 2018 gains.
Transports are looking broken and weak. The Transports ETF (IYT) has broken the bullish weekly trend line, ralliedfor a trendline challenge and failed. Price is looking for support, and withouta bullish catalyst, $162.40 looks to be inviting price.
Watchlist Ideas
We are adding PGR to our watchlist for a short trade. The weekly chart has failed top with bearish follow through. Last week’s weekly candle supported the Bearish Engulf and closed below the weekly50-SMA setting for a Blue Ice Failure strategy. For more information, (entry,Targets, and Stop) please join us in the trading room.A few others that we have on our trade list is MDB, DVMT, PG, KO, TXN, IMMU, NFLX. Past performance does not guaranteefuture results. Learn how to trade before you trade.
Yes, The Little Account Can!
For 2019 Rick plans on taking the now $23,567.00account to $50,000.00 before December 31, 2019. Remember he already has increased the account $5,000.00 to $23,567.00 or 362% in 2018. Would you like to learn from someone that truly makes money, not just one hit wonders and backs it up with his account statement.
DISCLAIMER: Investing/ Trading involves significant financial risk and is not suitable for everyone. No communication from us should be considered as financial or trading advice. All information provided by it and Run Candlesticks Inc, its affiliates or representatives is intended for educational purposes only. You are advised to test any new approach before implementing it. Past performance does not guarantee future results. Terms of Service
Looks like members will take a little cash home today on the shorts and PUTS. Way To Go!! Yesterday I bought PUTs on the QQQ’s, and I know others who had PUTS on IWM, SPY and DIA’s
Yesterday S&P-500 ETF (SPY) closed below the T-Line for the 7th day in a row on the daily chart, and the weekly chart is still drawing a Doji. This week high$269.00 is what the buyers need to bust to gain any traction. The sellers look as if they want to revisit the October, November, December lows or close to them.
From Our Day Trading Division
Top Gun Day Trading had a fantastic week and a month so far. Here is the note I received from Steve Risner.
We finished the week +$1,445 for the week and are up $1,920 for the month. Have a great weekend everyone. We love the volatility in the market, in and out within a day. Sleep better at night
Yes, the little account can make it in the trading game, and the good traders can be better. Back in January this year I opened a little trading account to prove a prove a point (and to see if I could do it). The project was called “Road To Wealth.” I opened the account with $5,100.00, and as of 11/30/18, the account is worth $23,567.00 or a 362% increase.
If you would like to learn from someone that truly makes money not just one hit wonders and backs it up with his account statement. Click The Button Below
DISCLAIMER: Investing/ Trading involves significant financial risk and is not suitable for everyone. No communication from us should be considered as financial or trading advice. All information provided by it and Run Candlesticks Inc, its affiliates or representatives is intended for educational purposes only. You are advised to test any new approach before implementing it. Past performance does not guarantee future results. Terms of Service
Looking at the two recentcandles on a weekly chart, I see a Doji battling a Bearish Engulf. The T-Line is trending below the 34-EMA, and now the 34-EMA is trending below the 50-SMA. Between$262.25 and $280.26, the buyers and sellers have been beating each other backan fourth creating a crazy amount of volatility in the market. The daily chart is fighting to create a little momentum above $262.25 to challenge the minefield up to the $280.25 area. Based on price action and the charts the bears have the advantage, and the bulls on have small relief rallies to work with.
Watchlist Ideas
GRPN is now on our trade list after it closed above the 50-SMA yesterday. We will use the Rounded Bottom Breakout trade plan and rules. A few others that we have on our trade list is MRK, TWTR, PG, MSFT, TWLO, VIPS, CSIQ, GRPN, ETSY, FEYE, FEYE, ABX, NEM. Past performance does not guarantee future results. Learn how to trade before you trade.
Yes, The Little Account Can!
Yes, the little account can make it in the trading game, and the good traders can be better. Back in January this year I opened a little trading account to prove a prove a point (and to see if I could do it). The project was called “Road To Wealth.” I opened the account with $5,100.00, and as of 11/30/18, the account is worth$23,567.00 or a 362% increase.
DISCLAIMER: Investing/ Trading involves significant financial risk and is not suitable for everyone. No communication from us should be considered as financial or trading advice. All information provided by it and Run Candlesticks Inc, its affiliates or representatives is intended for educational purposes only. You are advised to test any new approach before implementing it. Past performance does not guarantee future results. Terms of Service
The price action of the SPY closed below the T-Line, and the T-Line closed below the 34-EMA. Theinformation I just mentioned has been information I have used for years, and ithas served me well. Not only in the indices but trading charts as well. Thequestion now is how can you use that information.
Yesterday the SPY respected
the current bottom and Mondays Hammer candle; The morning futures are up at the
moment; maybe there is hope for the bull. BUT the trend in the SPY is still down,
for the buyers to get started they would have to close over the Morning Star
pattern, above $269.45
(CPB)Hammer/Morning Star Candles
Weare adding CPB to Live Scanner watchlist to be alerted when price action makes a 2-bar high. The 2-bar high will be the alert telling us when there is price action positive follow through. Positive price action may lead to a test of the200-SMA followed by the $40.65 test. Then we will have a weekly RBB set up. CPBwouldbe a 2-3-month option play. The market is a mess right now and may not bethe best market to trade for most traders, stay cautious.
LTA – Real-Time Stock Scanner
Rick uses three main trading tools and has dialed them in for max performance. Rick also freely shares his insights on what makes the tools the best and how to use them. Rick is also one of the only traders in the industry that shares his trading account.Traspaerancey and Trading Results.
DISCLAIMER: Investing/ Trading involves significant financial risk and is not suitable for everyone. No communication from us should be considered as financial or trading advice. All information provided by it and Run Candlesticks Inc, its affiliates or representatives is intended for educational purposes only. You are advised to test any new approach before implementing it. Past performance does not guarantee future results. Terms of Service
So the question todayis: Are we starting another relief rally? The answer is yes it would appear so.Yesterday the sellers pushed hard to, but the buyers pushed back a littleharder to draw a Hammer. The futures are feeling bullish this morning, and itlooks like the SPY will open higher. This week will be no time for the buyersto give up, the following key levels are what the buyers need to own: $269.95,$275.60, $281.05. Price reaching anyone of these numbers will be a relief rallywithin a downtrend, the sellers will be out like trick or treaters on Hollowee nnight looking for candy.
(FB)Bullish Piercing Candle
Webought FB yesterday as did a few subscribers in the trading room. We feel FB isbullish over $143.30. Facebook has drawn a Bullish (PBO) Pricing candle and proved to follow through yesterday. Price didclose over the daily downtrend line and challenged the 60-min 200-SMA. Cautionas we approach the 50-SMA.
Real-Time Stock Scanner
Rick uses three main trading tools and has dialed them in for max performance. Rick also freely shares his insights on what makes the tools the best and how to use them. Rick is also one of the only traders in the industry that shares his trading account.Traspaerancey and Trading Results.
DISCLAIMER: Investing/ Trading involves significant financial risk and is not suitable for everyone. No communication from us should be considered as financial or trading advice. All information provided by it and Run Candlesticks Inc, its affiliates or representatives is intended for educational purposes only. You are advised to test any new approach before implementing it. Past performance does not guarantee future results. Terms of Service
The price action on Friday struggled then held Thursdays low, and we now have a triple test bottom with the past four candles suggesting the sellers have control. With price action below the daily 50-SMA and weekly 200-SMA on top of the three failed highs, I would have to say the market is not looking so good. Short term relief rallies are normal just not likely to produce large bullish moves until price crosses levels. Three important key levels are $270.64, $277.25. 281.25.
Friday I went to all-cash taking a pro-active stance on protecting the 362% we are up this year on the “Road To WealthAccount.” Going forward into the end of the year I will be trading like I am walking on thin lake ice. The game is to create wealth not pick lotterytickets. The “Road To Wealth” Brokerage Statement can be found by Clicking Here
Today’s Trade-Idea Thoughts
We have not increased our “Road To Wealth Account” simple by trading willy-nilly and don’t intend to start today. Today we will talk about trades in the trading room when we see the attitude of the market and not before.
362% November Statement
Rick uses three main trading tools and has dialed them in for max performance. Rick also freely shares his insights on what makes the tools the best and how to use them. Rick is also one of the only traders in the industry that shares his trading account.Traspaerancey and Trading Results.
DISCLAIMER: Investing/ Trading involves significant financial risk and is not suitable for everyone. No communication from us should be considered as financial or trading advice. All information provided by it and Run Candlesticks Inc, its affiliates or representatives is intended for educational purposes only. You are advised to test any new approach before implementing it. Past performance does not guarantee future results. Terms of Service
The SPY found support
and worked itself back up above the T-Line Bands but still controlled by the
bears. Price remains below the 200-SMA, and the 50-SMA is kissing the 200-SMA.
I have found when the market is in rough waters, and the sellers are the captain
of the boat. Longs are only good for very short term relief rallies. The short
trades seem to be better, but they are a bit shaky at the moment. The good news
it’s Friday, and we get to count our money! Remember cash is a position.
Rick uses three main trading tools and has dialed them in for max performance. Rick also freely shares his insights on what makes the tools the best and how to use them. Rick is also one of the only traders in the industry that shares his trading account.Traspaerancey and Trading Results.
DISCLAIMER: Investing
/ Trading involves significant financial risk and is not suitable for
everyone. No communication from us should be
considered as financial or trading advice. All information provided by
Hit and Run Candlesticks Inc, its affiliates or representatives is intended
for educational purposes only. You are advised to test any new approach before implementing it. Past performance
does not guarantee future results. Terms of Service
Tuesday we saw the SPY sell off confirming the Hanging Man Candle and another failed attempt for the bulls to control price action above both the 50 and 200-SMA’s. The futures this morning will be punishing most long positions held. Taking a look at the weekly SPY chart, I can see a tight nasty Blue Ice Failure set up, (keep in mind follow-through is required). 2016 was the last time price action of the SPY was near the 200-SMA on the weekly chart, and it’s starting to look like a future test is in the game.
(BAC) Weekly Blue Ice Bearish Engulf
The weekly chart is showing a Bearish Engulf and a Blue Ice short set up which could be pointing price to the 200-SMA or about $21.70. We are adding BAC to the LTA-Live Trading Alerts Real Time Market Scanner watchlist for management and buying alert. I will consider BAC Jan 18, 2019, $28.00 PUT.
Rick uses three main trading tools and has dialed them in for max performance. Rick also freely shares his insights on what makes the tools the best and how to use them. Rick is also one of the only traders in the industry that shares his trading account. Traspaerancey and Trading Results.
****VXX– Bullish Morning Star closed over both the 50 and 200-SMA
DISCLAIMER: Investing / Trading involves significant financial risk and is not suitable for everyone. No communication from us should be considered as financial or trading advice. All information provided by Hit and Run Candlesticks Inc, its affiliates or representatives is intended for educational purposes only. You are advised to test any new approach before implementing it. Past performance does not guarantee future results. Terms of Service