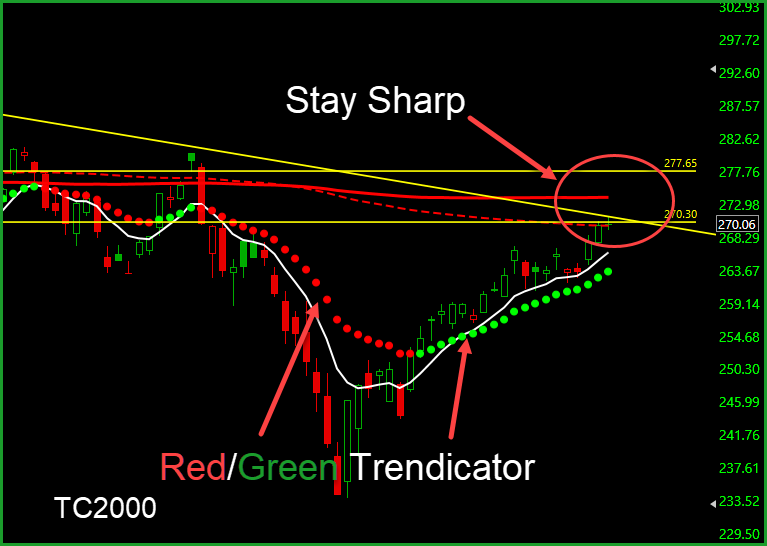
The battle between Bullish and Bearish is up front and center lately. On Friday the SPY daily chart closed with a Doji in the thick of resistance, the trend remains bullish with price leading the T-Line and the T-Line leading the 34-EMA. The 20-SMA and 34-EMA have risen above the 50-SMA. Friday’s price action felt the pressure of the bearish downtrend line and the 200-SMA is trying to intimidate price. The area surrounding the 200-SMA ($270.30 and $277.65) will likely be a challenge for price action. Price is currently at our Dotted Duece line, success over the Dotted Duece should result in a challenge of the 200-SMA. Both areas will take the full power of the Bull, keep a watchful eye out for that sneaky little Bear. We are concerned about the T2122 levels in TC2000 pegged above 80 for so long. These high levels are concerning and a warning clue. BUT price and trend is king, and as long as price action remains bullish over the RED/GREEN Trendicator, we will remain cautiously bullish. The CBOE Market Volatility Index (VIX) The CBOE Market Volatility Index (VIX) price action is showing no signs of fear with price below the T-Line and the T-Line below the Re/Green line.
From out trade-idea list: NBR, KKR, WDC, MU, NTAP, NYL, LVS, HAL will be talked about in our pre-market workshop. Past performance does not guarantee future results.
DISCLAIMER: Investing/ Trading involves significant financial risk and is not suitable for everyone. No communication from us should be considered as financial or trading advice. All information provided by it and Run Candlesticks Inc, its affiliates or representatives is intended for educational purposes only. You are advised to test any new approach before implementing it. Past performance does not guarantee future results. Terms of Service
What fantastic day yesterday, heck what a fantastic month January has been, check the Thursday, January 31, end of day blog post. You can see what a few our members did. If your We are kicking February off with a 30% discount on our membership. I will also be offering 1-hour free coaching for the first ten that takes advantage of the 30% discount!
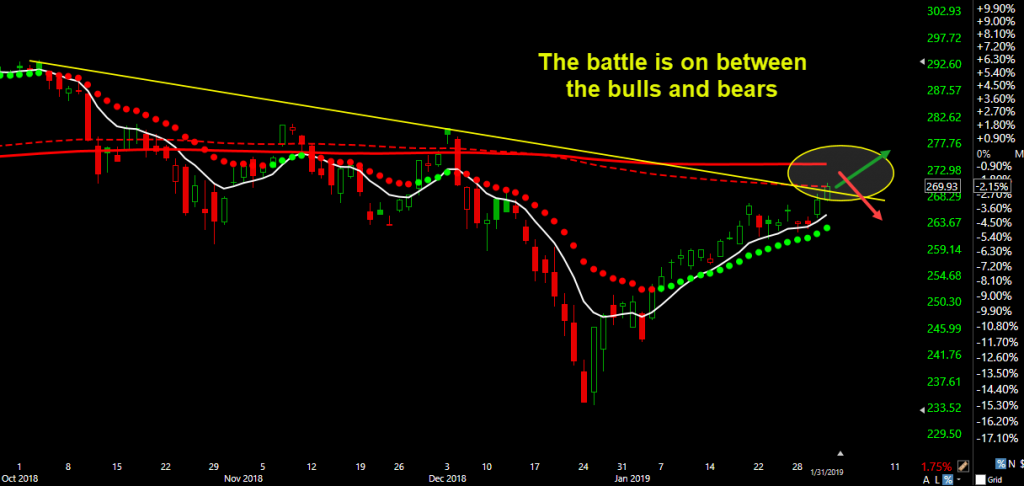
The SPY closed higher yesterday at $269.93 on the HRC Dotted Deuce Line. The follow-through yesterday extended the bullish J-Hook continuation as well. As of yesterdays close the bulls have ignored and resistance the bears have tried to put up. In our recent blogs and the trading room, I have stated we are cautiously bullish. Yesterday we practiced Base Hits and closed all the good profitable positions and now getting more interested in adding a PUT or two. The TC2000 T2122 chart is pegged at 98.56, I for one have never seen the T2122 this high for this long. On the Bull side, price continues to ride the T-Line, and the T-Line is riding the Red/Green Trendicator Line. For the Bears, the resistance is in please, now it’s up to the bulls to what they are going to do with that information.
The CBOE Market Volatility Index (VIX) Closed at another low yesterday on the 200-SMA. It seems there is no fear in this market, at least for now.
DISCLAIMER: Investing/ Trading involves significant financial risk and is not suitable for everyone. No communication from us should be considered as financial or trading advice. All information provided by it and Run Candlesticks Inc, its affiliates or representatives is intended for educational purposes only. You are advised to test any new approach before implementing it. Past performance does not guarantee future results. Terms of Service
Check out what a few members posted in the trading room today! It’s so fun pulling profits from the market. You gotta love the base hits.
(09:47 am) Malcolm M: I held my AMD, 16% today so far. (09:47 am) Aaron the red baron: 76% on AMD, can I get 100% today… (09:48 am) kirk p: HRC team, Just wanted to say thank you for all you do. My education has skyrocketed since I joined last May. You are appreciated! (09:49 am) Malcolm M: Ditto Kirk.. both my Mental Equity has appreciated and my Financial Equity has grown. (09:50 am) Ian Smith: Kirk I second that. Only been here for a few weeks. Not trading yet, but feeling like this is the best investment I’ve made for a long time (09:50 am) Malcolm M: TWLO, 44min, up 20.25%, no sell signal yet… current trade is only 3 spot but up $1,121 (09:52 am) Lowell W: various JD and VLO calls GTC sold at options mkt open for +20% and +25%. Making one week’s target is a nice start to the day. (09:53 am) Malcolm M: TWLO: took 1/3 off, less than half an hour, $4.58, 24.83%, continue to hold 2 contracts. Stop moved to BE. (09:57 am) Aaron the red baron: Sold my two positions in AMD one for 83%, the other for 50%…..I’m outta here, that will do for the week (09:57 am) Claude Langley: out remainder AMD + 50% (09:58 am) Doug Campbell: Closing JD for 55% (10:02 am) Lowell W: Just closed a FB $140 call… made a 100%’er, may have been my first one. Today is over 3x my week’s goal. (10:06 am) Aaron the red baron: took 25% out of JD
(10:07 am) Malcolm M: 10% today in VIPS, 16% SQ, 6.7% ROKU, 23.5% AMD, 16% NVDA, 27% in TWLO… its a Very good day but I haven’t had my second cuppa yet! Not seeing any sell signals in /ES or /NQ (10:23 am) jerry g: took 58% on GLD calls (10:23 am) Elizabeth Lamond: sold Roku 23% done for the week too scary up there 😉 (10:23 am) Bill M.: Sold my GE for 87% (10:25 am) Linda J: Out of GE at 86%. (10:26 am) Rick Saddler: Closed GE 69% (10:41 am) Flash .: Sold some SQ @ 6% (10:47 am) Craig Kleinbart: just took some profits on FNGU
(10:48 am) Malcolm M: SQ, taking profits. $2.69, 31.64%, one contract, still holding majority. (10:51 am) Flash .: Malcolm, just call me chicken (10:53 am) Flash .: JNJ 14% (11:24 am) Rick Saddler: Closed AMD 50.68%
DISCLAIMER: Investing/ Trading involves significant financial risk and is not suitable for everyone. No communication from us should be considered as financial or trading advice. All information provided by it and Run Candlesticks Inc, its affiliates or representatives is intended for educational purposes only. You are advised to test any new approach before implementing it. Past performance does not guarantee future results. Terms of Service
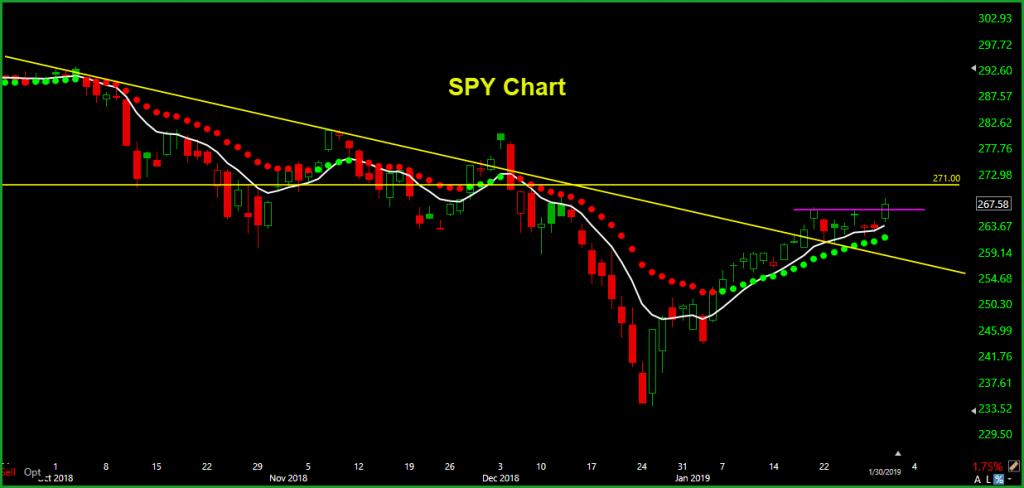
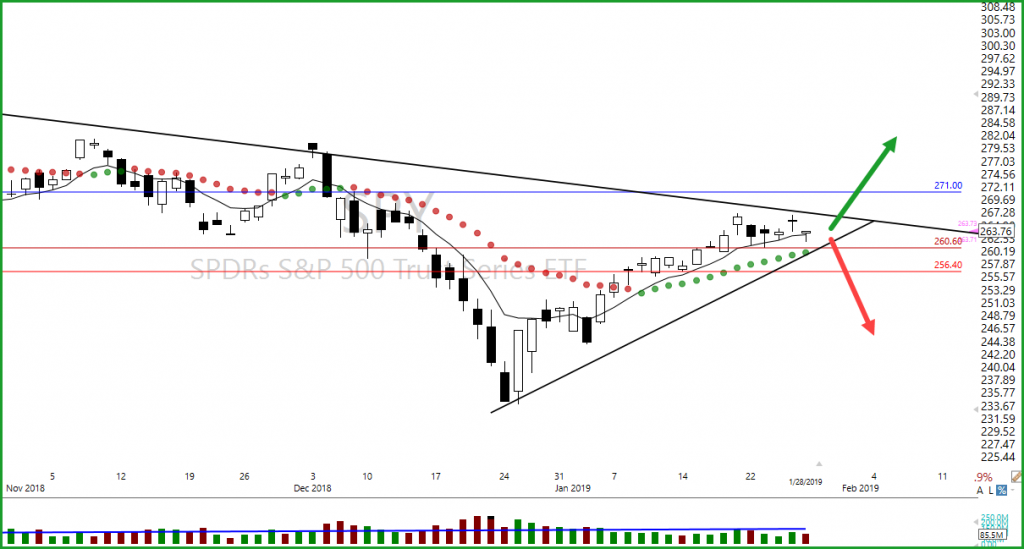
The continuation pattern held together in the SPY with the help of a few good earnings and Mr. Powell (Fed Report). The TC200O Red/Green Trendicator has done a great job keeping us on the bullish side of the SPY. The SPY has been trending up, and on January 22, price pulled back, for the following six days price walked along the Green Dot trendline forming a continuation pattern. Yesterday the buyers/bulls broke out and closed above the recent highs. The next big warning area will be the start of $271.00. Above $271.00 also gets price action into the HRC Dotted Duece line and the 200-SMA moving averages. I am starting to see a few signs that the market is a bit stretched, moving higher into resistant levels and the T2122 chart in TC2000 flashing warning. As long as price action remains bullish, we will remain cautiously bullish. The chart below illustrates the Yellow downtrend line the bulls have beat, the yellow horizontal line pointing out more resistance and the Red/Green Trendicator bull trend. The short magenta line is pointing out the continuation pattern breakout. The most important information the next day or 2 is whether or not we get bullish follow through. Another piece of useful information to help navigate the market is that the DJ-30 is testing the $25,000 area and the 200-SMA, watch price action for clues to direction.
The CBOE Market Volatility Index (VIX) closed back below the T-Line yesterday, below the Red/Green Trendicator showing lack of fear. Note price is testing the 200-SMA area which can always spark buying.
The following tickers are being added to our trade list: PANW, AAPL TWLO, PG, NKE, SWKS, WLL, DVN, NBR. Past performance does not guarantee future results. Learn how to trade before you trade.
Private 2-hour coaching with Rick Saddler only $354.00 for non-members and $300.00 for members. Learn More
The “Road to Wealth Coaching” – Work with Rick Saddler daily and learn how he plans to double his trading account this year 2019. Learn More
DISCLAIMER: Investing/ Trading involves significant financial risk and is not suitable for everyone. No communication from us should be considered as financial or trading advice. All information provided by it and Run Candlesticks Inc, its affiliates or representatives is intended for educational purposes only. You are advised to test any new approach before implementing it. Past performance does not guarantee future results. Terms of Service
In this 1-hour video,“The Power of Base Hits” Rick talks about how profiting into strength and taking base hits can make a huge difference in your bottom line and monthly income. Rick also shares what some of his trading edges are. Such as • Profiting into strength • Same basic strategies • Real-Time Alerts • Weakness/Strength • Keep it simple • Embrace losses. He will also share how he looks at charts with entries, swing targets, and stops. Don’t forget Subsribe to our YouTube channel https://bit.ly/2q2N3ZQ
The charts in this video are for educational purposes only. No communication from Hit and Run Candlestick Inc should be considered as financial or trading advice. Past performance does not guarantee future results.
Private 2-hour coaching with Rick Saddler only $354.00 for non-members and $300.00 for members. Learn More
The “Road to Wealth Coaching” – Work with Rick Saddler daily and learn how he plans to double his trading account this year 2019. Learn More
DISCLAIMER: Investing/ Trading involves significant financial risk and is not suitable for everyone. No communication from us should be considered as financial or trading advice. All information provided by it and Run Candlesticks Inc, its affiliates or representatives is intended for educational purposes only. You are advised to test any new approach before implementing it. Past performance does not guarantee future results. Terms of Service
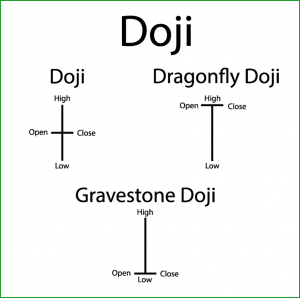
The big Apple (APPL) has reported, not as bad as thought; pre-market is up. Now we take a seat and patiently wait for the 2:00 pm bus. The FOMC decision Hawk or Dove will be out at 2:00 pm today, rate hikes, up or up more and when. Knowing this information could help the market get off its fanny and make a move one way or the other. Yesterday the SPY closed with another indecision Doji, the 5hth one in the past five days. “Think the market is waiting for something”? The chart patterns and price action remains bullish as price holds over the 50-SMA and slides sideways. The price action is trapped between a bearish downtrend line and the 200-SMA and a bullish uptrend line and the 50-SMA. Unfortunately, neither the buyers or sellers have had enough juice to move price up or down. So we patiently wait sitting along side the road for the bull or bear bus to show up. The CBOE Market Volatility Index (VIX) closed above the T-Line yesterday, but the Red/Green Trendicator is still red on the daily chart. The VIX- would have to break out over the Trendicator to consider fear. There is plenty of reasons to remain concerned or even be sitting out of this market right now. I do remain cautiously bullish.
The following tickers are being added to our trade list: WHR, NNBR, APA, DVN, SCHW, GS, HD, NKE, JD. Past performance does not guarantee future results. Learn how to trade before you trade.
Private 2-hour coaching with Rick Saddler only $354.00 for non-members and $300.00 for members. Learn More
The “Road to Wealth Coaching” – Work with Rick Saddler daily and learn how he plans to double his trading account this year 2019. Learn More
DISCLAIMER: Investing/ Trading involves significant financial risk and is not suitable for everyone. No communication from us should be considered as financial or trading advice. All information provided by it and Run Candlesticks Inc, its affiliates or representatives is intended for educational purposes only. You are advised to test any new approach before implementing it. Past performance does not guarantee future results. Terms of Service
FOMC today and tomorrow, big earnings this week YIKES! I you ever heard me say “I don’t like earnings?” Well, I don’t. I have seen earnings kill trading accounts and set traders back months on their profit progress. And then on top of it all, we have the FOMC rate decision this week as well. As you can see from the SPY chart below, price action is walking right into the right corner of the up and down trend lines. The bigger direction decision will likely show itself once the buyers or sellers push the price above the downtrend line or below the uptrend line. The last six candles have simply been consolidation above support and below resistance. For the bulls, the price has been trending above our Red/Green trend line, and the past seven candles have held above the $260.60 support line while at the same time the bears have held price in a tight range below the downtrend line. I suspect a big decision is coming soon. The CBOE Market Volatility Index (VIX) closed once again below the T-Line and the Red/Green trend line. However, with a double bottom and a possible breakout of $21.95 would create a bullish chart pattern. There is plenty of reason to be concerned or even be sitting out of this market right now. I do remain cautiously bullish.
The following tickers are setting up on our trade list: WDC, CBS, SGMS, APA, ROKU, JD, SWKS, C, CZR. Past performance does not guarantee future results. Learn how to trade before you trade.
Private 2-hour coaching with Rick Saddler only $354.00 for non-members and $300.00 for members. Learn More
The “Road to Wealth Coaching” – Work with Rick Saddler daily and learn how he plans to double his trading account this year 2019. Learn More
DISCLAIMER: Investing/ Trading involves significant financial risk and is not suitable for everyone. No communication from us should be considered as financial or trading advice. All information provided by it and Run Candlesticks Inc, its affiliates or representatives is intended for educational purposes only. You are advised to test any new approach before implementing it. Past performance does not guarantee future results. Terms of Service
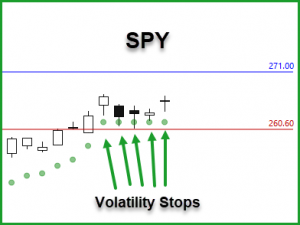
Big week of earnings this week, double check your positions and new buys, do you want to hold them through earnings? The past few weeks have been very good to most traders, and last week was no exception. Last week the SPY was in chart pattern creation with Monday’s pop and the next four days creating a PBO, continuation pattern. If you follow the Volatility stop, you can see five dot support line. Last week also remained above the T-Line and the 50-SMA. Above $260.60 January 23rd low we will remain bullish looking for the buyers to challenge the $271.00 area. When reading a chart, I find it is helpful to look at Price Action, Support, and Resistance, The T-Line and the Red/Green Trend/Line. The price action of the CBOE Market Volatility Index (VIX) closed Friday below the T-Line and the Red/Green trend line. Friday’s close did not produce any bullish buyers of the VIX. However, the VIX is testing the 200-SMA once again so we may see some a relief rally this week.
The following tickers are setting up on our trade list: OSTK, WDC, CC, GRUB, AEO, YELP, SLB, CPRI. Past performance does not guarantee future results. Learn how to trade before you trade.
Hit and Run Candlesticks AnnualMembership Save 50% Use promo code: SAVE50 and save $892.50.
Hit and Run Candlesticks Monthly, Quarterly, SemiAnnual Membership Save 30% Use promo code: SAVE30 and save.
Private 2-hour coaching with Rick Saddler only $354.00 for non-members and $300.00 for members. Learn More
The “Road to Wealth Coaching” – Work with Rick Saddler daily and learn how he plans to double his trading account this year 2019. Learn More
DISCLAIMER: Investing/ Trading involves significant financial risk and is not suitable for everyone. No communication from us should be considered as financial or trading advice. All information provided by it and Run Candlesticks Inc, its affiliates or representatives is intended for educational purposes only. You are advised to test any new approach before implementing it. Past performance does not guarantee future results. Terms of Service
A close over the T-Line today would be the 15th-day price action has to lead the T-Line into bullish battle. Price has tightened up the last three days, the Doji yesterday is the smallest of the 3 and yesterdays low was higher then Wednesdays candle. The past three candles have also had slide into last weeks support area. This week the sellers have tried to push the buyers into a hole but have failed thus far, the buyers have hung on tight to the road traveled from the December lows. A strong bull will be wanting $266.50 followed by $270.50 a strong bear will want $258.60 followed by $255.65. The VIX-X price action has failed to close above the 50-SMA after a minor challenge. But the bottom building is possible and real.
Friday is a good day to collect a fw of those profits and take a few loss if needed. It’s kinda scary holding too much over the weekend with all the political BS and the unknown. Good trading to all and have a great weekend.
Discounts and Coupons
Hit and Run Candlesticks is has a 30% savings on memberships – use the SAVE30 promo code and save 30% on and Hit and Run Candlesticks membership. Learn More SAVE30
Private 2-hour coaching with Rick Saddler only $354.00 for non-members and $300.00 for members. Learn More
The “Road to Wealth Coaching” – Work with Rick Saddler daily and learn how he plans to double his trading account this year 2019. Learn More
Real-Time Market Scanner
The LTA Live Real-Time Scanner is built for both the professional and the retail home trader. The live real-time scanner offers a cutting edge advantage to the serious trading looking to profit from the stock market. Scan Definitions- Download FREE
DISCLAIMER: Investing/ Trading involves significant financial risk and is not suitable for everyone. No communication from us should be considered as financial or trading advice. All information provided by it and Run Candlesticks Inc, its affiliates or representatives is intended for educational purposes only. You are advised to test any new approach before implementing it. Past performance does not guarantee future results. Terms of Service
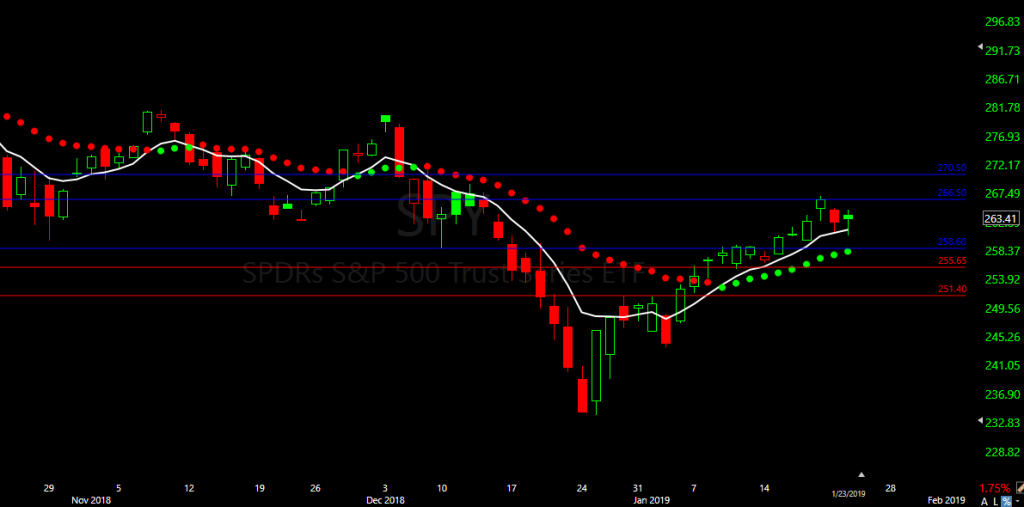
Buyers are holding off the sellers in this bullish pullback. The SPY printed another lower low yesterday, and then the buyers stepped over the sellers closing well above the low. The price action of the SPY is flirting with-testing the 50-SMA and the $258.60 support area, what I would call a bullish pullback. Here is why I think the bullish pullback is good for the overall market, let’s look at the past five candles. The past five candles are drawing what could be a bullish continuation pattern, of course, it is based on the buyers holding support. If the bullish continuation pattern pans out the next target area would be about $270.50. And if the sellers walk all over the buyers $255.65 and $251.40 will be in the cards.
Notice how price action is trending above the T-Line and the Red/Green Dottrend in the chart below, we will remain cautiously bullish until we see a compelling bearish candlestick pattern with follow-through the breaks the bullish trend.
For more information about the Red/Green Trend line, Dotted Deuce or anything about our charts, consider joining us in the HRC trading room. We start at 9:10 Am each trading day. 60-Day Trial
Stock picks or trade ideas without swing trading education will cost you your hard earned money. HRC Watch-list Trade-Ideas – We are adding the following to our trade-list: LGIH, SEDG, EXTR, DF, CLVS, FSK, LLY, TWTR. Invest in your future with Hit and Run Candlesticks education Past performance does not guarantee future.
Real-Time Market Scanner
Built-In (Included) Scan Definitions. Bullish and bearish, Continuation, moving average crossovers and bounces. (RBB) Rounded Bottom Breakout alerts, intra-day, daily and weekly, Candlesticks stick signals and more. Scan Definitions- Download FREE
DISCLAIMER: Investing/ Trading involves significant financial risk and is not suitable for everyone. No communication from us should be considered as financial or trading advice. All information provided by it and Run Candlesticks Inc, its affiliates or representatives is intended for educational purposes only. You are advised to test any new approach before implementing it. Past performance does not guarantee future results. Terms of Service