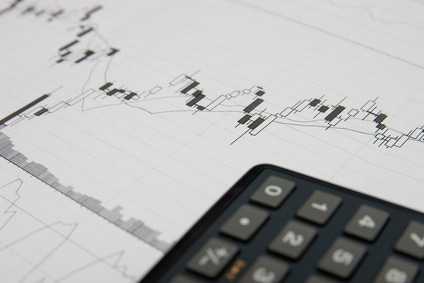
Picture a candlestick: the solid body of the candle, the thin wick above, the shadow below, and (of course) the lovely and fragrant ambiance it creates. From this image, swing traders have created a technique known as Japanese candlesticks.

As you might have guessed, this charting method originated in Japan. The body (also called “the real body”) of the metaphorical candle represents the open and close range, and the body is either filled black (for a close under the open) or left hollow and white (for a close over the open). The thin lines protruding from the top and bottom of the body are known as shadows (or sometimes, “wicks” and “tails”). The top shadow represents the session high and the bottom shadow represents the session low.
Many swing traders find candlestick trading signals and charts easier to read and understand when compared with traditional bar charts. They allow the trader to understand the open/close relationship as well as the high/low relationship all at once. You can also interpret the buying/selling pressure based on the length of the body: short (little price movement, consolidation) or long (intense pressure).
Reading a chart filled with these enlightening candles, traders are able to make smart trading decisions by identifying and reacting to candlestick trading signals.
Candlestick Trading Signals
Trend Reversals: A trend reversal does not mean that the prices will reverse (as you might be inclined to think). Instead, it indicates that the prior trend should change. The prices may reverse as well, but the trend’s direction is the important thing here. A trend reversal pattern is considered successful if the trend changes after the pattern appeared, whether the trend changes from upward to downward, downward to sideways, sideways to upward, etc.
Turning Points: Turning points are the times at which resolute changes occur in a situation or chart. A turning point can show up in a number of different patterns, including the Engulfing pattern, the Hammer, the Hanging Man, the Harami, the Piercing Line, the Dark Cloud Cover, the Inverted Hammer, and the Shooting Star, amongst others. These patterns are made up of multiple candlesticks with specific qualities and positioning (long shadows, long wicks, etc). Doji can also be used to find important turning points. These little symbols, which look like plus signs or crosses, gain relevance when they appear in certain positions, such as beside long candles. If you are able to locate and confirm turning points like these, you can get an accurate forecast of the market.
If you want to be successful in your use of candlestick trading signals, it is important that you find confirmation of patterns or signals. Instead of pinpointing one candle and thinking it can help you achieve a winning decision, look at all of the pieces of the chart to ensure that your ideas are sound.
Consider the candlestick trading signals above as well as the T-Line, other moving averages, volumes, and chart patterns. Look at earnings dates and the overall market condition as well. Your insight, patience, and vigilance will help you make smart trading decisions.


