The SPY printed a Hammer yesterday after a gap down finding the 200-SMA as we have been talking about the past week, on fairly strong volume yesterday. The T2122New High/Low Ratio chart from TC2000 is at a low 4.35. The weekly chart is sitting on the 50-period moving average while the monthly chart is printing a Bearish Engulf, there no doubt the sellers are holding the cards, the buyers are just not giving up very easy. Bullish follow-through above yesterdays Hammer (above $278.90) should produce a small relief rally to maybe to the $280.60 area. Many reading this knows how much I like the RBB chart setup, and the VXX is, in fact, one of these setups. Price is now above the 50-SMA and looks to be determined to challenge the 200-SMA. The VXX has challenged the 200-SMA a couple of time the last few months, and if the VXX can stay below the 200-SMA, the markets should be safe from disaster but not choppy trading. If the VXX finds a path above the 200-SMA, the market could be in a little trouble. Good trading my friends.
A Traders Edge In All Markets
The LTA Scanner can filter out charts that are trending, up ordown and alert on charts that have Candlestick signals and patterns, western patterns and when indicators, such as MACD, Stochastics, RSI or Bollinger Bands have crossed or reaches the desired level. Hey, check out the NEW BULL PERFECT TREND ALERT. The right tools for the job.
5/30/2019 Acton Plan
Consider the trend of the SPY, DIA’s IWM, and the QQQ’s when trading, it is easier to make money trading with the trend.
85% of all stocks follow the trend of the SP-500
Don’t try to time the exact turn or trend change of chart
Manage current trades looking for base hits.
Welcome small losses
Trade smaller, less capital in a position
Fewer positions
Trade strong, stable charts, not one-day wonders
Trade with the trend of the chart
A trading plan for each trade.
Worlds #1 Live Alert Scanner
Trades Ideas
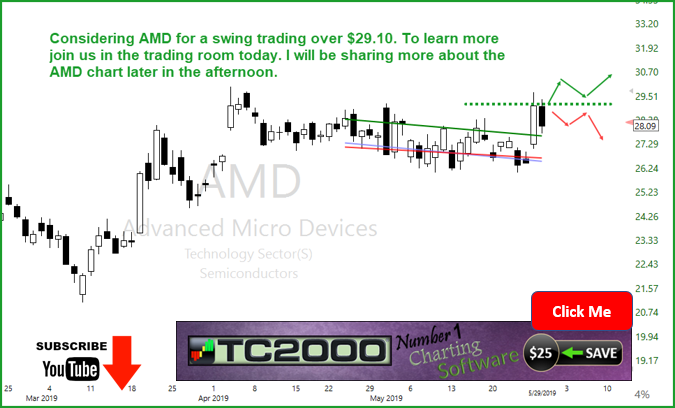
AMD has broken above the T-Bands suggesting bullishness, I am considering a trade above $29.10 and only on an acceptable entry pattern. To learn more join us in the trading room, we will discuss AMD and more Trade-Ideas as well.
HRC Monthly service only $110 with this promo code: SAVE50
We use 2 of The Worlds Best Trading Tools, TC2000 for charting, LTA-Live Trading Alerts for real-time price action, candle and candle patterns, and western patterns. The right tools for the right job.👍
DISCLAIMER: Investing / Trading involves significant financial risk and is not suitable for everyone. No communication from Hit and Run Candlesticks Inc, its affiliates or representatives is not financial or trading advice. All information provided by Hit and Run Candlesticks Inc, its affiliates and representatives are intended for educational purposes only. You are advised to test any new trading approach before implementing it. Past performance does not guarantee future results. Terms of Service
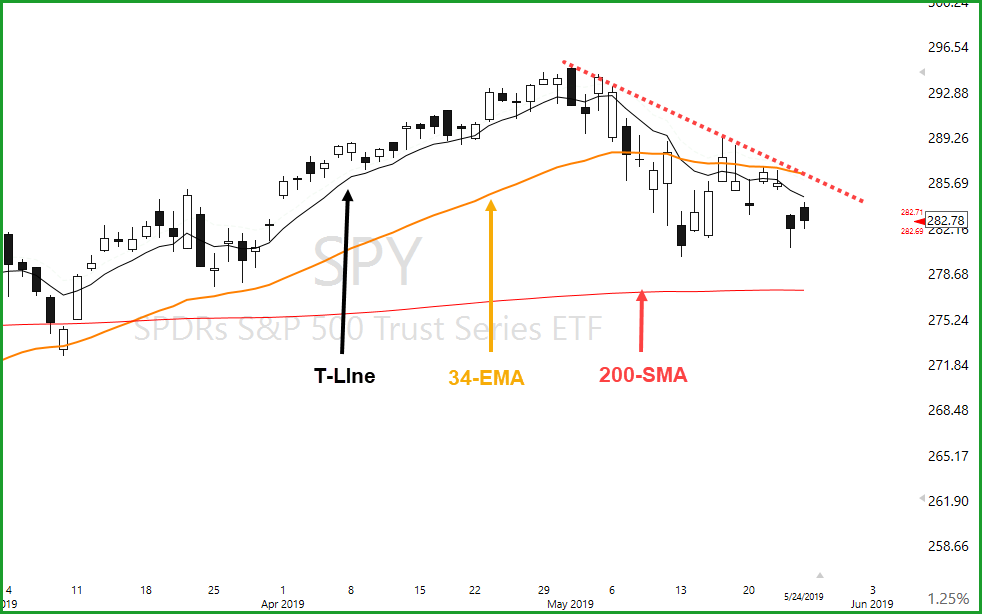
“The Trend is your friend” The key is to work with a trend that compliments your trading style. When the trend and your trading style come together as one, your engine will run smoother. Years ago, I discovered the power of the 34-EMA and the T-Line (8-EMA) when putting on the same chart. If the T-Line is below the 34-EMA, the trend is bearish. While watching for signs of a bullish reversal. This strategy using the T-Line and the 34-EMA can be used on indices, stocks, or ETF’s such as the SPY, DIA, IWM, VXX, AAPL, FDX, KO, and INTC to name a few. The SPY closed Friday’s candle and the T-Line below the 34-EMA suggesting the current trend is still negative, and the sellers have control. The trend is currently pointing at the 200-SMA with a possible bullish relief rally along the way.
Worlds #1 Live Alert Scanner
The LTA Scanner can filter out charts that are trending, up or down and alert on charts that have Candlestick signals and patterns, western patterns and when indicators, such as MACD, Stochastics, RSI or Bollinger Bands have crossed or reaches the desired level. The right tools for the job.
5/28/2019 Acton Plan
Stay
focused on trend long of short for a trade
85%
of all stocks follow the trend of the SP-500
Manage
current trades looking for base hits.
Welcome
small losses
Trade
smaller, less capital in a position
Fewer
positions
Trade
strong, stable charts, not one-day wonders
Trade
with the trend of the chart
A
trading plan for each trade.
Trades Ideas
Trade-Ideas will be sent out today using the APP throughout the APP. See App download buttons below.
HRC Monthly service only $110 with this promo code: SAVE50
We use 2 of The Worlds Best Trading Tools, TC2000 for charting, LTA-Live Trading Alerts for real-time price action, candle and candle patterns, and western patterns. The right tools for the right job.👍
DISCLAIMER: Investing / Trading involves significant financial risk and is not suitable for everyone. No communication from Hit and Run Candlesticks Inc, its affiliates or representatives is not financial or trading advice. All information provided by Hit and Run Candlesticks Inc, its affiliates and representatives are intended for educational purposes only. You are advised to test any new trading approach before implementing it. Past performance does not guarantee future results. Terms of Service
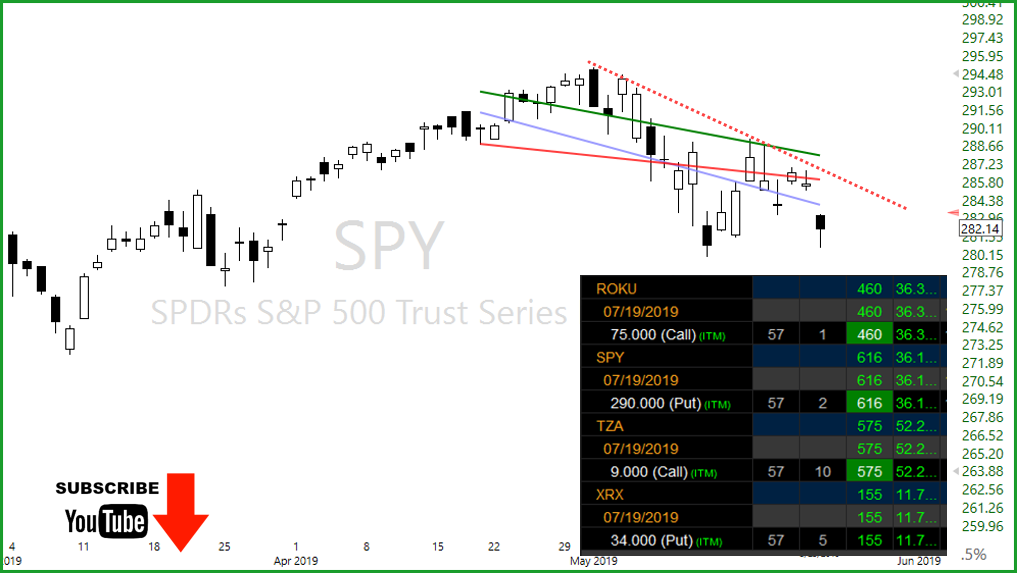
#1 Alert scanning tool in the world was the key to profiting 35% in ROKU, 34% in SPY Puts, and 51% in TZA yesterday. It’s Friday the start of a 3-day weekend Honoring the men and women who died while serving in the U.S military.
Worlds #1 Live Alert Scanner
Yesterday the trading gods gapped us down out of and below the T-Line Bands to a $280.57 in the SPY before closing a bit higher at $282.14. The morning futures are pointing to a higher open. As of yesterday the recent low of May 13, is safe but will it last? The current trend is still weak, with price below the Bands and a bearish trend line above. The T-Line is below the 34-EMA, and the 17-EMA has breached the 34-EMA as well. The T2122 chart dropped to 10.6 yesterday triggering an oversold condition, and a relief rally is warranted. The VXX chart produced a Bull Kicker yesterday from a higher low pull back closing in the now bull trending bands, keep your eyes on the VXX chart, it can be very telling.
5/24/2019 Acton Plan
Ease
up on trades over the long weekend
Continue
to build a watchlist for the weeks ahead using the LTA Scanner.
Clean
up the Harley for a ride this weekend
Study
charts in the HRC trading room
HRC Monthly service only $110 with this promo code: SAVE50
Trade Ideas-No trades Ideas On Fridays
I hope everyone has had a profitable week, if so please let us know. If not we are here to help but we have to hear from you. Reach out to us we are here for you.
We use 2 of The Worlds Best Trading Tools, TC2000 for charting, LTA-Live Trading Alerts for real-time price action, candle and candle patterns, and western patterns. The right tools for the right job.👍
DISCLAIMER: Investing / Trading involves significant financial risk and is not suitable for everyone. No communication from Hit and Run Candlesticks Inc, its affiliates or representatives is not financial or trading advice. All information provided by Hit and Run Candlesticks Inc, its affiliates and representatives are intended for educational purposes only. You are advised to test any new trading approach before implementing it. Past performance does not guarantee future results. Terms of Service
Live Trading Alerts Scanner update v1.17.422 is available; We are still holding ROKU, SPY puts, TZA, XRX puts, GE, and PEP they were all brought to us via the LTA Scanner like a waiter brings a cold beer and Steak. The right tools for the right job.
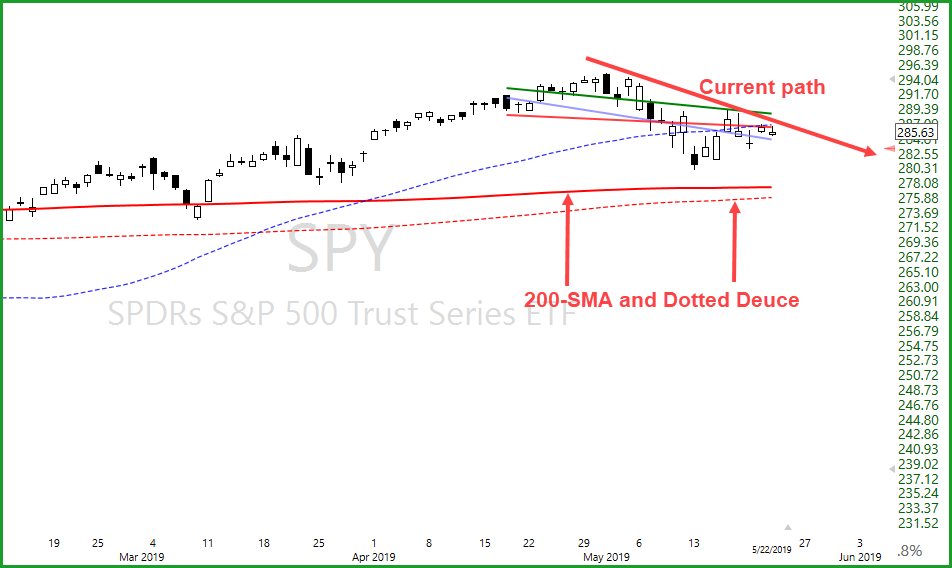
It looks to me that the SPY still has a date with our pair of deuces $277.40 – $277.8. The Bears are defending the Blue Ice failure pattern pretty well; the T-Line Bands are being driven by a bear with price action below the red and green line. The T-Line is below the Volatility Dots, and yesterdays candle action closed below the T-Line. The T2122 chart (4wk New High/Low Ratio) has dropped to about 26, and it’s moving average is being pushed down as well. I have heard from many traders they are having trouble, so am I, remember to for trades that are working in your favor and the goes for the overall market, have you looked at IYT, IWM lately.
5/23/2019 Acton Plan
Manage the trades I am in
Don’t trade the first 30-min of the market, unless it is for a chart I already own
Trade smaller, less capital in a position
Fewer positions
Longer lunch (LOL)
Trade strong, stable charts, not one-day wonders
Trade with the trend of the chart
Trade for base hits
Stops, always have a stop plan
Ise the Scanner with built-in rules to find short and long trades
Trade Ideas
We are adding the following trade ideas to our watch-list. Be sure to check earnings dates. SE, ERY, DUG, SHOP, KO, PEP, GIS, LRCX, W, XRX Trend, Protective Stops, Base hits.
HRC Monthly service only $110 with this promo code: SAVE50
We use 2 of The Worlds Best Trading Tools, TC2000 for charting, LTA-Live Trading Alerts for real-time price action, candle and candle patterns, and western patterns. The right tools for the right job.👍
DISCLAIMER: Investing / Trading involves significant financial risk and is not suitable for everyone. No communication from Hit and Run Candlesticks Inc, its affiliates or representatives is not financial or trading advice. All information provided by Hit and Run Candlesticks Inc, its affiliates and representatives are intended for educational purposes only. You are advised to test any new trading approach before implementing it. Past performance does not guarantee future results. Terms of Service
We bought Roku a few days ago after the LTA scanner popped an alert yesterday we are up 21.1% What would you expect from the #1 Live Alert scanning tool in the World. I would be more than happy to teach how I use the LTA Stanner. Watch for a 4-hour clinic, coming soon.
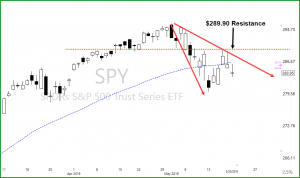
The SPY closed
a bit higher than the day before but not over the 50-SMA and the $290.98 line
we talked about yesterday. Price action has not pushed through the T-Line Bands,
and the V-Stop Dots are red. The VXX still does not show much fear on the daily
chart other then it is set up with a low high and higher low all it needs is a
reason, the conditions are in place. The player, SPY, DIA, QQQ, IWM, SMA, IYT already
have 50-pounds of moving averages on top of them.
Acton Plan, Trade Toughts To Today
Manage
the trades I am in
Don’t
trade the first 30-min of the market, unless it is for a chart I already own
Trade
smaller, less capital in a position
Fewer
positions
Longer
lunch (LOL)
Trade
strong, stable charts, not one-day wonders
Trade
with the trend of the chart
Play
with base hits
Stops,
always have a stop plan
HRC Monthly service only $110 with this promo code: SAVE50
Trade Ideas
We are adding the following trade ideas to our watch-list. Be sure to check earnings dates. FAS, ERX, AMJ, XHB, PAYX, NWL, CNC, HES, Trend, Protective Stops, Base hits.
We use 2 of The Worlds Best Trading Tools, TC2000 for charting, LTA-Live Trading Alerts for real-time price action, candle and candle patterns, and western patterns. The right tools for the right job.👍
DISCLAIMER: Investing / Trading involves significant financial risk and is not suitable for everyone. No communication from Hit and Run Candlesticks Inc, its affiliates or representatives is not financial or trading advice. All information provided by Hit and Run Candlesticks Inc, its affiliates and representatives are intended for educational purposes only. You are advised to test any new trading approach before implementing it. Past performance does not guarantee future results. Terms of Service
Special 50% discount – Availability Limited to 10 traders
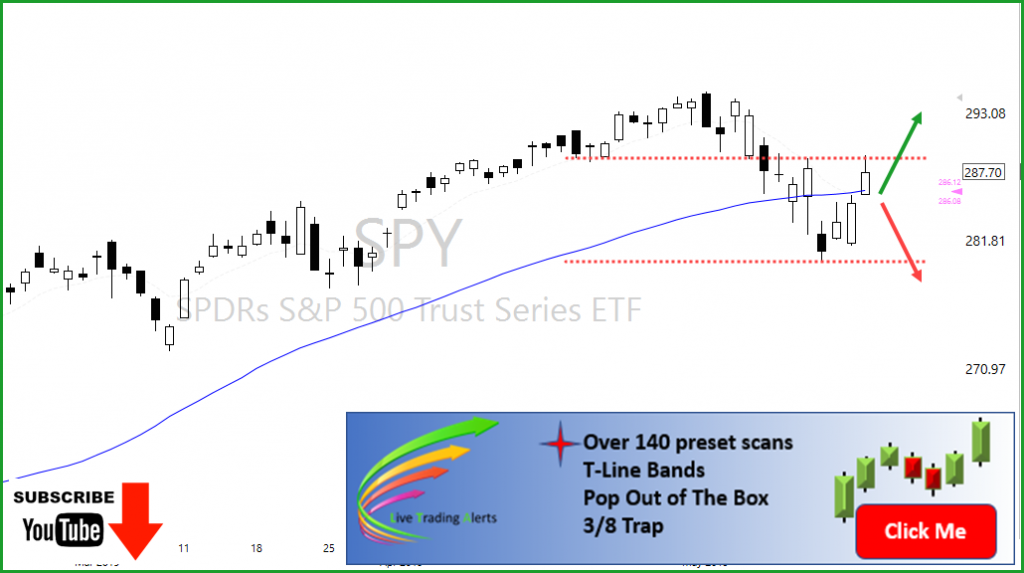
Futures are up this morning as this blog is being written. Looking at the SPY (weekly chart) it is clear to see price on a support and the 23.6 Fib line. (Not too surprised of a bounce and a test of the 50-SMA) The daily chart has the 200-SMA 2.3% below yesterdays close, and the daily Blue Ica failure is still in the game. Bullish price action would have to close above $289.20 for the buyers to be in control. In my humble opinion, anything less than $289.20 would keep the current downtrend intact. The T2122 chart is now in an oversold area; buyers are starting to peck around, but will they be able to give us a solid close in the next day or so over $289.20? Remember base hits and protective stops. Set a plan 2:1 minimum and when long buy near support and when shorting buy near resistance. The market of late has been challenging for even the best of traders, ask them what their tricks are to survive.
Trade Ideas
We are adding the following trade ideas to our watch-list. Be sure to check earnings dates. COST, SYF, PEP, BX, AXP, LMT, MA, MET. Trend, Protective Stops, Base hits.
We use 2 of The Worlds Best Trading Tools, TC2000 for charting, LTA-Live Trading Alerts for real-time price action, candle and candle patterns, and western patterns. The right tools for the right job.👍
DISCLAIMER: Investing / Trading involves significant financial risk and is not suitable for everyone. No communication from Hit and Run Candlesticks Inc, its affiliates or representatives is not financial or trading advice. All information provided by Hit and Run Candlesticks Inc, its affiliates and representatives are intended for educational purposes only. You are advised to test any new trading approach before implementing it. Past performance does not guarantee future results. Terms of Service
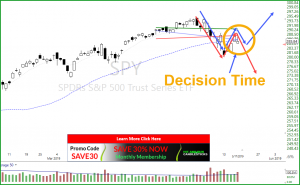
It looks has been performing a balancing act around the 50-SMA for the past nine days, all below its recent high. A close above $290.50 could set the bulls free to challenge the $294.95 high. Weakness and a failure to claim the 50-SMA for the Bulls could lead into chart patterns such as a “Blue Ice Failure” and a “Bearish H Pattern.” Both of these patterns are on the edge of success and could push price closer to the 200-SMA or about. The T2122 chart (3wk New High/Low Ratio has not turned up from the recent down move. When looking at the VXX on the daily chart, it looks like like it has been through a meat grinder, but the chart pattern is still holding a bullish form. To say this market has been easy to trade the last couple of weeks would be a flat out lie. It’s important to know when duck into a cove, tie up and wait out the storm.
Trade Ideas
We are adding the following trade ideas to our watch-list. PEP, GIS, CMCSA, PLUG, MDB, CELG, ATHM, SQQQ, TZA, SOXS, XRX, VXX, SPXS. We follow the trend, buy near support, profit into strength for solid base hits.
We use 2 of The Worlds Best Trading Tools, TC2000 for charting, LTA-Live Trading Alerts for real-time price action, candle and candle patterns, and western patterns. The right tools for the right job.👍
DISCLAIMER: Investing / Trading involves significant financial risk and is not suitable for everyone. No communication from Hit and Run Candlesticks Inc, its affiliates or representatives is not financial or trading advice. All information provided by Hit and Run Candlesticks Inc, its affiliates and representatives are intended for educational purposes only. You are advised to test any new trading approach before implementing it. Past performance does not guarantee future results. Terms of Service
Earlier this week price had closed below the 50-SMA and yesterday (Thursday) the Bulls found a path to close over the 50-SMA. This by no means suggests the bulls are back. A test of the or near the 50-SMA is required and bullish follow-through from there. Below $279.95 the seller will throw a party, and above %289.23 the buyers will dance in the streets. IWM is having a little trouble at the 50-SMA, a bear flag and a Blue Ice Failure at the moment, for this reason, we shorted IWM yesterday looking for a few hundred $$$ in profits. The VXX chart is another reason we took advantage of IWM. On the 15- minute chart the VXX was forming a bottom (“W”) looking like it want to attack its 50-SMA. Pre-market this plan is working, we will see if the open is the same. Yesterday we closed out PEP and PG for nice double-digit profits, could have not done it without our trading tools.
Trade Ideas
Sorry, we do not post trade ideas on Fridays. Friday is the day we clean up our positions. And enjoy being a Trader of the market. We follow the trend, buy near support, profit into strength for solid base hits.
We use 2 of The Worlds Best Trading Tools, TC2000 for charting, LTA-Live Trading Alerts for real-time price action, candle and candle patterns, and western patterns.
👍 A good tool improves the way you work. A great tool 👉 improves the way you think. – Jejj Duntemann
DISCLAIMER: Investing / Trading involves significant financial risk and is not suitable for everyone. No communication from Hit and Run Candlesticks Inc, its affiliates or representatives is not financial or trading advice. All information provided by Hit and Run Candlesticks Inc, its affiliates and representatives are intended for educational purposes only. You are advised to test any new trading approach before implementing it. Past performance does not guarantee future results. Terms of Service
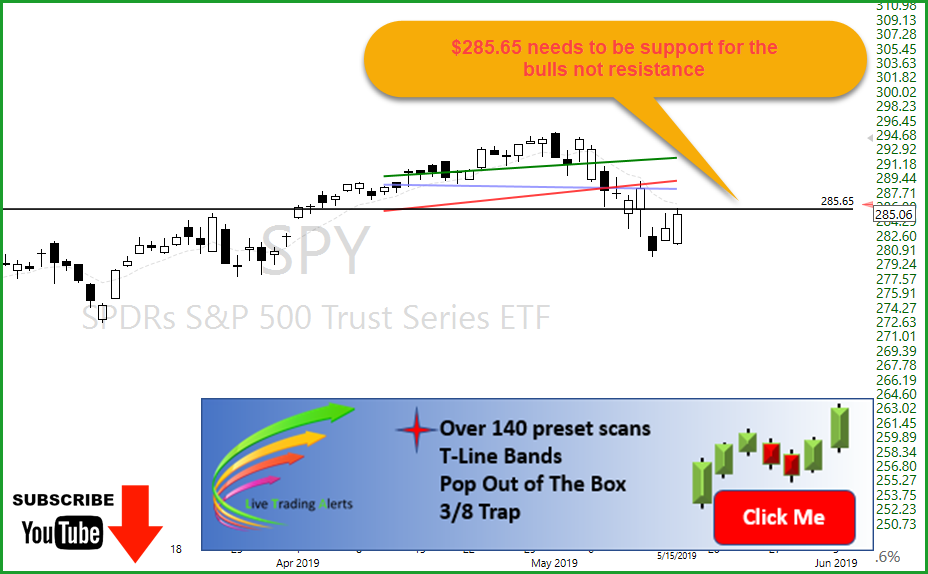
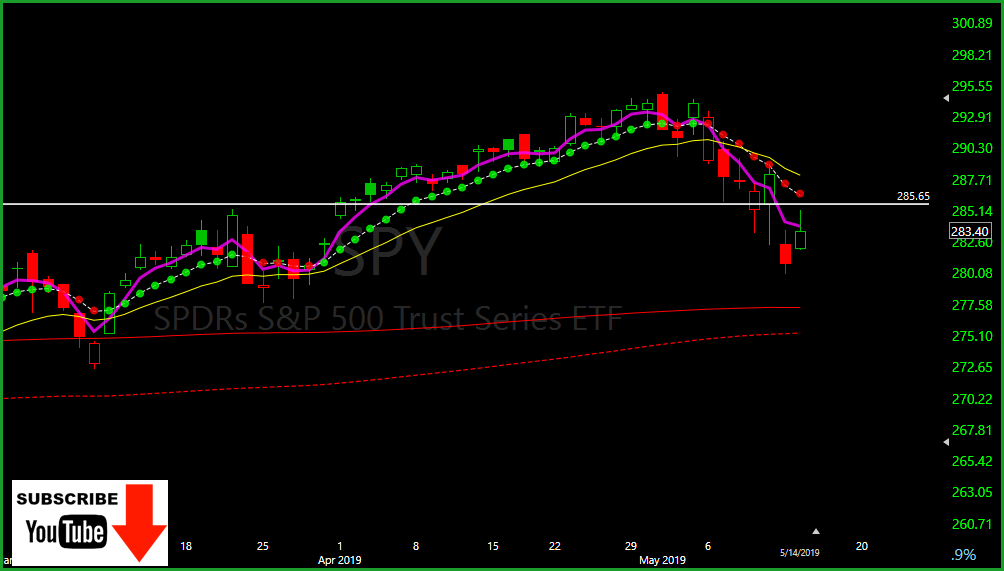
Yesterday’s candle rolled about 1.56% or about $4.40, that’s what happens when you’re afraid to fall, unfortunately, sometimes it can’t be helped. As we had said yesterday if the SPY can not turn $285.65 into support price will be forced to sleep with the 200-SMA for a day or two. Yesterday’s candle was impressive, but now we need follow-through and a test of the $285.65 area for support. For the 50-SMA followers price closed yesterday below the 50-SMA and the fast moving average has not closed back over the T-Line, meaning the buyers need more time or there are not enough buyers willing to push. Pre-Market is suggesting the buyers are in town. Hopefully, they will stay. Support above $265.85 would also suggest the recent May highs could get challenged. Keep your eye on the VXX; price is still in a bullish formation, and support is near.
In my opinion, the LTA- Live Scanner and TC2000 offer the best of the best. TC2000 charts are clear, easy to use, and read. The LTA- Live Alert Scanner pops up trade ideas that fit my style based on how I have set the program up right on my desktop. Day Traders and Swing Trader needs an edge to succeed.
🍰 Today we are adding 10 stocks to our watch list for a possible trade in the next few days. ZNGA, RCII, SE, AMD, BX, MDLZ, AIG, ZS, PG, MSFT, PEP, NOW, The alert software we at Hit and Run Candlesticks and Right Way Options is available to you. Try it for a month
🎯 The Worlds Best Trading Tools ✅ TC2000 for charting, ✅ LTA-Live Trading Alerts for real-time price action, candle and candle patterns, and western patterns. ✅ TradeHawk for placing the trades. Crazy enough, not one of them are expensive.
👍 A good tool improves the way you work. A great tool 👉 improves the way you think. – Jejj Duntemann
DISCLAIMER: Investing / Trading involves significant financial risk and is not suitable for everyone. No communication from Hit and Run Candlesticks Inc, its affiliates or representatives is not financial or trading advice. All information provided by Hit and Run Candlesticks Inc, its affiliates and representatives are intended for educational purposes only. You are advised to test any new trading approach before implementing it. Past performance does not guarantee future results. Terms of Service
Something as simple as a trend can be a traders edge. Based on or 3-Line Dark chart the sellers are winning the game, at least as of yesterdays close. If the buyers can close above $285.65 and establish support, they have a chance to climb higher. Ultimately the trend needs to make a big turn, 👉Fast-EMA needs to be above the T-Line, and the T-Line need to be above the slow-EMA. If the sellers maintain control, we are looking at both our 200 moving average lines for a price test. Looking at the weekly chart, the SPY is at a little support but is also looking at three lower lows, and the monthly chart is supporting a Bearish Engulf. The VXX has challenged the 200-SMA in the (RBB) Rounded Bottom Breakout pattern, currently bullishly consolidating. May is turning out to be a fight between the buyers and sellers; this is where traders need the very best tools 👉for trading and have their wits about them.
In my opinion, the LTA- Live Scanner and TC2000 offer the best of the best. TC2000 charts are clear, easy to use, and read. The LTA- Live Alert Scanner pops up trade ideas that fit my style based on how I have set the program up right on my desktop. Day Traders and Swing Trader needs an edge to succeed.
🍰 Today we are adding 10 stocks to our watch list for a possible trade in the next few days. SPXS, QID, FAZ, VXX, TZA, SYY, COTY, GIS, CL, NEE. The alert software we at Hit and Run Candlesticks and Right Way Options is available to you. Try it for a month
🎯 The Worlds Best Trading Tools ✅ TC2000 for charting, ✅ LTA-Live Trading Alerts for real-time price action, candle and candle patterns, and western patterns. ✅ TradeHawk for placing the trades. Crazy enough, not one of them are expensive.
👍 A good tool improves the way you work. A great tool 👉 improves the way you think. – Jejj Duntemann
DISCLAIMER: Investing / Trading involves significant financial risk and is not suitable for everyone. No communication from Hit and Run Candlesticks Inc, its affiliates or representatives is not financial or trading advice. All information provided by Hit and Run Candlesticks Inc, its affiliates and representatives are intended for educational purposes only. You are advised to test any new trading approach before implementing it. Past performance does not guarantee future results. Terms of Service