SMAR up 11%
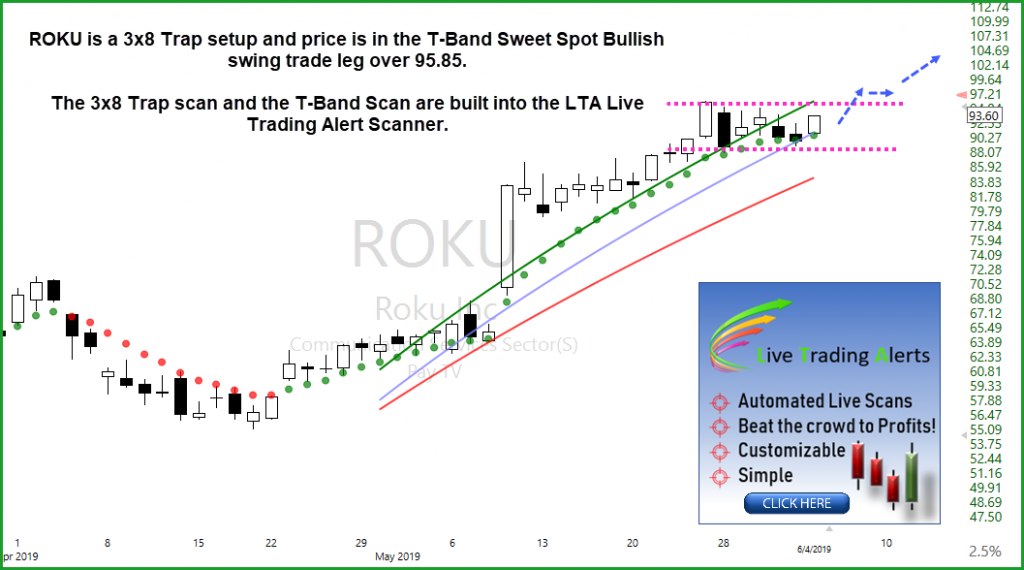
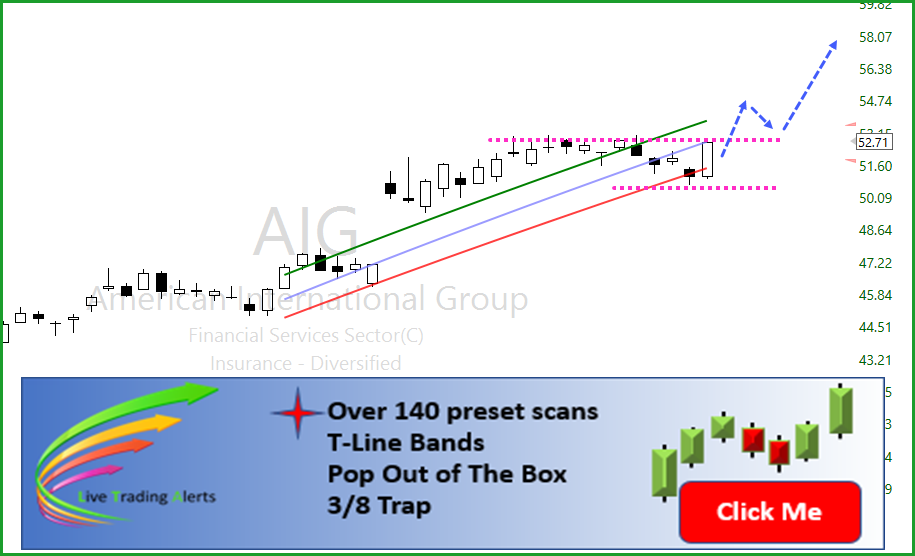
💲 On June 11th we posted SMAR here in the blog, at the close yesterday it was up 11%. Friday held ROKU back followed by a Harami yesterday, time will tell. AIG has yet to find buyers to break it out, keep stops on. GE has broken out of a wedge, and the last few days has pulled back and tested. Yesterday we picked up a little CMCSA, nice breakout of the T-Line Bands. All buys and closes announced in HRC Live Trading Room, be sure to tune in starting at 9:10 Eastern when I’ll review the markets, trade ideas.
Pre-Market Thoughts

Geezs yesterday was boring, and I don’t expect much more from today, it seems traders and investors are waiting on the FED decision Wednesday. On the SPY between $291.10 and $287.70 is just noise, above the $291.10 the bulls have a chance to challenge the May high. Below $287.70 we could see a test of $282.20, which is the 50% retracement. The VXX chart still suggests no fear and has traded below the T-Line for the past 10-days. Above $28.30 would produce a little fear and volatility in the market.
- ✅ Be patient. Know what you want and be patient
- ✅ Always plane your trade out
- Use our base hit strategy, sell into strength
- Buy close to your stop and support
- USE the LTA Trade Alert Scanner to find the winners
Trade Idea With Chart
🎯 LULU breaking out; LULU found support in late May and took about 13 days to work itself back to challenge the top. Yesterday LULU broke out and held well at the close. Above $178.00, we are bullish and will wait for a qualified entry pattern and price action.
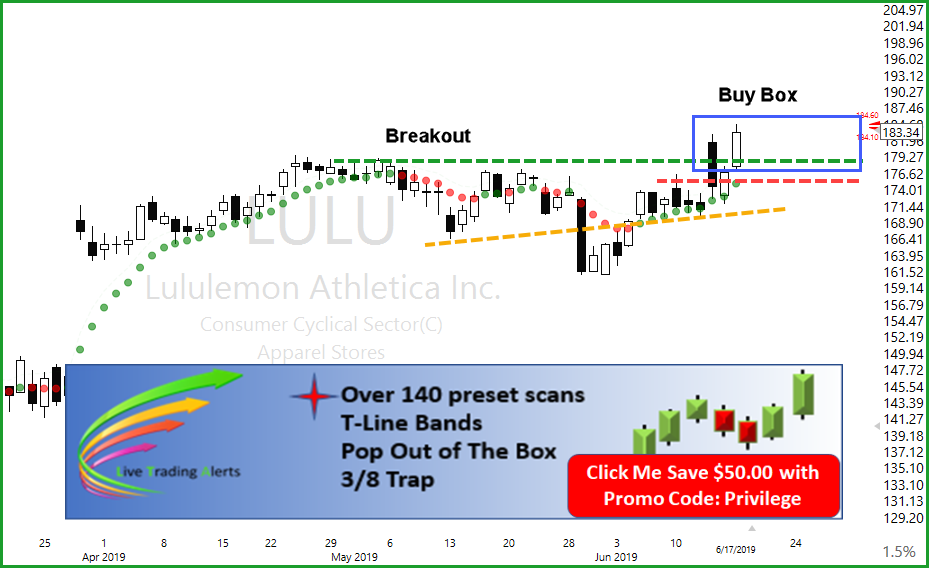
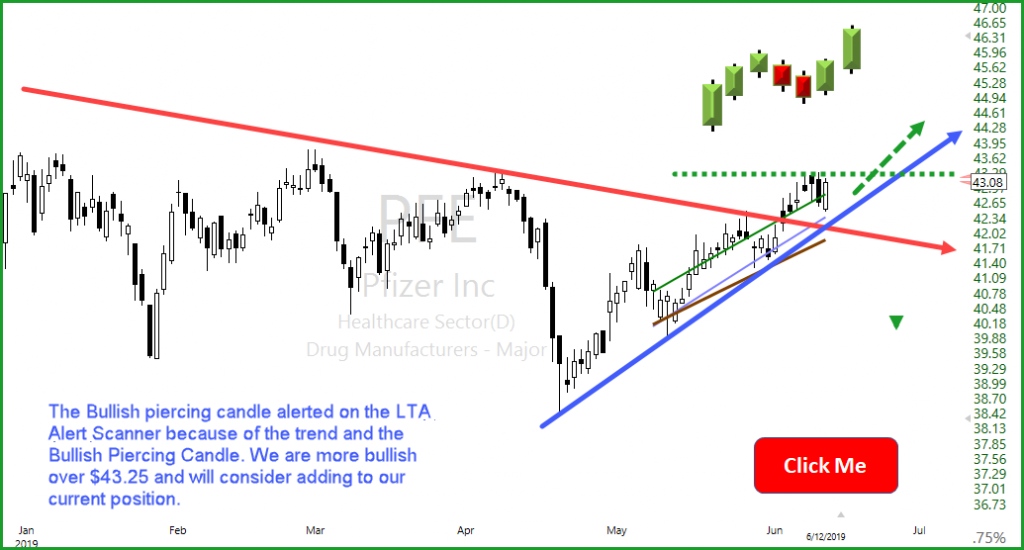
🍰 The LTA Alert Scanner and TC2000 are my tools of choice because they work!. Rick and the HRC Members kick off the trading room starting at 9:10 Eastern when we review the markets, trade ideas, and PFE.
✅✅ Other charts we plan to cover in the trading room, 9:10 am Central: ACHN, LULU, SBGI, ARWR, BABA, CMCSA
✅ A Traders Edge In All Markets
The LTA Scanner can filter out charts that are trending, up or down and alert on charts that have Candlestick signals and patterns, western patterns and when indicators, such as MACD, Stochastics, RSI or Bollinger Bands have crossed or reaches the desired level. 😎 One of my favorites is the T-Line Band Scan. The right tools for the job.
We use The Worlds Best Trading Tools, TC2000 for charting, LTA-Live Trading Alerts for real-time price action, candle and candle patterns, and western patterns. The right tools for the right job.👍


Free YouTube Education • Subscription Plans • Private 2-Hour Coaching
DISCLAIMER: Investing / Trading involves significant financial risk and is not suitable for everyone. No communication from Hit and Run Candlesticks Inc, its affiliates or representatives is not financial or trading advice. All information provided by Hit and Run Candlesticks Inc, its affiliates and representatives are intended for educational purposes only. You are advised to test any new trading approach before implementing it. Past performance does not guarantee future results. Terms of Service