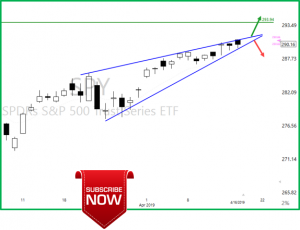
Another higher low for the SPY, the high had trouble, but the low was higher. Yesterday (Tuesday) was the 12th day above the T-Line Band. The SPY chart does look like it’s determined to challenge the $293.934 September high. Seriously the wall of worry is starting to get to traders, let’s keep it simple: Stay with the charts that are trending and the trend makes sense. Use trend lines and price action (Candlesticks) to determine if the trade is still in your favor. Become a base hitter by pulling off profits as price moves in your direction.
You can see from the SPY chart (above) the trend channel is narrowing as price moves closer to the SPY all-time high. As price narrows, I will be watching for a decisive break one way or another (Bullish or Bearish). Usually, when price narrows and builds pressure, a move is in the works.
✅ Trade-Ideas for consideration: NBR, WDC, RIOT, STX, UCO, HPQ, TIF, CAT, <AR, XOP, UTX. Let the LTA Scanner do you work for you Tryit for 30-days
Drive it for 30-days, your quality of charts will increase. I never leave home without it.You know your the best when other educations use your work.Rick’s Favorite Charting Software
DISCLAIMER: Investing / Trading involves significant financial risk and is not suitable for everyone. No communication from Hit and Run Candlesticks Inc, its affiliates or representatives is not financial or trading advice. All information provided by Hit and Run Candlesticks Inc, its affiliates and representatives are intended for educational purposes only. You are advised to test any new trading approach before implementing it. Past performance does not guarantee future results. Terms of Service
More companies are set to report today, be sure to check your holdings to be sure your comfortable holding a position through earnings. No real decisive move on the SPY other than the buyers did not give up control. Yesterday was another bullish day above the Green T-Line Band, and I don’t see anything in the pre-market that will change the bullish attitude of price action today. The wall of worry continues to worry some; simply follow the chart. A friend asked me yesterday, “is the market going to crash again?” my answer is the same I say to our readers. “Yes I am sure it will someday, but you can’t predict when or live in fear.” Being a short term swing trader and having a trading plan that includes base hits is a solid plan for most traders. A base hit can be anything from $50.00 to $5000.00 or more. It depends on your portfolio size and the amount of stock you hold. As an example, I currently have five contracts of TGT with a $325.00 profit, would that be a base hit or a home run? Different answer for different traders.
✅ Trade-Ideas for consideration: TGT, COST, < BBY, MELI, ZAYO, PCG, SYMC, DLTR. Let the LTA Scanner do you work for you Tryit for 30-days
DISCLAIMER: Investing / Trading involves significant financial risk and is not suitable for everyone. No communication from Hit and Run Candlesticks Inc, its affiliates or representatives is not financial or trading advice. All information provided by Hit and Run Candlesticks Inc, its affiliates and representatives are intended for educational purposes only. You are advised to test any new trading approach before implementing it. Past performance does not guarantee future results. Terms of Service
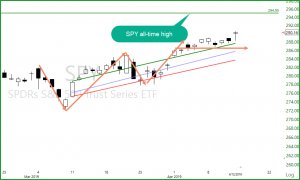
Is the SPY determined to hit $293.94 or what? The buyers seem to be on a mission as you can clearly see in the SPY chart to challenge the SPY all-time high and the sellers seem ok with this as well. Friday ended the day with the 10th day in a row above the T-Line and the T-Line High Line. Friday’s candle does open the door for a possible Hangman but let’s not predict, let’s wait for the candle to form and confirm. The trend is still bullish, and price action still suggests the bulls are in control. The T-Line Bands (on the chart they are the GREEN, BLUE and RED lines) have proved to be a fantastic tool for trend, great trading patterns, and profits. The LTA Live Trading Alert Scanner has this scan built into it, and I love it! If you would like to test drive the LTA Scanner for a month and have me (Rick Saddler) personally work with you to set it up click this link and let’s plan a date. Test LTA Drive Here
✅ Trade-Ideas for consideration: CMCSA, V, CSCO, ZAYO, MDLZ, TGT, ORCL, INFN, ECA, SM, NSC, OLED. Let the LTA Scanner do you work for you Tryit for 30-days
DISCLAIMER: Investing / Trading involves significant financial risk and is not suitable for everyone. No communication from Hit and Run Candlesticks Inc, its affiliates or representatives is not financial or trading advice. All information provided by Hit and Run Candlesticks Inc, its affiliates and representatives are intended for educational purposes only. You are advised to test any new trading approach before implementing it. Past performance does not guarantee future results. Terms of Service
DISCLAIMER: Investing / Trading involves significant financial risk and is not suitable for everyone. No communication from Hit and Run Candlesticks Inc, its affiliates or representatives is not financial or trading advice. All information provided by Hit and Run Candlesticks Inc, its affiliates and representatives are intended for educational purposes only. You are advised to test any new trading approach before implementing it. Past performance does not guarantee future results. Terms of Service
Another week has gone by and the bulls remain the winner. The SPY price is has been skipping along the T-Line for the past 10 bars and above the Green T-Band for the past 9 bars. The wall of worry is in place. We monitor the SPY chart for signs of damage and every time you think you see it, the bulls hop in to fix it. Currently, we are about 2% from the SPY all-time high, come on bulls get it done! There is no loss of bullish charts, the scanner continues to produce. What a winning combination to have a greak stock scanner and the education to trade for profits, you gota love your job!
Today at 11:00 AM Eastern I will be in room #3 showing how I set up my favorite scans. I hope you can join us. Link to Room #3
✅ Trade-Ideas for consideration: ATVI, V, SC, NVTA, VLO, CY. Let the LTA Scanner do you work for you Tryit for 30-days
DISCLAIMER: Investing / Trading involves significant financial risk and is not suitable for everyone. No communication from Hit and Run Candlesticks Inc, its affiliates or representatives is not financial or trading advice. All information provided by Hit and Run Candlesticks Inc, its affiliates and representatives are intended for educational purposes only. You are advised to test any new trading approach before implementing it. Past performance does not guarantee future results. Terms of Service
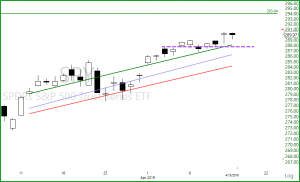
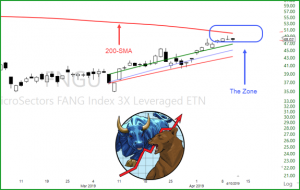
A chart I have up and on one of my monitors at all times is the FANG chart (Ticker FNGU) or FANG Index 3x Leveraged ETN FANGS stocks are (FB) (AMZN) (AAPL) (NFLX) and (GOOG). The FNGU chart has been instrumental in determining trend direction and pullbacks in the overall market. As you can see from the chart, it is approaching the 200-SMA. The 200-SMA is a moving average know for its support and resistance. More time than not I have experienced price action consolidation when price enters into the 200-SMA zone. While the market is still trending bullish, we will continue to trade bullish to the long side while monitoring how price action acts on the (FNGU) chart in the 200-SMA zone.
Live Trading Alerts Clinic: Today, Thursday, April 11, 2019, Ed Carter will be covering 26 new scans and answering any questions you might have. The LTA- Live Trading Alerts Scanner has proven it’s self has the leader in auto scanning for candlesticks signal, chart patterns, breakouts, and break downs. Click Here and Choose Room#4
✅ Trade-Ideas for consideration: ATVI, V, SC, NVTA, VLO, CY. Let the LTA Scanner do you work for you Tryit for 30-days
DISCLAIMER: Investing / Trading involves significant financial risk and is not suitable for everyone. No communication from Hit and Run Candlesticks Inc, its affiliates or representatives is not financial or trading advice. All information provided by Hit and Run Candlesticks Inc, its affiliates and representatives are intended for educational purposes only. You are advised to test any new trading approach before implementing it. Past performance does not guarantee future results. Terms of Service
Not much change in the market, the bulls continue to ride the T-Line train to bull town. Price gapped down yesterday and closed with a Doji on the T-Line. The bull-bear T-Line (Reg/Green T-Line) held with a green trend on the gap down so we will remain cautiously bullish as the buyers climb the wall of worry. Earnings kick off this week and could be the catalyst that pushes price action up to and over the $300.00 mark on the SPY. A little caution: The VIX chart pushed a little yesterday closing over the T-Line turning the trend green. The VIX is a huge clue in the fear or lack of fear in the market. Trade well, Trade smart my friends.
Today’s Action plan: Manage current positions, taking off a few profits when presented. Yesterday we took profits on FDX and will consider a reentry of the chart presents itself. The LTA Scanner is already turned on, and we’re both ready for a great day.
✅ Trade-Ideas for consideration: CMCSA, HES, OLED, EW, ORCL, AABA, ZAYO, MDLZ. Let the LTA Scanner do you work for you Tryit for 30-days
DISCLAIMER: Investing / Trading involves significant financial risk and is not suitable for everyone. No communication from Hit and Run Candlesticks Inc, its affiliates or representatives is not financial or trading advice. All information provided by Hit and Run Candlesticks Inc, its affiliates and representatives are intended for educational purposes only. You are advised to test any new trading approach before implementing it. Past performance does not guarantee future results. Terms of Service
Earnings
kick off this week, make sure you double check your dates before buying a stock!
The SPY posted another bullish day yesterday. Have you ever noticed how price runs
on top of the T-Line and even push higher, then come back to the T-Line and
even float below the T-Line for a few days? Yesterday marked the 6th-day
price has run above the T-Line. I use the VIX is flexing its muscles this
morning, keep a close eye the VIX is a valuable tool when it comes to how deep you’re
invested. Above $13.85 on the VIX we will likely lean into a few shorts or
puts. The T-2122 chart is on our radar up above 80.
Today’s Action plan: Yesterday we closed our XOP for a nice profit. Today we will be managing our current trades and possibly taking a sweet 25% base hit on FDX. The LTA Scanner is already turned on, and we’re both ready for a great day.
DISCLAIMER: Investing / Trading involves significant financial risk and is not suitable for everyone. No communication from Hit and Run Candlesticks Inc, its affiliates or representatives is not financial or trading advice. All information provided by Hit and Run Candlesticks Inc, its affiliates and representatives are intended for educational purposes only. You are advised to test any new trading approach before implementing it. Past performance does not guarantee future results. Terms of Service
On the SPY. Monday of last week the bulls popped price over the T-Band high and price continued to post higher lows the rest of the week. As with T-Line rules; when price moves too far and to fast from the T-Line the probabilities increase for a pullback. The overall trend in the SPY remains bullish. The T2122 chart is in the overbought area, but we all know T-2122 and stay overbought while price continues to perform. IYT needs a rest based on its recent performance which means we could see a little softness in the market. SMA still holding strong with no sellers in sight as of Friday. The VIX appears to be constructing a bottom so we will be watching the VIX closely for signs that the construction is ending and the bulls taking over.
Our action plan today and this week will be to keep a close eye on our green longs and pull profits when appropriate. FDX, GIS, VLO, XOP, QCOM. Friday last week in the afternoon the LTA Alert Scanner did a great job of pointing out tradable chart setups, and I have no reason to think anything different this week.
✅ Trade-Ideas for consideration, All Trade Ideas came from the LTA Live Trading Alert Scanner. BLL, PEP, ZAYO, PG, GIS, MSFT, BBY
DISCLAIMER: Investing / Trading involves significant financial risk and is not suitable for everyone. No communication from Hit and Run Candlesticks Inc, its affiliates or representatives is not financial or trading advice. All information provided by Hit and Run Candlesticks Inc, its affiliates and representatives are intended for educational purposes only. You are advised to test any new trading approach before implementing it. Past performance does not guarantee future results. Terms of Service
The Bulls
and Bears could not agree on much yesterday except to hold price a narrow range,
In fact, an
inside day. An inside day is when one day’s
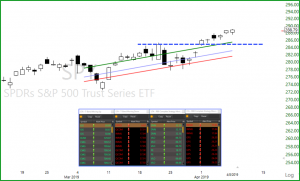
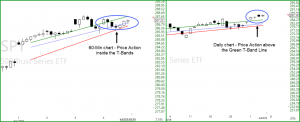
range (lows and highs) are inside the previous days (lows and h1ighs). The one-hour SPY chart shows hoe price pulled back
into the T-Bands, tested the red line and close above the blue line. All that
went on while the price was simply in a
narrow inside day range on the daily chart. Yesterday’s
close still had a bullish tilt with four bars above the green line and no bearish signal. The wall of worry is still climbing
higher. My Friday gameplan is to take a few base hits and then make sure the grille has gas, and the fridge has a few cold beers
in it. It’s time for the first grass mowing this year. We love our job, have a great
weekend everyone!
Friday’s base hit plan. With the help of the LTA Scanner Alerts, this week I was able to enter: NVDA up 34% and TGT up 32%. I plan on a running a few bases today with about $1000.00. Seriouslly do you want to take the next step in improve your trading? 👇
HRC Road To Wealth Mentoring
Mentoring with Rick Saddler: The Road to Trading Wealth can take several different paths; it’s important to find what works for you. The Trend, Price Action, Candlesticks, Chart patterns, Support and Resistance, and Strategies is the map we use to stay on the Road To Trading Wealth. Patterns and Strategies such as The Rounded Bottom breakout, The Continuation Pattern, Trending, T-Line Bands, and the Red Green Strategies are a few of our favorites. Patterns like J-Hooks, Pop Out of The Box, The Oreo, The Fig Newton, Candlesticks are some of our favorite patterns. Read More
Hey, are you looking for the best money making tool in trading? Well, I found it and use it!! The Live Trading Alerts Scanner. I have about four terrific scans. Get it downloaded and I will be glad to work with you privately to get it set up.
✅ Trade-Ideas for consideration, All Trade Ideas came from the LTA Live Trading Alert Scanner. Ya it’s Friday no trade ideas. Do your work, work your plan. Always have a plan. The LTA Scanner is available for members at a discounted price of $97/per mo. Also available for non-members at $147/per mo. The Most Important Tool You Can Have
DISCLAIMER: Investing / Trading involves significant financial risk and is not suitable for everyone. No communication from Hit and Run Candlesticks Inc, its affiliates or representatives is not financial or trading advice. All information provided by Hit and Run Candlesticks Inc, its affiliates and representatives are intended for educational purposes only. You are advised to test any new trading approach before implementing it. Past performance does not guarantee future results. Terms of Service