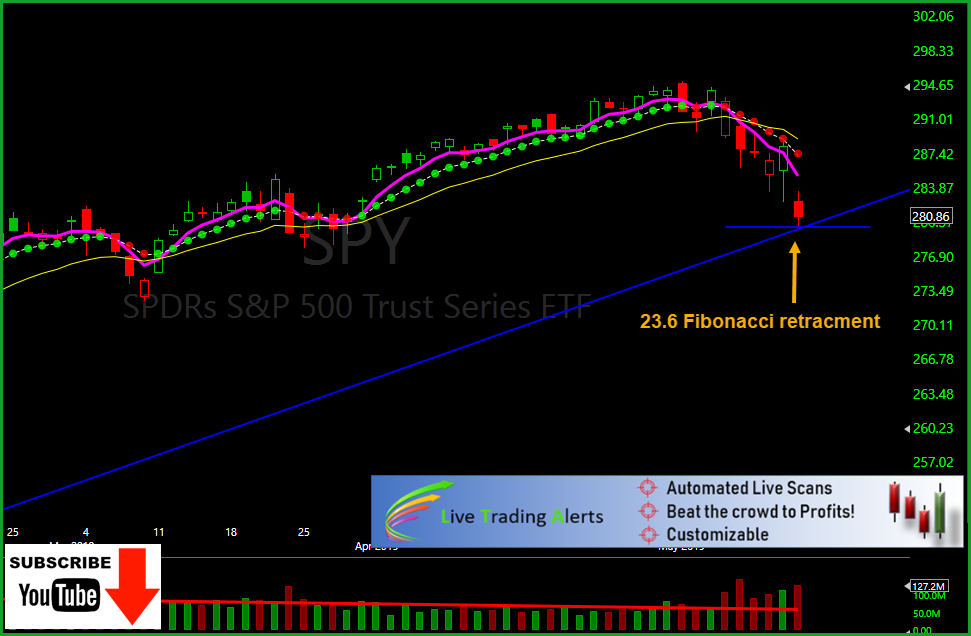
Yesterday’s gap hurt…Ouch! But we should not have been surprised, the current trend has been a sleuth of bears, and they were hangry. The bears have run the lows lower until they broke the 50-SMA and then gaped smack dab on the Fibonacci 23.6 retracement line closing at 280.86. The futures are up a bit this morning, and we are oversold so a relief rally may be in the cards, but a true run for bullishness will need a pattern such as a low/high higher low/ higher high or a bullish 123 step pattern.
Our bar
chart is still strong into a downtrend. The closing price yesterday is about
halfway between the 50-SMA and the 200-SMA, the battle is on, the sellers will
fight for the 200-SMA and buyers will fight for the 50-SMA.
🍰 Today we are adding 10 stocks to our watch list for a possible trade in the next few days. AXSM, GIS, PG, COTY, ZNGA, MELI, SPWR, ROKU, WW, ZAYO. The alert software we at Hit and Run Candlesticks and Right Way Options is available to you. Try it for a month
🎯 The Worlds Best Trading Tools ✅ TC2000 for charting, ✅ LTA-Live Trading Alerts for real-time price action, candle and candle patterns, and western patterns. ✅ TradeHawk for placing the trades. Crazy enough, not one of them are expensive.
👍 A good tool improves the way you work. A great tool 👉 improves the way you think. – Jejj Duntemann
DISCLAIMER: Investing / Trading involves significant financial risk and is not suitable for everyone. No communication from Hit and Run Candlesticks Inc, its affiliates or representatives is not financial or trading advice. All information provided by Hit and Run Candlesticks Inc, its affiliates and representatives are intended for educational purposes only. You are advised to test any new trading approach before implementing it. Past performance does not guarantee future results. Terms of Service
In Friday’s blog post I posted my Candlestick Dark Chart using just three moving averages. The moving averages (3-EMA, 8-EMA and the 17-EMA) shows how the bulls had control and now clearly shows the bears in control. Bullish candlesticks (price action) with these line in bearish formation is thought to be a bottom but requires confirmation. One more time please “Requires Confirmation.” 👉 Friday has not confirmed it was simply the buyers and sellers creating a candle; confirmation would be above about $289.00 based on Friday’s candle. Notice on the above chart the red dot above Friday’s candle, when the dot turns green you most likely will have confirmation. This indicator or strategy can be used on any chart if you are wondering. ✅ The Red/Greem T-Line Dots on TC2000 and the Alerts from The LTA Scanner are a top tool for trading. Just like a fork is the #1 for eating pie.
🎯 I use 3 of the best tools in the world for trading stocks and options. 👉TC2000 for charting, LTA-Live Trading Alerts 👉 for real-time price action, candle and candle patterns, and western patterns. 👉TradeHawk for placing the trades. Crazy enough, not one of them are expensive.
👍 A good tool improves the way you work. A great tool improves the way you think. – Jejj Duntemann
DISCLAIMER: Investing / Trading involves significant financial risk and is not suitable for everyone. No communication from Hit and Run Candlesticks Inc, its affiliates or representatives is not financial or trading advice. All information provided by Hit and Run Candlesticks Inc, its affiliates and representatives are intended for educational purposes only. You are advised to test any new trading approach before implementing it. Past performance does not guarantee future results. Terms of Service
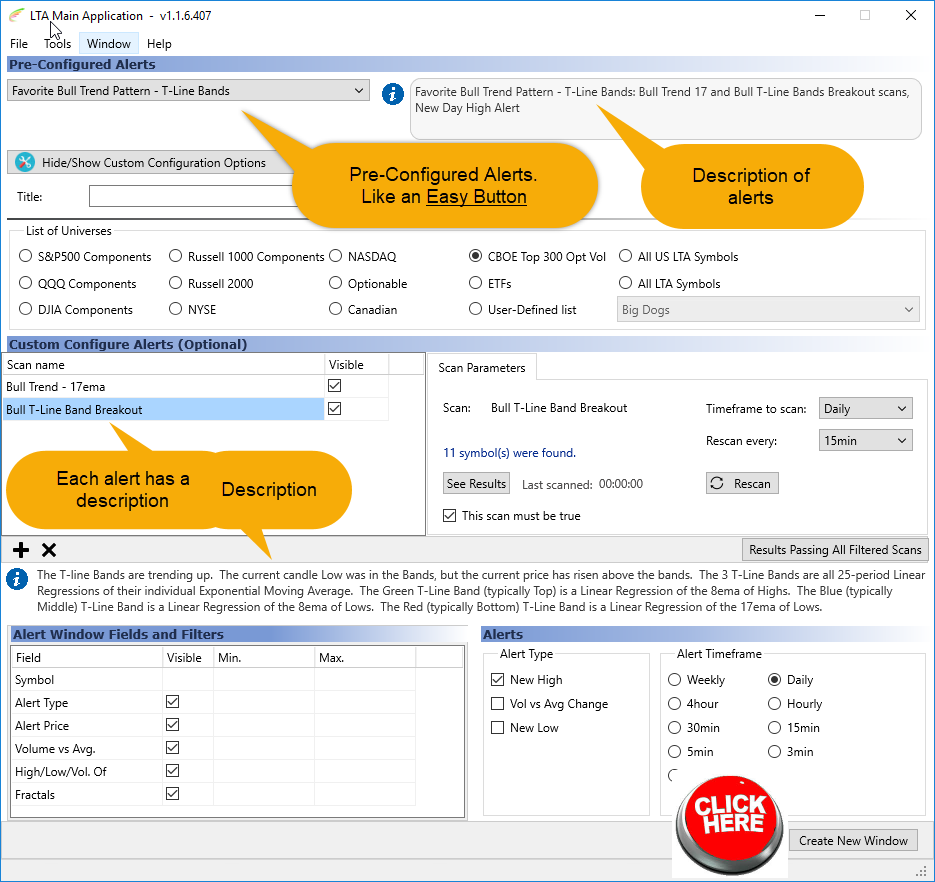
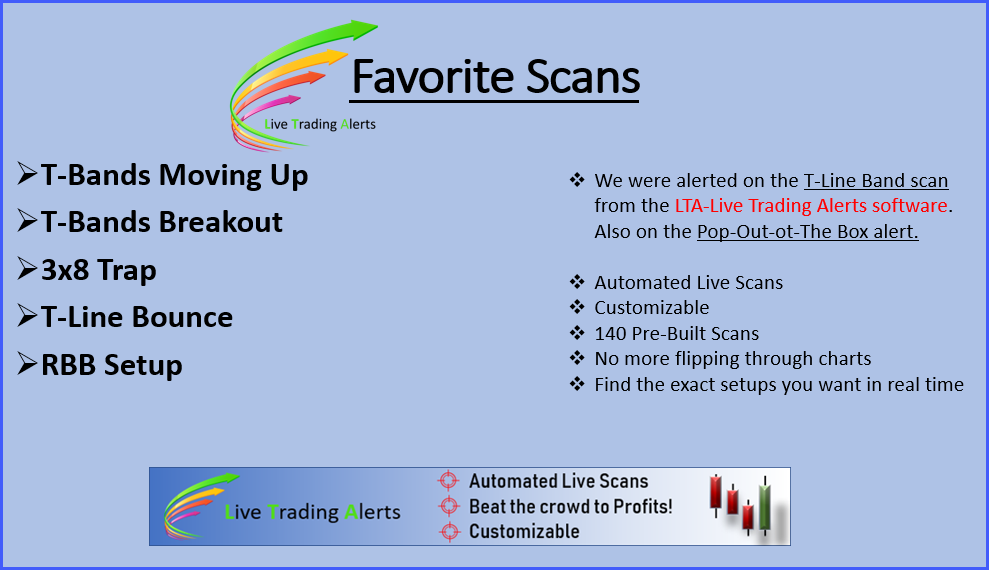
We have made it so easy Just like the Easy Button LTA – Live Trading Alerts has a few new features like “Pre-Configured Alerts.” Live Trading Alerts has solved the problem of finding great chart patterns and setups.
DISCLAIMER: Investing / Trading involves significant financial risk and is not suitable for everyone. No communication from Hit and Run Candlesticks Inc, its affiliates or representatives is not financial or trading advice. All information provided by Hit and Run Candlesticks Inc, its affiliates and representatives are intended for educational purposes only. You are advised to test any new trading approach before implementing it. Past performance does not guarantee future results. Terms of Service
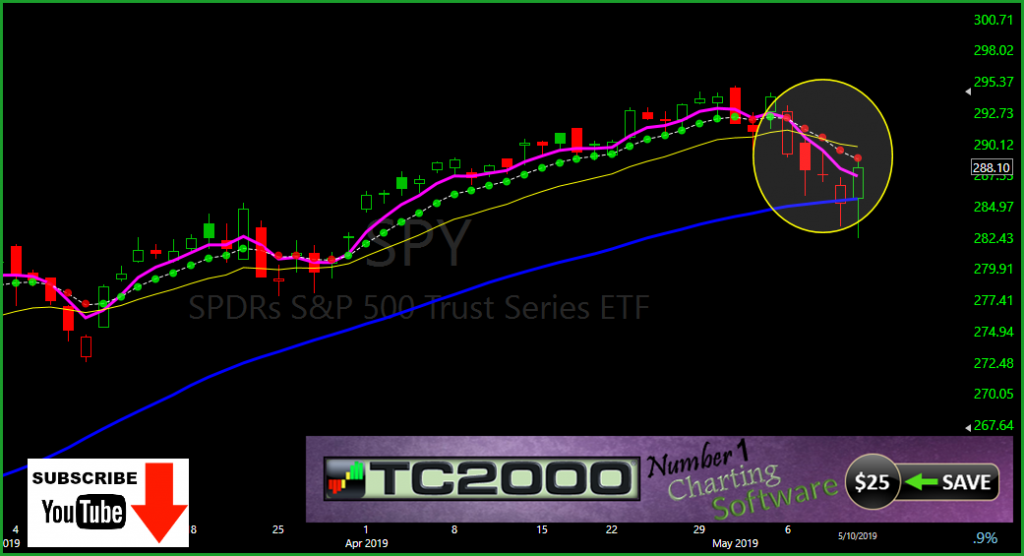
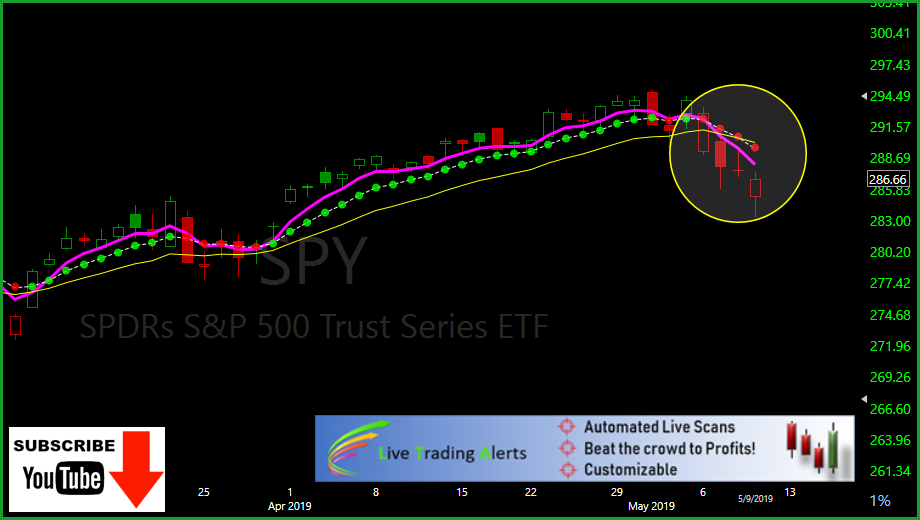
✅ Today let’s look at my dark chart. The dark chart has three trend lines the 3-EMA (Magenta) and the T-Line (8-EMA with Green/Red Dots). As you can see 👀 four candles ago the dots went from green to red and the Magenta line (3-EMA) crossed below the T-Line (Red/Green Dots). Both the 3-EMA and the T-Line have also crossed below the 17-EMA (Yellow), all this with price action leading the way. The last meaningful time this happened was around October 5, 2018, and the SPY corrected about 20%. 👼 The trend is your friend, and this little 3-moving average trick might help you find a good friend. When all three moving averages are in the bear position, we might look for a weak or failing relief rally to short. And when all three moving averages are in the bull position, we might look for minor profit taking PBO’s to go long. Always looking at price action and support.
🎯 I use 3 of the best tools in the world for trading stocks and options. 👉TC2000 for charting, 👉LTA-Live Trading Alerts for real-time price action, candle and candle patterns, and western patterns. 👉TradeHawk for placing the trades. Crazy enough, not one of them are expensive.
👍 A good tool improves the way you work. A great tool improves the way you think. – Jejj Duntemann
You are invited the Hit and Run Candlesticks and Right Way Options Trading Rooms! Click this link: Registration for more details. Register and we will email you the login information. You will be able to come and go as you want for two days. ✅ Hit and Run CandlesticksRoom Times; 8:10 am to market close ✅ Right Way Options Room Times; 11: am Eastern to 1: oo pm Eastern 11:00 am Eastern to 1:00 pm Eastern
You know your the best when other educations use your work.
DISCLAIMER: Investing / Trading involves significant financial risk and is not suitable for everyone. No communication from Hit and Run Candlesticks Inc, its affiliates or representatives is not financial or trading advice. All information provided by Hit and Run Candlesticks Inc, its affiliates and representatives are intended for educational purposes only. You are advised to test any new trading approach before implementing it. Past performance does not guarantee future results. Terms of Service
✅ As expected price broke through the lower T-Band, now headed from the 50-SMA. The Bearish Engulf on 5/1/2019 poked the bear, and now for the past five days, the bear has, well, being a bear. After the Bearish Engulf, we saw follow-through then a failed high, followed by a lower low and yesterday has now made a lower low. Lower lows and lower highs suggest there are more sellers than buyers. The LTA Scanner 👉 has been alerting of the bear poking with the following alerts. (Bearish Engulf), (Bear High Yesterday or Today in T-Bands Now Below) (Bear T-Line Band Breakdown). And the (Bear 3×8 Trap). The VXX has been full of fear the past 3-days, no an RBB setup. The VXX has also alert on the LTA scanner as it broke through the T-Line and T-Line Bands. Todays Challenge will be to monitor today’s candle (price action) using the current trend and yesterdays candle as a backstop.
💲 The LTA Scanner has been alerting of the bear poking with the following alerts. (Bearish Engulf), (Bear High Yesterday or Today in T-Bands Now Below) (Bear T-Line Band Breakdown). And the (Bear 3×8 Trap). The VXX has been full of fear the past 3-days, no an RBB setup. The VXX has also alert on the LTA scanner as it broke through the T-Line and T-Line Bands. Todays Challenge will be to monitor today’s candle (price action) using the current trend and yesterdays candle as a backstop. 👉1-Will the 50-SMA act as support? If not $282.40 a probable test. 👉2-Will the buyers push price back over the T-Line and into the lower band. Or 👉3- Will price start to dry up and walk sideways? These are a few of the clues in the chart we will be watching.
✅ 💰 Here are a few long and short tickers I am adding to a watchlist for consideration only. Trades may or may not be taken. CVS, I, CNC, F, FSLR, RCII, NWL, KEYS, SEE, XLNX, PANW, W, MAS
You are invited the Hit and Run Candlesticks and Right Way Options Trading Rooms! Click this link: Registration for more details. Register and we will email you the login information. You will be able to come and go as you want for two days. ✅ Hit and Run CandlesticksRoom Times; 8:10 am to market close ✅ Right Way Options Room Times; 11: am Eastern to 1: oo pm Eastern 11:00 am Eastern to 1:00 pm Eastern
DISCLAIMER: Investing / Trading involves significant financial risk and is not suitable for everyone. No communication from Hit and Run Candlesticks Inc, its affiliates or representatives is not financial or trading advice. All information provided by Hit and Run Candlesticks Inc, its affiliates and representatives are intended for educational purposes only. You are advised to test any new trading approach before implementing it. Past performance does not guarantee future results. Terms of Service
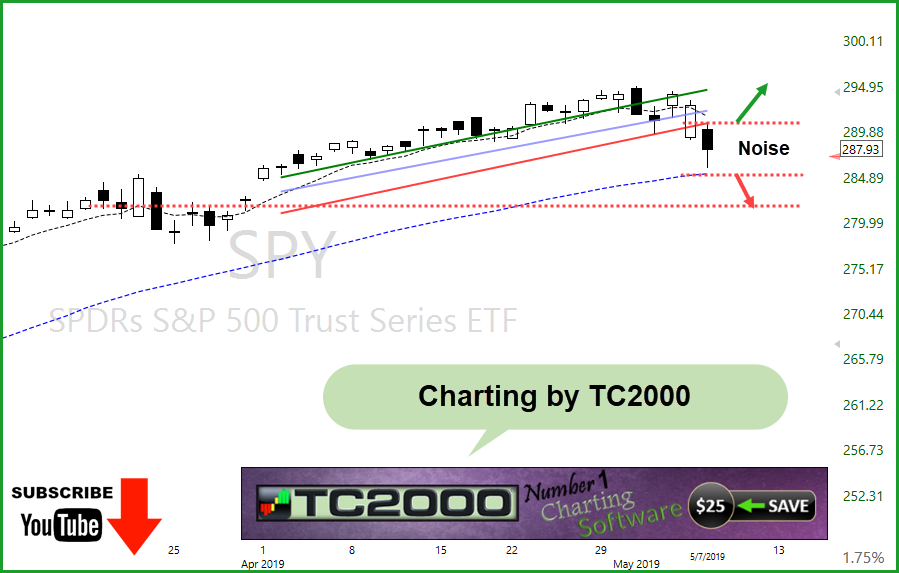
What a nice recovery in the SPY yesterday opened at $289.24 and closed at $292.82, also closed back in the T-Line Bands. Yesterday’s price action tested and bounced off the March 8, trendline. Here are a few of my concerns, May 1 was a Bearish Engulf with follow-through, then a challenge that failed and then there’s yesterday’s new low. So have a high/ low – lower high/ and a lower low. A close below the May 3, trendline and below yesterday’s low could trigger a bit more selling. No doubt yesterday’s candle (price action) was impressive but, it’s the following days that need follow-through that makes us money. THE VXX chart did close over the T-Line Bands and is in trend position to create a bullish pattern. Let’s all exert a little caution!
💰Yesterday we added to our SBUX trade on the pullback and bought ORCL. Both of these trades came from the LTA Alert Scanner Alerts
✅ 💰 Here are eleven tickers I am adding to a watchlist for consideration only. Trades may or may not be taken. VXX, SQQQ, XBI, SPXS, OLLI, ABT, SPXS, MJ, OECL, SBUX, AIG, GS.
You are invited the Hit and Run Candlesticks and Right Way Options Trading Rooms! Click this link: Registration for more details. Register and we will email you the login information. You will be able to come and go as you want for two days. ✅ Hit and Run Candlesticks Room Times; 8:10 am to market close ✅ Right Way Options Room Times; 11: am Eastern to 1: oo pm Eastern 11:00 am Eastern to 1:00 pm Eastern
DISCLAIMER: Investing / Trading involves significant financial risk and is not suitable for everyone. No communication from Hit and Run Candlesticks Inc, its affiliates or representatives is not financial or trading advice. All information provided by Hit and Run Candlesticks Inc, its affiliates and representatives are intended for educational purposes only. You are advised to test any new trading approach before implementing it. Past performance does not guarantee future results. Terms of Service
So that’s
how it feels when the DOW drops 500 points on a Sunday night. Sure glad we use
Fridays as a day to delete a little of our inventory. If a trader has been
following a T-Line strategy, you would have been making money from the first
pullback after the December low. Overall a gap down this morning should not affect
the portfolio that much. Yes, there may be some losses taken today but not to
the extent of the gains the past 4-months. My plan of action today is brewed a
cup of coffee and pick up a box of donuts on the way to work. Manage the
positions I have to take a few profits/losses maybe. But the last thing I am
going to do is buy new positions without the proper chart set up or because of
desperation. Its times like this that your business decisions are the most important
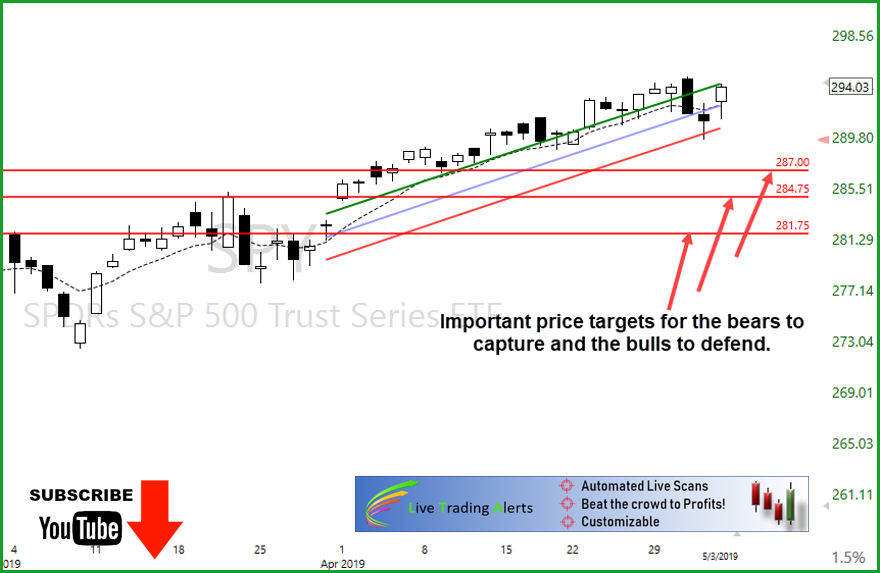
and your trading is your business. $287.00, $284.75, $281.75 will be important price
targets for the bears to capture and the bulls to defend.
✅ Profitable trading takes time and education, and a trader must have the proper tools. Hope to see you in the trading room and our educational workshops.
✅ 💰 Because of the pre-market price action, we will wait for the market to settle and the LTA Scanner alerts for trade ideas.👇
Game Changer: Live Trading Alerts – A tool that saves a trader time, focuses their attention onto the few stocks/ETFs (at any given second of the day) that exhibit EXACTLY the behavior (price pattern, signal and movement) a trader desires. No flipping through charts, no waiting on someone to recommend a chart, no missing trades or uncertainty about when to act…just actionable, real-time alerts of specific trade setups.
You know your the best when other educations use your work.
DISCLAIMER: Investing / Trading involves significant financial risk and is not suitable for everyone. No communication from Hit and Run Candlesticks Inc, its affiliates or representatives is not financial or trading advice. All information provided by Hit and Run Candlesticks Inc, its affiliates and representatives are intended for educational purposes only. You are advised to test any new trading approach before implementing it. Past performance does not guarantee future results. Terms of Service
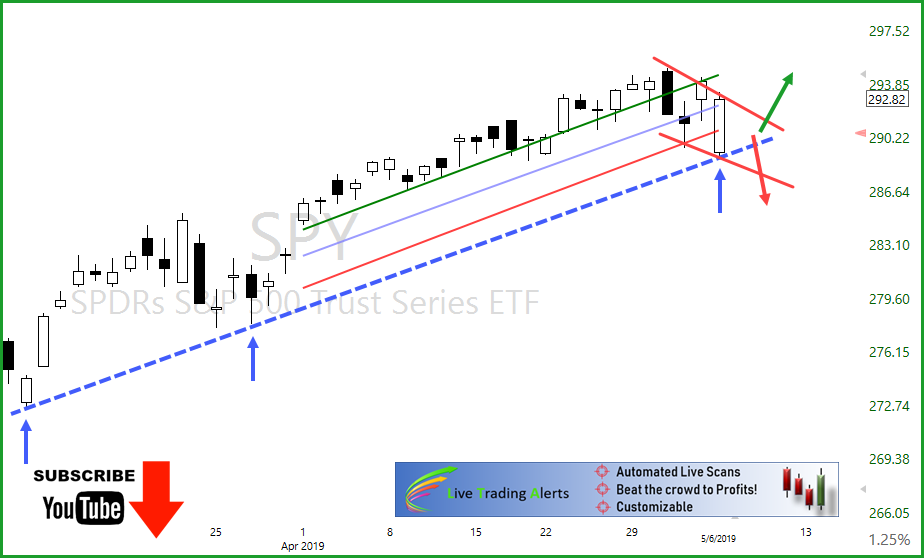
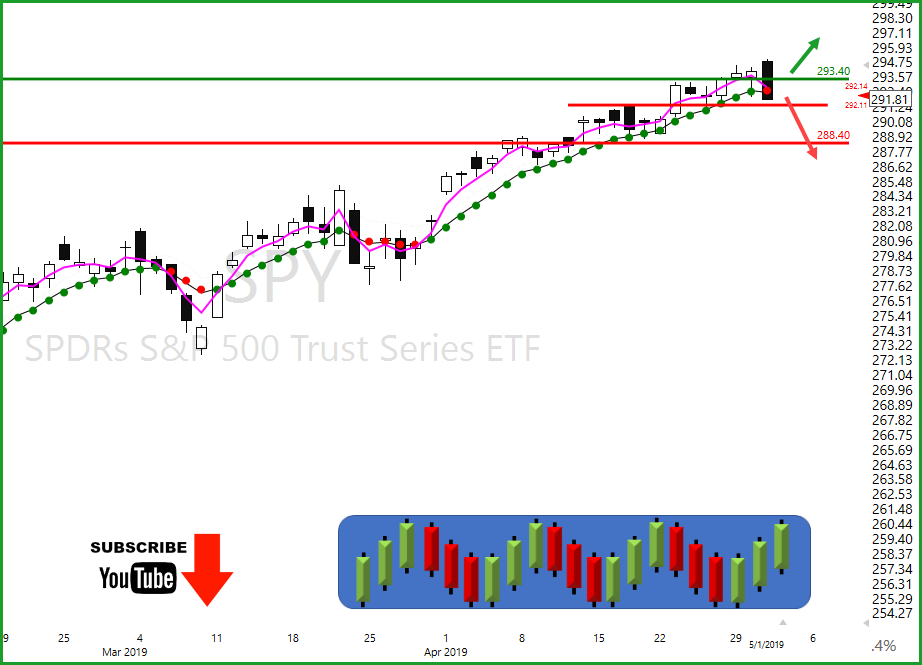
The SPY printed a Bearish Engulf yesterday after making a new high, and the VIX closed over $14.25. I have mentioned in the trading room we should be concerned if the VIX can close over $14.25. Yesterday ended the T-Line Run streak by price closing below the T-Line. If you use the Red/Green alert T-Line you know that is has turned Red, follow through on price will drag the 3-EMA below the T-Line causing a 3×8 trend to start. Price action, trend and support will be very important in the next few days. If we see weakness and follow-through on the bearish engulf I suspect $288.40 could get tested. Of course, the bulls could eat a Snickers Bar and bring us back, a close over $293.40 might bring the die-hard bulls back in the game. Yesterday going into the close we bought IWM puts, Double Top, Evening Star, 2-day Bearish Engulf, Price closing below the T-Line and the 3-SMA following. We also bought VXXB long ending the day with 21%
✅ Profitable trading takes time and education, and a trader must have the proper tools. Hope to see you in the trading room and our educational workshops.
✅ The following are twelve trade ideas I am adding to my watch-list for consideration over the next few days. SDS, TZA, VXXB, QID, DXD, SDS, KEYS, SHOP, ATVI, LABD, SEE, INTU. I will use the LTA Scanner to alert me on these and other setups created.👇
Game Changer: Live Trading Alerts – A tool that saves a trader time, focuses their attention onto the few stocks/ETFs (at any given second of the day) that exhibit EXACTLY the behavior (price pattern, signal and movement) a trader desires. No flipping through charts, no waiting on someone to recommend a chart, no missing trades or uncertainty about when to act…just actionable, real-time alerts of specific trade setups.
You know your the best when other educations use your work.
DISCLAIMER: Investing / Trading involves significant financial risk and is not suitable for everyone. No communication from Hit and Run Candlesticks Inc, its affiliates or representatives is not financial or trading advice. All information provided by Hit and Run Candlesticks Inc, its affiliates and representatives are intended for educational purposes only. You are advised to test any new trading approach before implementing it. Past performance does not guarantee future results. Terms of Service
DISCLAIMER: Investing / Trading involves significant financial risk and is not suitable for everyone. No communication from Hit and Run Candlesticks Inc, its affiliates or representatives is not financial or trading advice. All information provided by Hit and Run Candlesticks Inc, its affiliates and representatives are intended for educational purposes only. You are advised to test any new trading approach before implementing it. Past performance does not guarantee future results. Terms of Service