A Short Week OF Trading
Every weekend, I say to myself, “Susan, you have to stop drinking wine” Thankfully, I’m not Susan.
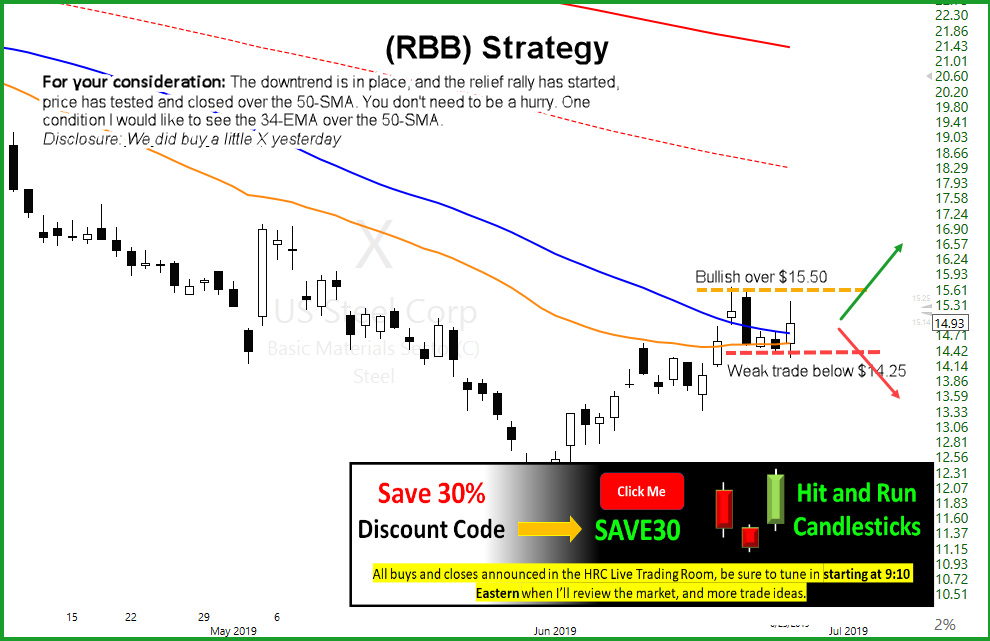
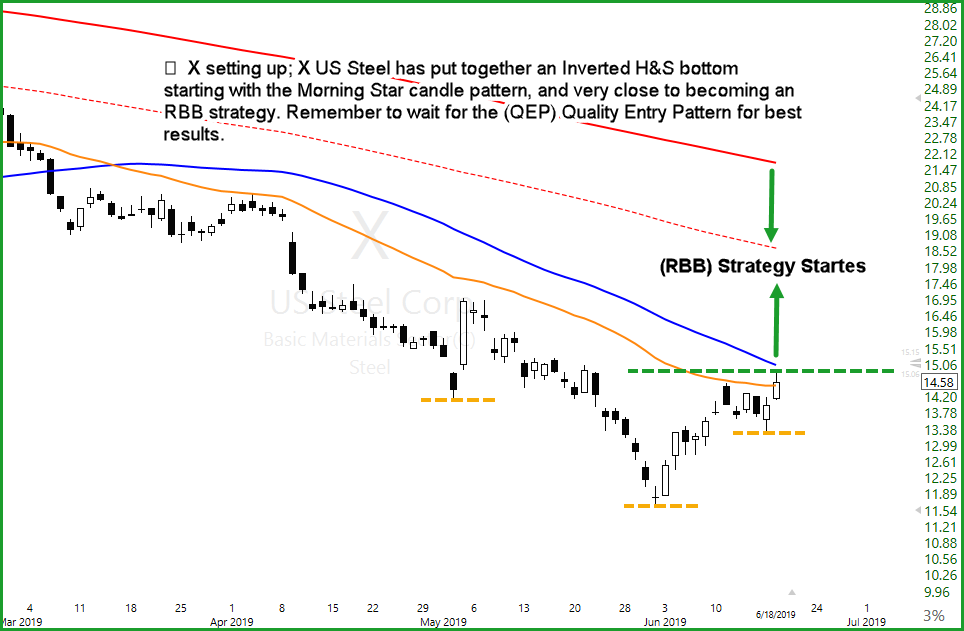
A short week of trading starting with a ½ day on Wednesday. Sure is nice to see the futures up. Here are a few I help over the weekend. DIS is setting up inside the T-Bands. KSS had a good Thursday and Friday with last week constructing a turnaround bottom. QCOM is running above the T-Line with the bulls in charge. X is staring a nice little trend; we love the rest run type of patterns. A few stocks we are actively trading and happy to share them with you.
Have a good trading day – Rick
Pre-Market Thoughts
Guess what’s popping today? Yep yep yep the market. The challenge will be price closing over the June 20 high and holding. But heck we are off to a good July start! Follow the trend and manage wisely; today will likely be a good profit day for many. We love the Gap gift and base hits. A positive close over the June high sets us for another J-Hook continuation pattern. Fail the top and close back below the T-Line will put us in the T-Bands again. The VXX is deep below the T-Line, which gives out a now fear attitude. On a little side note, the SPY’s 34-EMA has crossed over the 50-SMA on the daily chart. And you can clearly see a Bullish Inverse Head and Shoulders on both the Dail and weekly SPY chart.
Have a great weekend
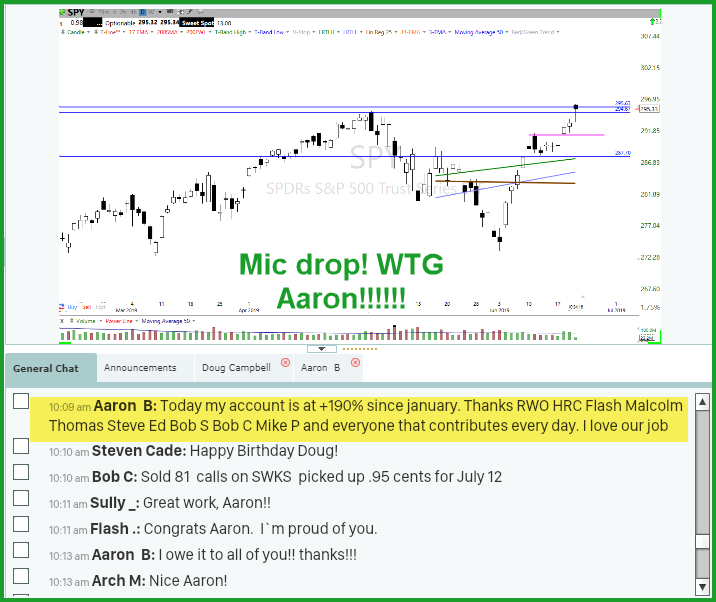
Friday 6/21/19 (10:09 am) Aaron B: Today, my account is at +190% since January. Thanks, RWO HRC Flash Malcolm Thomas Steve Ed Bob S Bob C Mike P and everyone that contributes every day. I love our job.
Trade Ideas
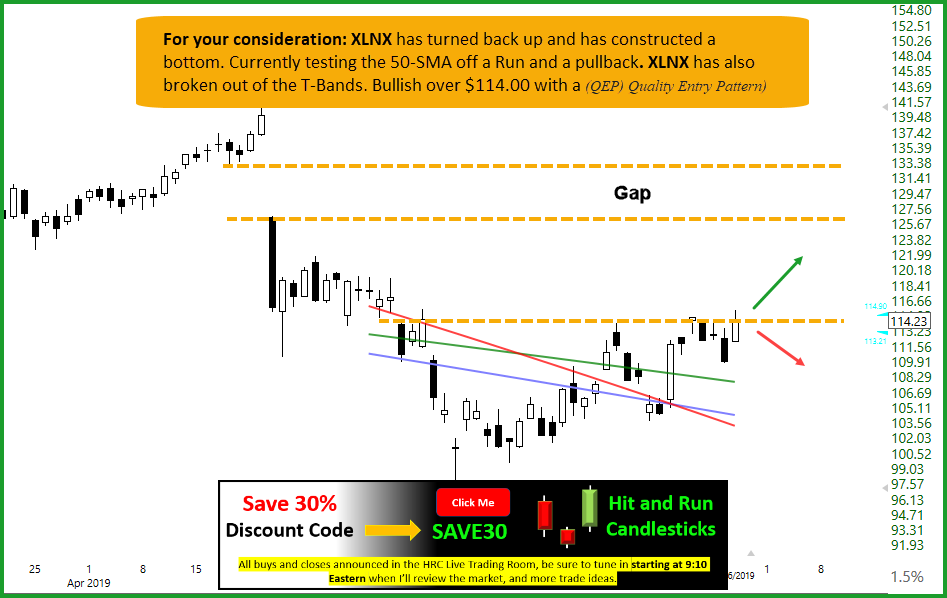
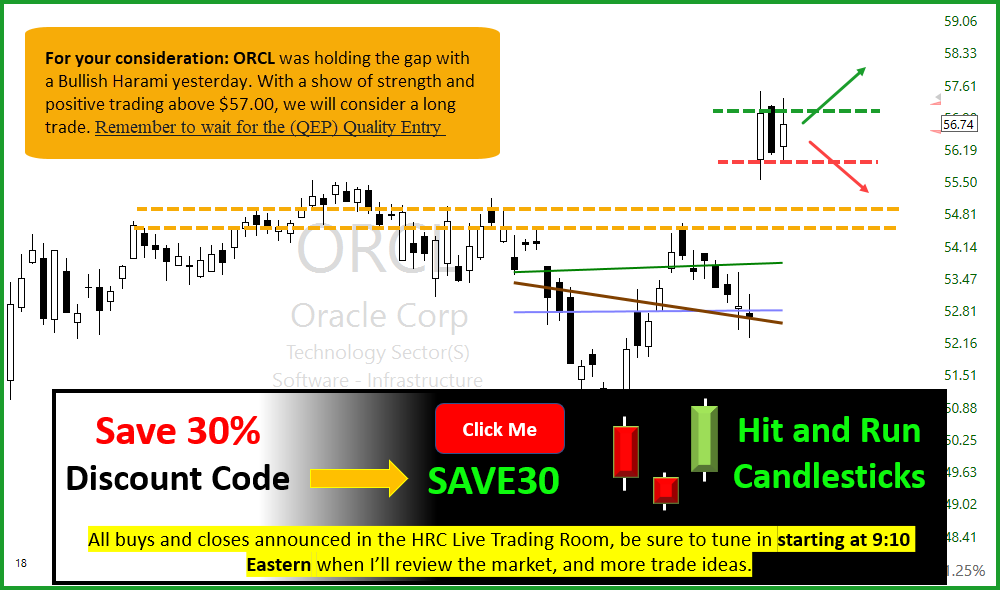
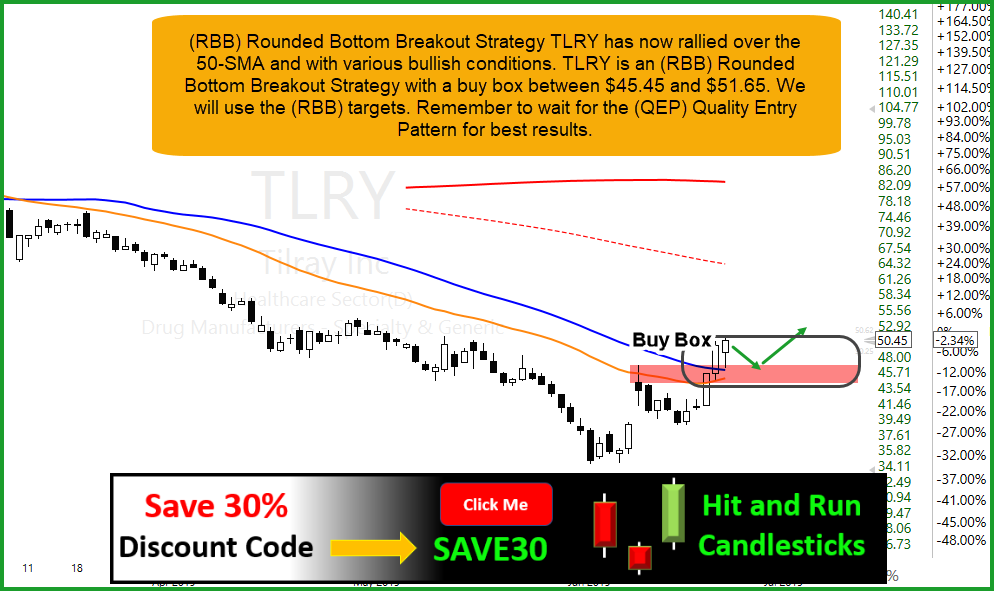
For your consideration: Due to technical issues there are no trade ideas today → (QEP) Quality Entry Patterns)
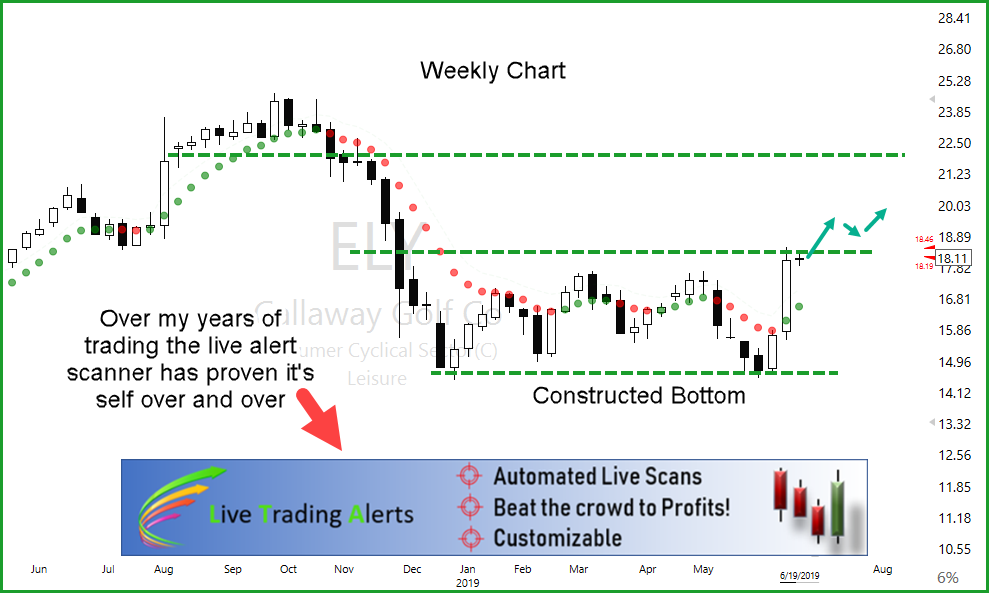
The LTA Alert Scanner and TC2000 are my tools of choice WHY? Because they work!.
Rick and the HRC Members kick off the trading room starting at 9:10 Eastern We review the market, and today’s trade ideas.
Disclosure: We do not act on all trades we mention, and not all mentions acted on the day of the mention. All trades we mention are for your consideration only.
✅ A Traders Edge In All Markets
The LTA Scanner can filter out charts that are trending, up or down and alert on charts that have Candlestick signals and patterns, western patterns and when indicators, such as MACD, Stochastics, RSI or Bollinger Bands have crossed or reaches the desired level. 😎 One of my favorites is the T-Line Band Scan. The right tools for the job.
We use The Worlds Best Trading Tools, TC2000 for charting, LTA-Live Trading Alerts for real-time price action, candle and candle patterns, and western patterns. The right tools for the right job.👍


Free YouTube Education • Subscription Plans • Private 2-Hour Coaching
DISCLAIMER: Investing / Trading involves significant financial risk and is not suitable for everyone. No communication from Hit and Run Candlesticks Inc, its affiliates or representatives is not financial or trading advice. All information provided by Hit and Run Candlesticks Inc, its affiliates and representatives are intended for educational purposes only. You are advised to test any new trading approach before implementing it. Past performance does not guarantee future results. Terms of Service