
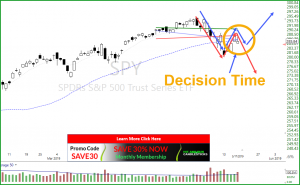
It looks has been performing a balancing act around the 50-SMA for the past nine days, all below its recent high. A close above $290.50 could set the bulls free to challenge the $294.95 high. Weakness and a failure to claim the 50-SMA for the Bulls could lead into chart patterns such as a “Blue Ice Failure” and a “Bearish H Pattern.” Both of these patterns are on the edge of success and could push price closer to the 200-SMA or about. The T2122 chart (3wk New High/Low Ratio has not turned up from the recent down move. When looking at the VXX on the daily chart, it looks like like it has been through a meat grinder, but the chart pattern is still holding a bullish form. To say this market has been easy to trade the last couple of weeks would be a flat out lie. It’s important to know when duck into a cove, tie up and wait out the storm.

Trade Ideas
We are adding the following trade ideas to our watch-list. PEP, GIS, CMCSA, PLUG, MDB, CELG, ATHM, SQQQ, TZA, SOXS, XRX, VXX, SPXS. We follow the trend, buy near support, profit into strength for solid base hits.

We use 2 of The Worlds Best Trading Tools, TC2000 for charting, LTA-Live Trading Alerts for real-time price action, candle and candle patterns, and western patterns. The right tools for the right job.👍


Free YouTube Education • Subscription Plans • Private 2-Hour Coaching
DISCLAIMER: Investing / Trading involves significant financial risk and is not suitable for everyone. No communication from Hit and Run Candlesticks Inc, its affiliates or representatives is not financial or trading advice. All information provided by Hit and Run Candlesticks Inc, its affiliates and representatives are intended for educational purposes only. You are advised to test any new trading approach before implementing it. Past performance does not guarantee future results. Terms of Service


Comments are closed.