
The SPY printed a Hammer yesterday after a gap down finding the 200-SMA as we have been talking about the past week, on fairly strong volume yesterday. The T2122New High/Low Ratio chart from TC2000 is at a low 4.35. The weekly chart is sitting on the 50-period moving average while the monthly chart is printing a Bearish Engulf, there no doubt the sellers are holding the cards, the buyers are just not giving up very easy. Bullish follow-through above yesterdays Hammer (above $278.90) should produce a small relief rally to maybe to the $280.60 area. Many reading this knows how much I like the RBB chart setup, and the VXX is, in fact, one of these setups. Price is now above the 50-SMA and looks to be determined to challenge the 200-SMA. The VXX has challenged the 200-SMA a couple of time the last few months, and if the VXX can stay below the 200-SMA, the markets should be safe from disaster but not choppy trading. If the VXX finds a path above the 200-SMA, the market could be in a little trouble. Good trading my friends.

A Traders Edge In All Markets
The LTA Scanner can filter out charts that are trending, up or down and alert on charts that have Candlestick signals and patterns, western patterns and when indicators, such as MACD, Stochastics, RSI or Bollinger Bands have crossed or reaches the desired level. Hey, check out the NEW BULL PERFECT TREND ALERT. The right tools for the job.
5/30/2019 Acton Plan
- Consider the trend of the SPY, DIA’s IWM, and the QQQ’s when trading, it is easier to make money trading with the trend.
- 85% of all stocks follow the trend of the SP-500
- Don’t try to time the exact turn or trend change of chart
- Manage current trades looking for base hits.
- Welcome small losses
- Trade smaller, less capital in a position
- Fewer positions
- Trade strong, stable charts, not one-day wonders
- Trade with the trend of the chart
- A trading plan for each trade.

Trades Ideas
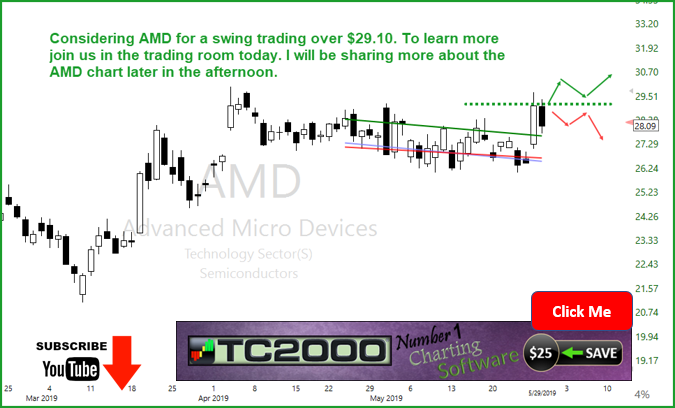
AMD has broken above the T-Bands suggesting bullishness, I am considering a trade above $29.10 and only on an acceptable entry pattern. To learn more join us in the trading room, we will discuss AMD and more Trade-Ideas as well.

We use 2 of The Worlds Best Trading Tools, TC2000 for charting, LTA-Live Trading Alerts for real-time price action, candle and candle patterns, and western patterns. The right tools for the right job.👍


Free YouTube Education • Subscription Plans • Private 2-Hour Coaching
DISCLAIMER: Investing / Trading involves significant financial risk and is not suitable for everyone. No communication from Hit and Run Candlesticks Inc, its affiliates or representatives is not financial or trading advice. All information provided by Hit and Run Candlesticks Inc, its affiliates and representatives are intended for educational purposes only. You are advised to test any new trading approach before implementing it. Past performance does not guarantee future results. Terms of Service


Comments are closed.