

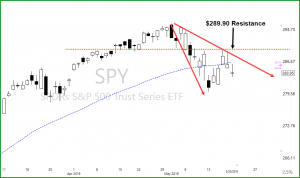
Futures are up this morning as this blog is being written. Looking at the SPY (weekly chart) it is clear to see price on a support and the 23.6 Fib line. (Not too surprised of a bounce and a test of the 50-SMA) The daily chart has the 200-SMA 2.3% below yesterdays close, and the daily Blue Ica failure is still in the game. Bullish price action would have to close above $289.20 for the buyers to be in control. In my humble opinion, anything less than $289.20 would keep the current downtrend intact. The T2122 chart is now in an oversold area; buyers are starting to peck around, but will they be able to give us a solid close in the next day or so over $289.20? Remember base hits and protective stops. Set a plan 2:1 minimum and when long buy near support and when shorting buy near resistance. The market of late has been challenging for even the best of traders, ask them what their tricks are to survive.

Trade Ideas
We are adding the following trade ideas to our watch-list. Be sure to check earnings dates. COST, SYF, PEP, BX, AXP, LMT, MA, MET. Trend, Protective Stops, Base hits.

We use 2 of The Worlds Best Trading Tools, TC2000 for charting, LTA-Live Trading Alerts for real-time price action, candle and candle patterns, and western patterns. The right tools for the right job.👍


Free YouTube Education • Subscription Plans • Private 2-Hour Coaching
DISCLAIMER: Investing / Trading involves significant financial risk and is not suitable for everyone. No communication from Hit and Run Candlesticks Inc, its affiliates or representatives is not financial or trading advice. All information provided by Hit and Run Candlesticks Inc, its affiliates and representatives are intended for educational purposes only. You are advised to test any new trading approach before implementing it. Past performance does not guarantee future results. Terms of Service


Comments are closed.