Resistance Breakout Today
✅ SMS text alerts and reminders?👈
✅ At hit and Run Candlesticks, we focus on Stocks / Simple Directional Options
The market (SPY), With futures up this morning on Trade Talk meetings and some Hong Kong headway we will see a breakout of the early August resistant level. And I am sure you know how crucial bullish control and follow-through is. Bullish follow-through above about $294.25 could run back price action into the $300.00 area for a July high challenge. Please note this is all based on the bulls taking the ball back. We are only one tweet away from 300-500 point moves in this crazy market. If you follow the T-Line Bands the SPY weekly chart, you can see the last 5 bars testing the lower red line, challenging the mid-blue line.
Trading The T-Line Trading the T-Line, also known as the trigger line or trend line, works well for all trading plans and investment strategies. If you want to embrace this strategy, look into (what I call) the T-Line run. T-Line runs can be very profitable if you know how to identify them and use them properly. Curious? Read on to learn more about the types of T-Line run, get some helpful application tips, and learn how to confirm your trades to make smart entrances and exits. Trading The T-Line
The I path Series S&P 500 VXX Short Term Futures ETN. The VXX weakness yesterday closed below the 34-EMA, and today the bearish price action in the VIX should pull the T-Line down with it. The price action the vix is demonstrating the lack of fear trader now have.
Trade-Ideas
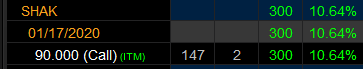
For your consideration: Here are a few charts I thought should go on the watch-List, remember to trade your trade. SFM, CVS, COST, SHAK, TLRY, PG, CMG, ZAYO, UPS, KR. Trade smart and wait for the QEP→ (QEP) Quality Entry Patterns). We do not recommend stocks to trade
😊 Have a great trading day – Rick

✅ Check out our newest YouTube videos👈

🎯 Mike Probst: Rick, Got CTL off the scanner today. Already up 30%. Love it.
🎯 Dick Carp: the scanner paid for the year with HES-thank you
🎯 Arnoldo Bolanos: LTA scanner really works $$, thanks Ed.
🎯 Bob S: LTA is incredible…. I use it … would not trade without it
🎯 Malcolm .: Posted in room 2, @Rick… I used the LTA Scanner to go through hundreds of stocks this weekend and picked out three to trade: PYPL, TGT, and ZS. Quality patterns and with my trading, up 24%, 7% and 12%…. this program is gold.
🎯 Friday 6/21/19 (10:09 am) Aaron B: Today, my account is at +190% since January. Thanks, RWO HRC Flash Malcolm Thomas Steve Ed Bob S Bob C Mike P and everyone that contributes every day. I love our job.
Disclosure: We do not act on all trades we mention, and not all mentions acted on the day of the mention. All trades we mention are for your consideration only.


Free YouTube Education • Subscription Plans • Private 2-Hour Coaching
DISCLAIMER: Investing / Trading involves significant financial risk and is not suitable for everyone. No communication from Hit and Run Candlesticks Inc, its affiliates or representatives is not financial or trading advice. All information provided by Hit and Run Candlesticks Inc, its affiliates and representatives are intended for educational purposes only. You are advised to test any new trading approach before implementing it. Past performance does not guarantee future results. Terms of Service