Road To Wealth Account Hit New Highs
Road To Wealth Account hit a new high yesterday and is on target to hit our year-end goal within the next few days. As of yesterdays close the account is up 364% this year. We have gone from $5,100.00 to $23.783.00; please keep reading.
Today we have decided not to post any trade ideas; we feel it is the best to focus and manage our own trading accounts and we will be in the trading rooms today giving our thoughts on the market now and the coming week. We are very loud about not chasing and waiting for the market/charts to come to you. Because of being prepared and listening to what the charts were saying we have positioned our account so that our risk is limited and the reward is in our favor.
Rounded Bottom Breakout Workshop and 30-Day Alert Bonus are filling up fast, Don’t miss out on a few of the tools that have produced 364% in our “Road To Wealth” Account year to date. WORKSHOP
Past performance is not indicative of future returns
Good Trading, Rick, and Trading Team
____________________________________________________________
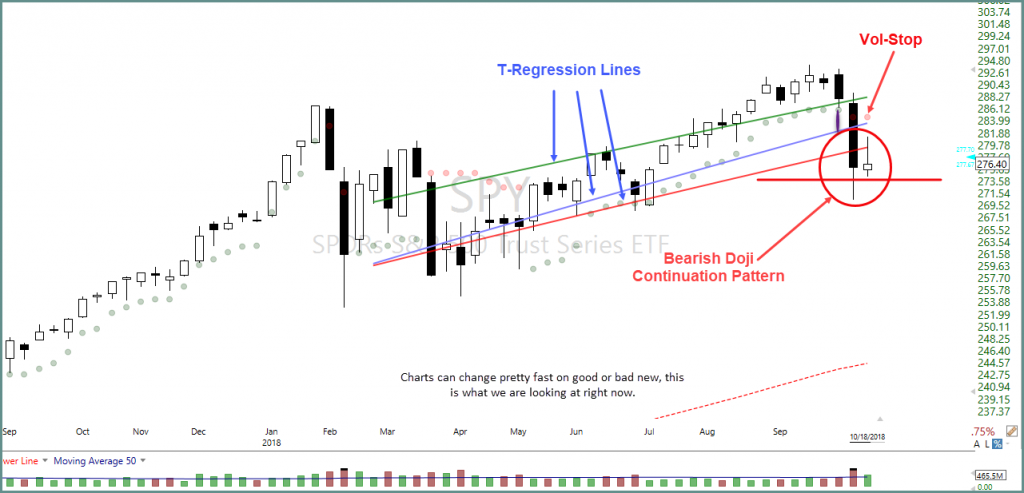
SPY • SP-500
The SPY found out Dotted Duece yesterday and will likely find the 200-SMA today.
We know yesterday was a hard day for some and a great day for others. I am happy to say that if you were a Hit and Run Candlestick member the past week, you are probably one of the happy ones. We have been “warning” and talking about lightning up on long positions and adding a few positions that you could benefit from if the market lost its mojo. Yes, that’s what we did, closed a few longs and bought VXX calls and SPY puts. We also lowered our position cost just as we mentioned in the trading room. By making a few adjustments and having little patients yesterday was a great day.
I assume you know about the “Trading For Wealth” Account if you can find it HERE. As of yesterdays close the account is up 364% this year. We have gone from $5,100.00 to $23.783.00
Subscription Plans • Private 2-Hour Coaching
****VXX – The VXX cut through our Dotted Duece and will likely challenge the 200-SMA today
Focus Trading Education
Candlesticks • Price Action • T-Line • T-Line Bands • Support • Resistance • Trend • Trendlines • Chart Patterns • Buy Box • Volatility Stops • Profit Zones • Entry Zones • Protective Stops • RBB Rounded Bottom Breakout Strategy • Pop Out of The Box Strategy • Pinball Strategy • Trade Planning, Fibonacci, Stoch/RSI
Testimonial
This is not your usual service that sends out a ton of stock recommendations, and then cherry picks the winners to show you how great they are. Hit and Run Candlesticks and Right Way Options are truly educational services. They taught me how to trade not what to trade. The entire team: Rick, Doug, Steve, and Ed are there to help and answer your questions. They are awesome. They cut years off my learning curve. And it’s a team effort. Everyone in the room (all the members) are there to help with invaluable insights and advice. The only service you will ever need. Thanks to all the team for how you have helped me and for all you do. –Jonathan Bolnick
Rare to have a service teach you how they find their choices but, HRC/RWO teach you how to fish instead of fishing for you. And, your ideas are not panned but shared, implemented, or improved. Sharing is caring. –Thomas Bradly
Past performance is not indicative of future returns
Investing and Trading involve significant financial risk and is not suitable for everyone. No communication from Hit and Run Candlesticks Inc, Right Way Option, Trader Vision 2020, Top Gun Futures or Rick Saddler, Doug Campbell, Ed Carter, Steve Risner is to be considered financial or trading advice. All information is intended for Educational Purposes Only. Terms of Service.
Rick Saddler, Doug Campbell, Ed Carter, Steve Risner is not a licensed financial adviser nor do they offer trade recommendations or advice to anyone.