

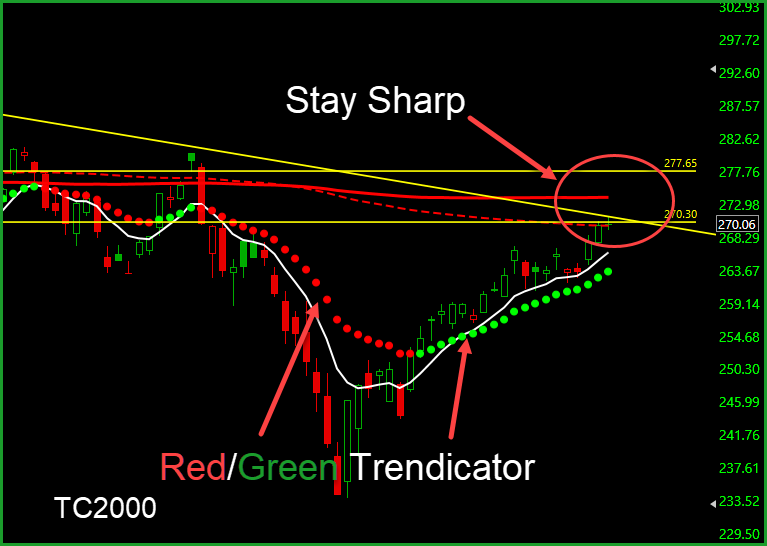
The battle between Bullish and Bearish is up front and center lately. On Friday the SPY daily chart closed with a Doji in the thick of resistance, the trend remains bullish with price leading the T-Line and the T-Line leading the 34-EMA. The 20-SMA and 34-EMA have risen above the 50-SMA. Friday’s price action felt the pressure of the bearish downtrend line and the 200-SMA is trying to intimidate price. The area surrounding the 200-SMA ($270.30 and $277.65) will likely be a challenge for price action. Price is currently at our Dotted Duece line, success over the Dotted Duece should result in a challenge of the 200-SMA. Both areas will take the full power of the Bull, keep a watchful eye out for that sneaky little Bear. We are concerned about the T2122 levels in TC2000 pegged above 80 for so long. These high levels are concerning and a warning clue. BUT price and trend is king, and as long as price action remains bullish over the RED/GREEN Trendicator, we will remain cautiously bullish. The CBOE Market Volatility Index (VIX) The CBOE Market Volatility Index (VIX) price action is showing no signs of fear with


From out trade-idea list: NBR, KKR, WDC, MU, NTAP, NYL, LVS, HAL will be talked about in our pre-market workshop. Past performance does not guarantee future results.

Free YouTube Education • Subscription Plans • Private 2-Hour Coaching
DISCLAIMER: Investing/ Trading involves significant financial risk and is not suitable for everyone. No communication from us should be considered as financial or trading advice. All information provided by it and Run Candlesticks Inc, its affiliates or representatives is intended for educational purposes only. You are advised to test any new approach before implementing it. Past performance does not guarantee future results. Terms of Service


Comments are closed.