IWM Puts

Bought IWM Puts on the LTA scanner alert today, sold part for a 43% profit.
HD stopped out 2sd half + 45% – Grateful to the LTA scanner alerting the buy
Information about a chart, Price action, trend, patterns, and

Bought IWM Puts on the LTA scanner alert today, sold part for a 43% profit.
HD stopped out 2sd half + 45% – Grateful to the LTA scanner alerting the buy
Information about a chart, Price action, trend, patterns, and

Global Growth concerns once again raise its ugly head after European data disappoints just one day after a broad-based market rally. I must admit I was hoping for a little follow through to the upside this morning but the futures are currently pointing to a gap down open across all indexes. Overall it has been a great week of gains in the QQQ & SPY and some profit-taking as we head into the weekend should not be that surprising.
Although yesterdays strong rally may have felt as if the all-clear sounded, however, a quick look at the index charts shows us that price resistance above is still at work. The DIA and IWM are particularly problematic with the lower high still in force even after such a bullish move Thursday. Keep that in mind as you plan your risk heading into the weekend.

We have a light day on the Earnings Calendar with less than 40 companies reporting. Notable earnings DXLG, HIBB, JKS & TIF.

After such a big rally on Thursday that was very broad-based I was hoping for a little more upside this morning. However, the market has different plans after some disappointing European data once again raises concerns of a global economic slowdown. Asian markets managed an ever so slightly bullish close across the board but this morning European markets are all seeing red.
US Futures that have been out of sync of late have linked back up and currently indicate a lower open today. The recently problematic Existing Home Sales out at 10 AM Eastern could belay some slow down concerns if the number comes in showing an increase as the consensus is expecting. Of course if it misses the exact opposite may be true adding to the slow down concerns this morning. All and all it has been a fantastic week of gains and there is nothing wrong with a little profit-taking as we head into the weekend.
Trade Wisely,
Doug


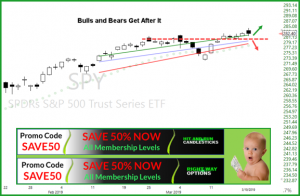
From Open to close yesterday the SPY had a $4.10 day, not bad at all. Now the buyers need to keep their bulls focused in the right direction. With the fear of rescission heating up, the bulls will likely catch a little wind that smells like fear. At some point, enough fear will cause selling in the market. MKE being down and the BA troubles will weigh on the DOW today. (Caution). The buyers produced a nice Bullish Engulf on the SPY chart closing at $284.73; A Bullish Engulf is just one gear in the machine. Now the buyers need to show they have what it takes to drive the price action higher. So far our Red Green Trend is working, the question is will the buyers be able to push the 50SMA over the 200SMA?
Yesterday (Thursday) was a nice profitable day, and I suspect today will be the same because we typically take profits of Fridays and lighten up going into the weekend.

This past week the LTA scanner proved it’s value to traders helping with

✅ Member LTA Live Scanner Discount Code: Can be found on the member’s login page down toward the bottom. BIG SAVINGS
✅ Trade-Ideas for considerations: No trade ideas on Friday’s. Have a great weekend!
✅ 50% Discount Available: Hit and Run Candlesticks • Right Way Options • Use Promo Code: SAVE50
Testimonial
Took 20% on WIX puts! Thank you LTA- Live Trading Alerts
Jerry G.
Testimonial
I have hit for over $300 this morning using your LTA scanner, I think I have found my niche!
Coach B.


✅Save time reviewing hundreds of charts. ✅Find EXACTLY the right set up by being alerted for only those tickers that qualify. ✅Stop “Chasing trades” by being alerted of the move (not finding out later.) ✅Eliminate “trouble pulling the trigger” (be sure when a ticker is moving.) ✅Stop “leaving money on the table” (manage your exits with lower-time alerts.) ✅Stop “Predicting” by trading alerts that show the turn, not forecast it. ✅Stop ignoring the overall market (by watching alerts on DIA, SPY, IWM, QQQ.) ✅Gain massive efficiency over flipping through charts (hoping to find them at just the right time) or waiting on someone to feed you trade ideas.

Free YouTube Education • Subscription Plans • Private 2-Hour Coaching
DISCLAIMER: Investing / Trading involves significant financial risk and is not suitable for everyone. No communication from Hit and Run Candlesticks Inc, its affiliates or representatives is not financial or trading advice. All information provided by Hit and Run Candlesticks Inc, its affiliates and representatives are intended for educational purposes only. You are advised to test any new trading approach before implementing it. Past performance does not guarantee future results. Terms of Service
HD – Alerted us with the LTA Scanner; HD alerted on the RBB scan, T-Band scan, and Red Green scan. 3/21/19 closed 1/2 with 35% raising stop on second 1/2
XOP – Alerted us a few days ago for the (RBB) Rounded Bottom Breakout was setting up. Currently up 34%
Information about a chart, Price action, trend, patterns, and
Information about a chart, Price action, trend, patterns, and
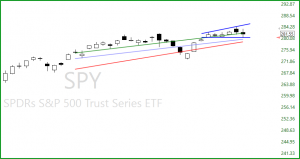
For the most part, the SPY’s price action was uneventful yesterday with the statement by the Fed Chairman. The past two candles are suggesting a bit chop headed our way and a possible lower T-Band test. A close today below yesterdays low (280.32) would clue us in on a possible deeper move down, below 278.45 would set up a test of the March low. If price action and can come together and hold above 278.45ish (our Red Line) a few more buyers would be interested and could push the SPY back up and above the Green line T-Band Line. The trend and price action is the best information you can have as a trader and to have a tool to deliver that information would be golden.
✅ Member LTA Live Scanner Discount Code: Can be found on the member’s login page down toward the bottom. BIG SAVINGS
✅ Trade-Ideas for considerations: Long – NFLX. PTI, HES, DVN. Short – UNP, TDCD, RTN, ADSK, PGR. Past performance does not guarantee future results.
✅ 50% Discount Available: Hit and Run Candlesticks • Right Way Options • Use Promo Code: SAVE50
Testimonial
Took 20% on WIX puts! Thank you LTA- Live Trading Alerts
Jerry G.
Testimonial
I have hit for over $300 this morning using your LTA scanner, I think I have found my niche!
Coach B.
✅Save time reviewing hundreds of charts. ✅Find EXACTLY the right set up by being alerted for only those tickers that qualify. ✅Stop “Chasing trades” by being alerted of the move (not finding out later.) ✅Eliminate “trouble pulling the trigger” (be sure when a ticker is moving.) ✅Stop “leaving money on the table” (manage your exits with lower-time alerts.) ✅Stop “Predicting” by trading alerts that show the turn, not forecast it. ✅Stop ignoring the overall market (by watching alerts on DIA, SPY, IWM, QQQ.) ✅Gain massive efficiency over flipping through charts (hoping to find them at just the right time) or waiting on someone to feed you trade ideas.
Free YouTube Education • Subscription Plans • Private 2-Hour Coaching
DISCLAIMER: Investing / Trading involves significant financial risk and is not suitable for everyone. No communication from Hit and Run Candlesticks Inc, its affiliates or representatives is not financial or trading advice. All information provided by Hit and Run Candlesticks Inc, its affiliates and representatives are intended for educational purposes only. You are advised to test any new trading approach before implementing it. Past performance does not guarantee future results. Terms of Service
The FOMC signals no rate increases for the rest of the year but the market seems very unimpressed by the action. While the market has been trying to ignore the clues of an economic slowdown the Fed appear to have taken a no-confidence vote in its strength. Financials quickly reacted negatively to the news and are looking slightly lower this morning.
Asian and European market responded mostly higher on the news but the US Futures currently show mixed reviews. The Dow indicates a slightly lower open while the NASDAQ is suggesting slightly higher. Technically speaking the SPY and the QQQ are in very good shape but the Dow and the IWM having printed lower highs at resistance there is reason for a little caution. Also keep an eye on the VIX that once again quietly crept up yesterday. If that continues it could trigger a little profit-taking as we head toward the weekend.
We have nearly 100 companies reporting earnings today with the most notable being, NKE, CSIQ, CTAS, CEO, CAG, DRI, LE, PTR & TCEHY.
The market seems quite unimpressed by the FOMC decision to avoid raising interest rates for the rest of the year. Normally low rates would inspire the market but in this case the FOMC appears not so confident in the overall economy. During the night the Dow Futures were down about 100 points even though Asian and European markets responded marginally higher. As I write this futures have rallied in the pre-market pump but it would not surprise me to the overnight lows tested sometime today.

The QQQ remains very strong, the SPY is holding firm in consolidation but the DIA and IWM continue to signal a little caution due to their lower high prints. All indexes continue to have resistance challenges above making the path forward difficult to determine. The VIX edged higher again yesterday suggesting a little fear might be creeping in which could lead to some profit-taking if that were to continue as we head toward the weekend.
Trade Wisely,
Doug
The SPY is still having a tough time navigating the rough seas around the $280.00 – $282.00 area. The reason may be the bears are trying to build a right shoulder to go along with the head and left shoulder (Weekly Chart). While the possible right should is in construction, we will see price action chop around, and this will test the best of traders. Having a handle on the trend and price action within the trend is a huge advantage for the active swing trader. Yesterday’s price action closed above the T-Line, and the T-Line is tracking above the 17ema and the 34ema, other than yesterday’s candle controlled by the sellers the current trend is still bullish. The price action and the health of the current trend will determine the outcome of the possible right shoulder. Tools of a good swing trader might include a strong understanding of chart patterns, trends and trend lines, support and resistance and the all-important price action.
✅ Member LTA Live Scanner Discount Code: Can be found on the member’s login page down toward the bottom. A 34% savings!
✅ Trade-Ideas for considerations: Long – RDFN, RIOT, COTY, FL, MRK. Short – UNP, IRBT, BBT. Past performance does not guarantee future results.
✅ 50% Discount Available: Hit and Run Candlesticks • Right Way Options • Use Promo Code: SAVE50
Testimonial
Took 20% on WIX puts! Thank you LTA- Live Trading Alerts
Jerry G.
Testimonial
I have hit for over $300 this morning using your LTA scanner, I think I have found my niche!
Coach B.
✅Save time reviewing hundreds of charts. ✅Find EXACTLY the right set up by being alerted for only those tickers that qualify. ✅Stop “Chasing trades” by being alerted of the move (not finding out later.) ✅Eliminate “trouble pulling the trigger” (be sure when a ticker is moving.) ✅Stop “leaving money on the table” (manage your exits with lower-time alerts.) ✅Stop “Predicting” by trading alerts that show the turn, not forecast it. ✅Stop ignoring the overall market (by watching alerts on DIA, SPY, IWM, QQQ.) ✅Gain massive efficiency over flipping through charts (hoping to find them at just the right time) or waiting on someone to feed you trade ideas.
Free YouTube Education • Subscription Plans • Private 2-Hour Coaching
DISCLAIMER: Investing / Trading involves significant financial risk and is not suitable for everyone. No communication from Hit and Run Candlesticks Inc, its affiliates or representatives is not financial or trading advice. All information provided by Hit and Run Candlesticks Inc, its affiliates and representatives are intended for educational purposes only. You are advised to test any new trading approach before implementing it. Past performance does not guarantee future results. Terms of Service

The bulls were in full force and driving upward until news came out raising questions about the US/China trade negotiations bringing out the bears to reverse the days progress. After the close, FDX reported disappointing earnings raising more questions about global growth concerns. Asian markets were tepid and cautious overnight closing mixed but mostly lower. European markets are currently trading lower across the board this morning as well.
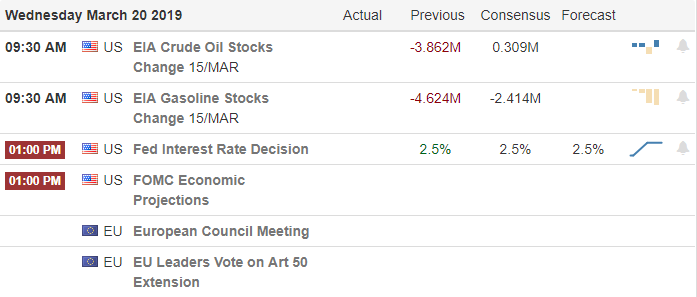
US Futures are pointing to a flat open and would not be a surprise to see light and choppy price action until the FOMC reveals it’s a decision on interest rates and delivers their forecast at 2:00 PM Eastern. Directly after expecting some wild price volatility that could extend through the chairman’s press conference scheduled at 2:30 PM. Setting that aside, the candle patterns left behind on yesterday index charts increases the caution level with their placement at or near price resistance.
We have 52 companies on the Earnings Calendar stepping up to report today. Among the notable reports: GIS, GES, MU and WSM.
Early bullishness yesterday faded away in the afternoon session after a news report suggesting the trade negotiations with China had run into new challenges. Candle patterns left behind at or near resistance levels suggest a little caution might be in order as the market tries to digest the full measure of the issue. The disappointing market price action dealt with another disappointment as FDX missed earnings and tumbling nearly 7%.
Today is all about the FOMC and although the committee is not likely to raise rates, their forward forecast and decisions on balance sheet unwinding will have the market’s attention. The festivities begin at 2:00 PM Eastern with the Chairman’s press conference at 2:30. It would not be a surprise to see light choppy price action as we wait for the Fed announcement followed by a period of volatility and wild price swings directly after. Currently futures are pointing to falt open with European markets currently in red across the board and Asian markets having closed flat to mostly lower overnight.
Trade Wisely,
Doug
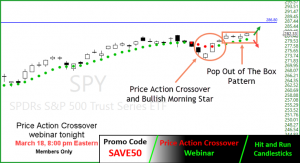
Looking at yesterdays SPY chart, I have drawn a box around the POP Out of The Box Pattern, with a bullish pop and hold today we will have a confirmed POOTB pattern. The bulls might finally be on their way to challenge the September / October highs with the first challenge of $286.80ish. The SPY had a nice pullback 7/8 days ago and printed a bullish Morning Star candle pattern with bullish follow-through. Using the Red/Green Line crossover you can see a perfect Price Action Crossover on March 19. Today’s Trade-Ideas for consideration based on the RBB setup and Price Action crossover.
Join me at tonight’s member webinar 3/19/19 @ 8:00 pm Eastern; I will be teaching this strategy. Members FREE admission, Save on Monthly Membership with SAVE50 promo Code: only $110.00

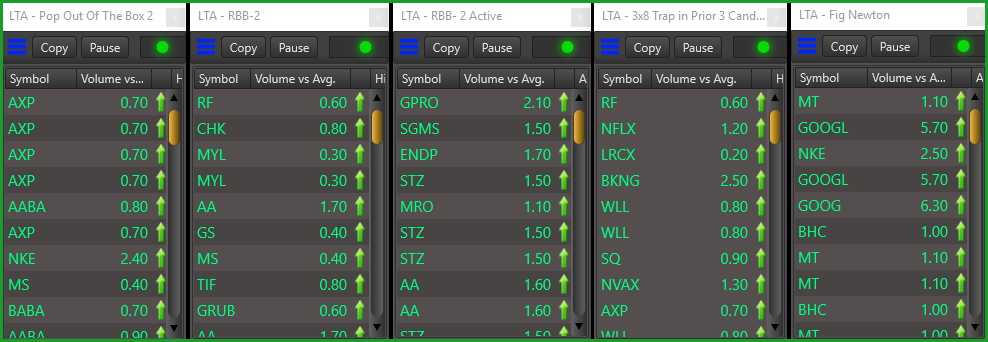
✅ Trade-Ideas for considerations: CHK, ESV, RIG, ECA, CPRI, XOP, VLO, APA, ALGN, NVDA, NTAP. Past performance does not guarantee future results. (Transparency HRC is currently long XOP)
✅ Trading rooms and Services include: Hit and Run Candlesticks • Right Way Options • Top Gun Day Trading
Testimonial
Took 20% on WIX puts! Thank you LTA- Live Trading Alerts
Jerry G.
Testimonial
I have hit for over $300 this morning using your LTA scanner, I think I have found my niche!
Coach B.
✅Save time reviewing hundreds of charts. ✅Find EXACTLY the right set up by being alerted for only those tickers that qualify. ✅Stop “Chasing trades” by being alerted of the move (not finding out later.) ✅Eliminate “trouble pulling the trigger” (be sure when a ticker is moving.) ✅Stop “leaving money on the table” (manage your exits with lower-time alerts.) ✅Stop “Predicting” by trading alerts that show the turn, not forecast it. ✅Stop ignoring the overall market (by watching alerts on DIA, SPY, IWM, QQQ.) ✅Gain massive efficiency over flipping through charts (hoping to find them at just the right time) or waiting on someone to feed you trade ideas.
Free YouTube Education • Subscription Plans • Private 2-Hour Coaching
DISCLAIMER: Investing / Trading involves significant financial risk and is not suitable for everyone. No communication from Hit and Run Candlesticks Inc, its affiliates or representatives is not financial or trading advice. All information provided by Hit and Run Candlesticks Inc, its affiliates and representatives are intended for educational purposes only. You are advised to test any new trading approach before implementing it. Past performance does not guarantee future results. Terms of Service