
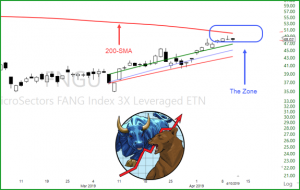
A chart I have up and on one of my monitors at all times is the FANG chart (Ticker FNGU) or FANG Index 3x Leveraged ETN FANGS stocks are (FB) (AMZN) (AAPL) (NFLX) and (GOOG). The FNGU chart has been instrumental in determining trend direction and pullbacks in the overall market. As you can see from the chart, it is approaching the 200-SMA. The 200-SMA is a moving average know for its support and resistance. More time than not I have experienced price action consolidation when price enters into the 200-SMA zone. While the market is still trending bullish, we will continue to trade bullish to the long side while monitoring how price action acts on the (FNGU) chart in the 200-SMA zone.
Live Trading Alerts Clinic: Today, Thursday, April 11, 2019, Ed Carter will be covering 26 new scans and answering any questions you might have. The LTA- Live Trading Alerts Scanner has proven it’s self has the leader in auto scanning for candlesticks signal, chart patterns, breakouts, and break downs. Click Here and Choose Room#4

✅ Trade-Ideas for consideration: ATVI, V, SC, NVTA, VLO, CY. Let the LTA Scanner do you work for you

Free YouTube Education • Subscription Plans • Private 2-Hour Coaching
DISCLAIMER: Investing / Trading involves significant financial risk and is not suitable for everyone. No communication from Hit and Run Candlesticks Inc, its affiliates or representatives is not financial or trading advice. All information provided by Hit and Run Candlesticks Inc, its affiliates and representatives are intended for educational purposes only. You are advised to test any new trading approach before implementing it. Past performance does not guarantee future results. Terms of Service


Comments are closed.