NSU Setup and Trade Plan

Please join me for the free Trader Vision 20/20 Weekly Workshop.

TODAY at 4:15 pm Eastern in Room #3 (no password needed)

http://hitandruncandlesticks.webinato.com/room3

 (This week, I will be providing a first look at our new Scanning tool, as well as planning trades.)


Today’s Featured Trade Idea is NSU.

You can read more about this trade in Rick’s blog post here.  Members can also see his detailed review in the trading room at 9:10am Eastern.  For now, here is my analysis and a potential trade plan made using our Trader Vision 20/20 software.

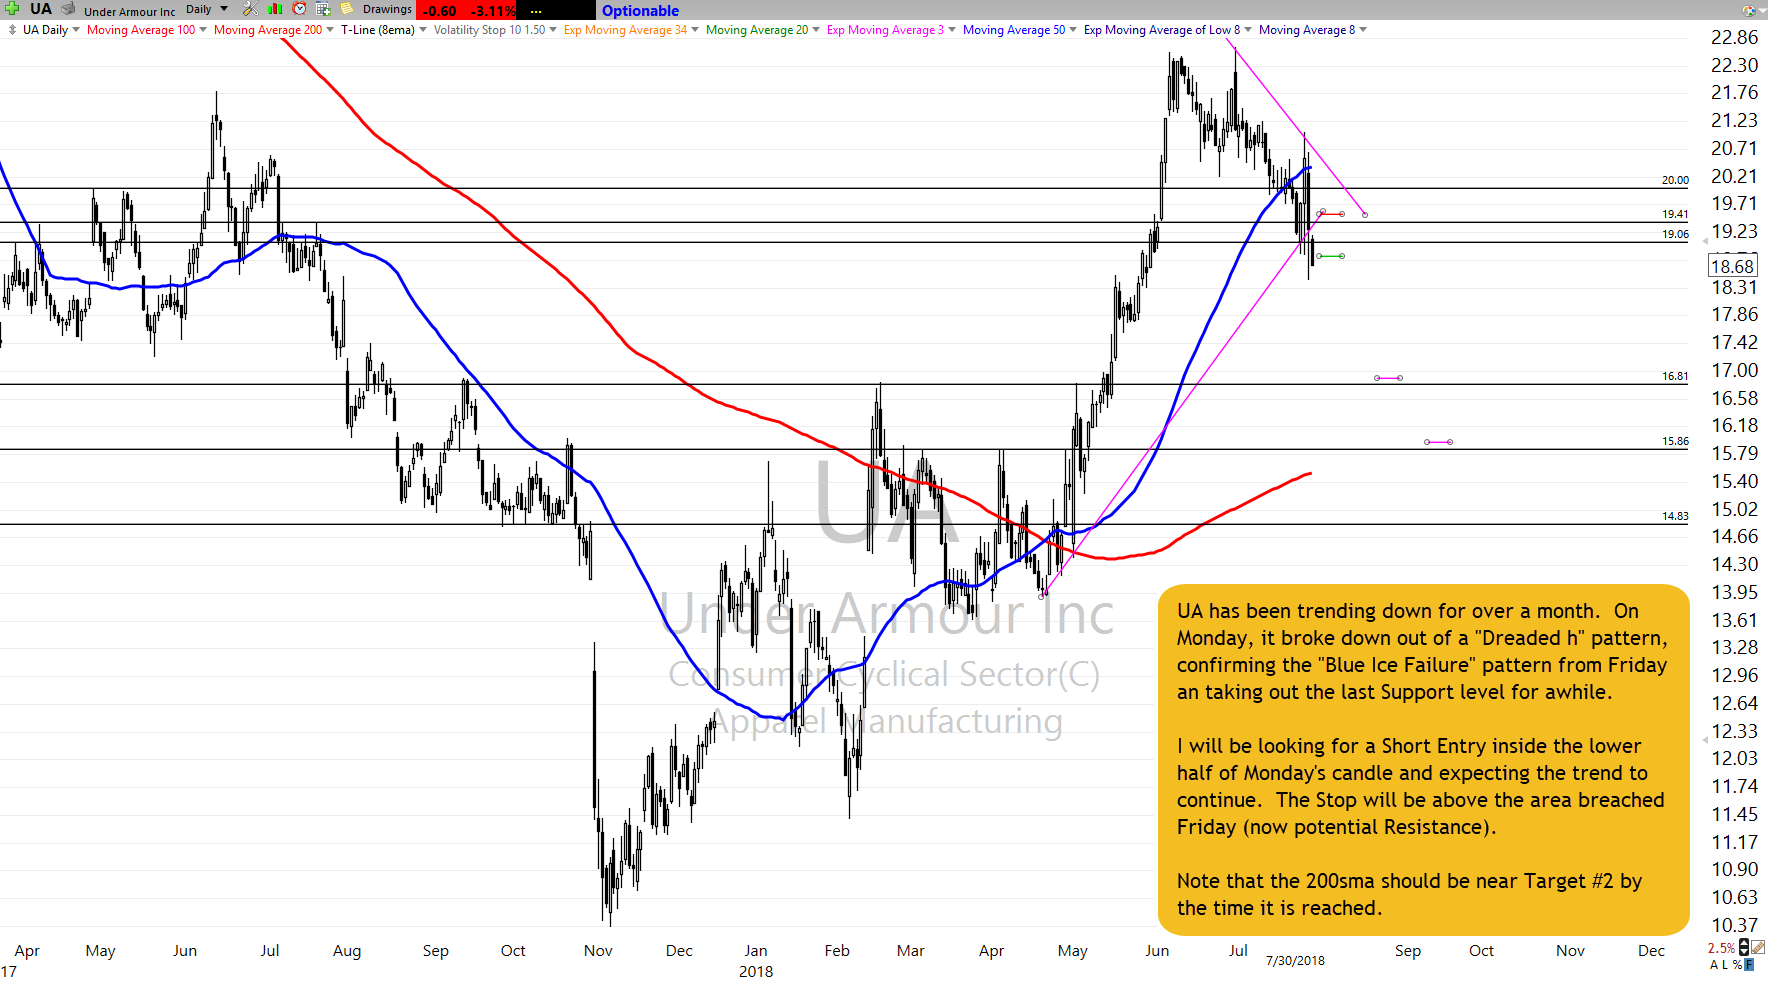
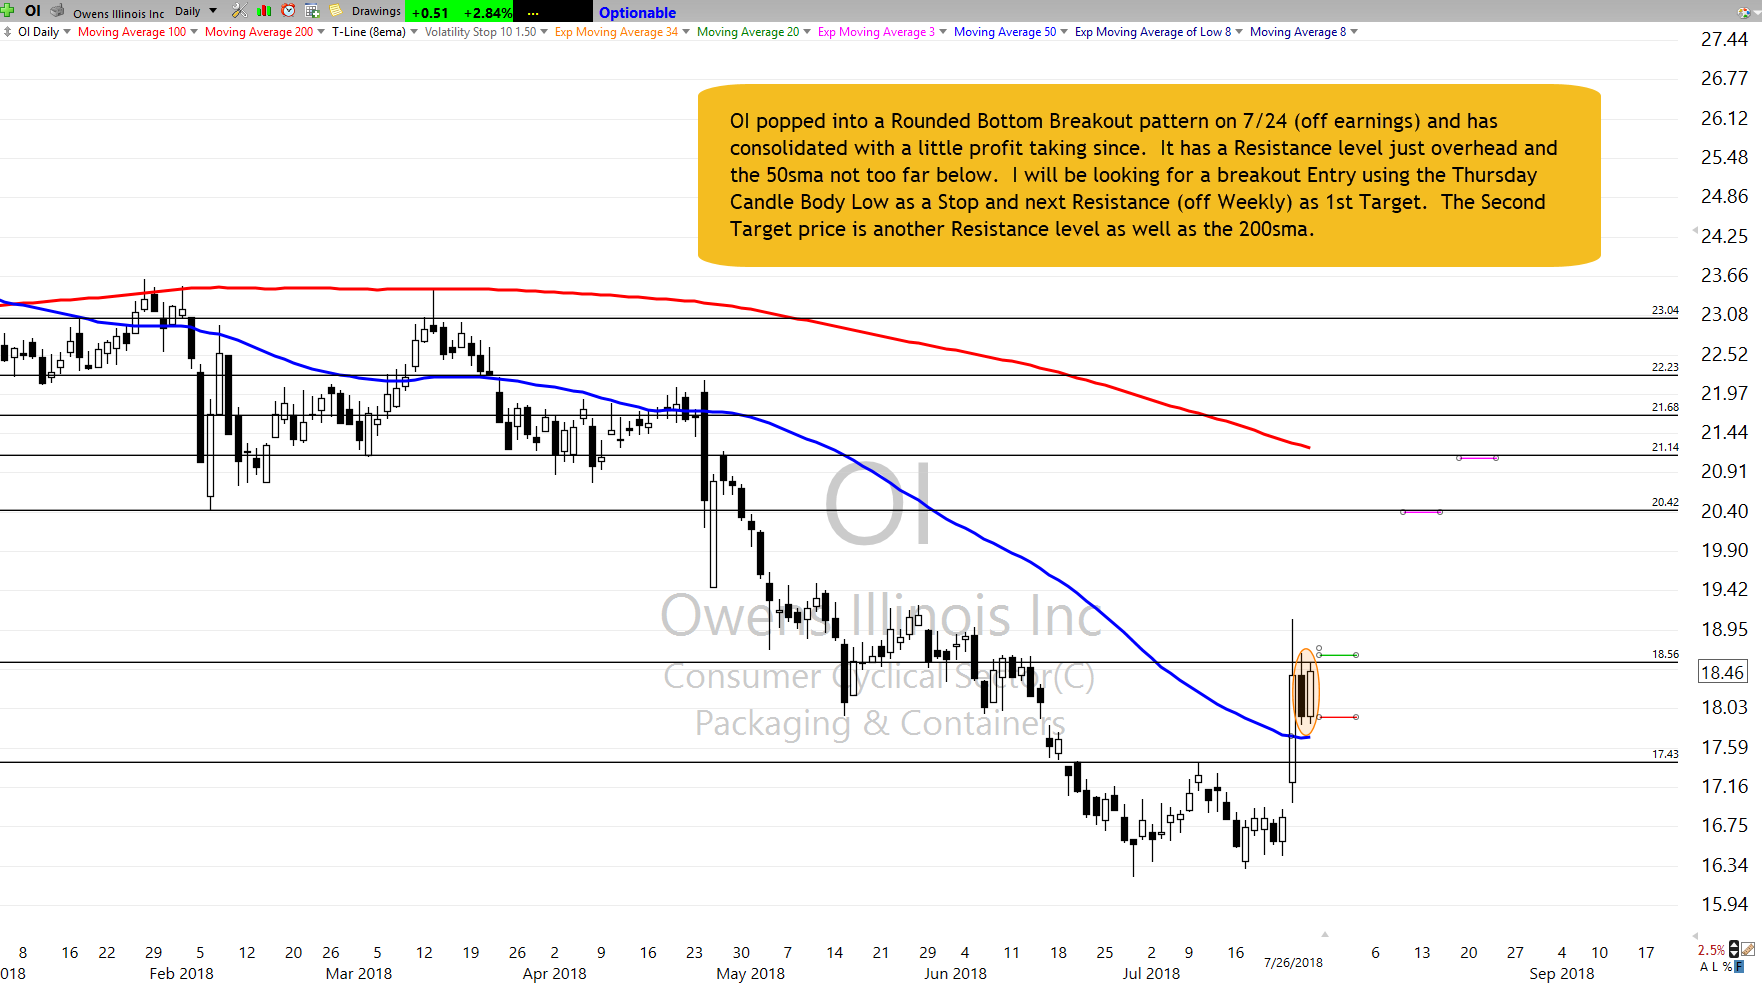
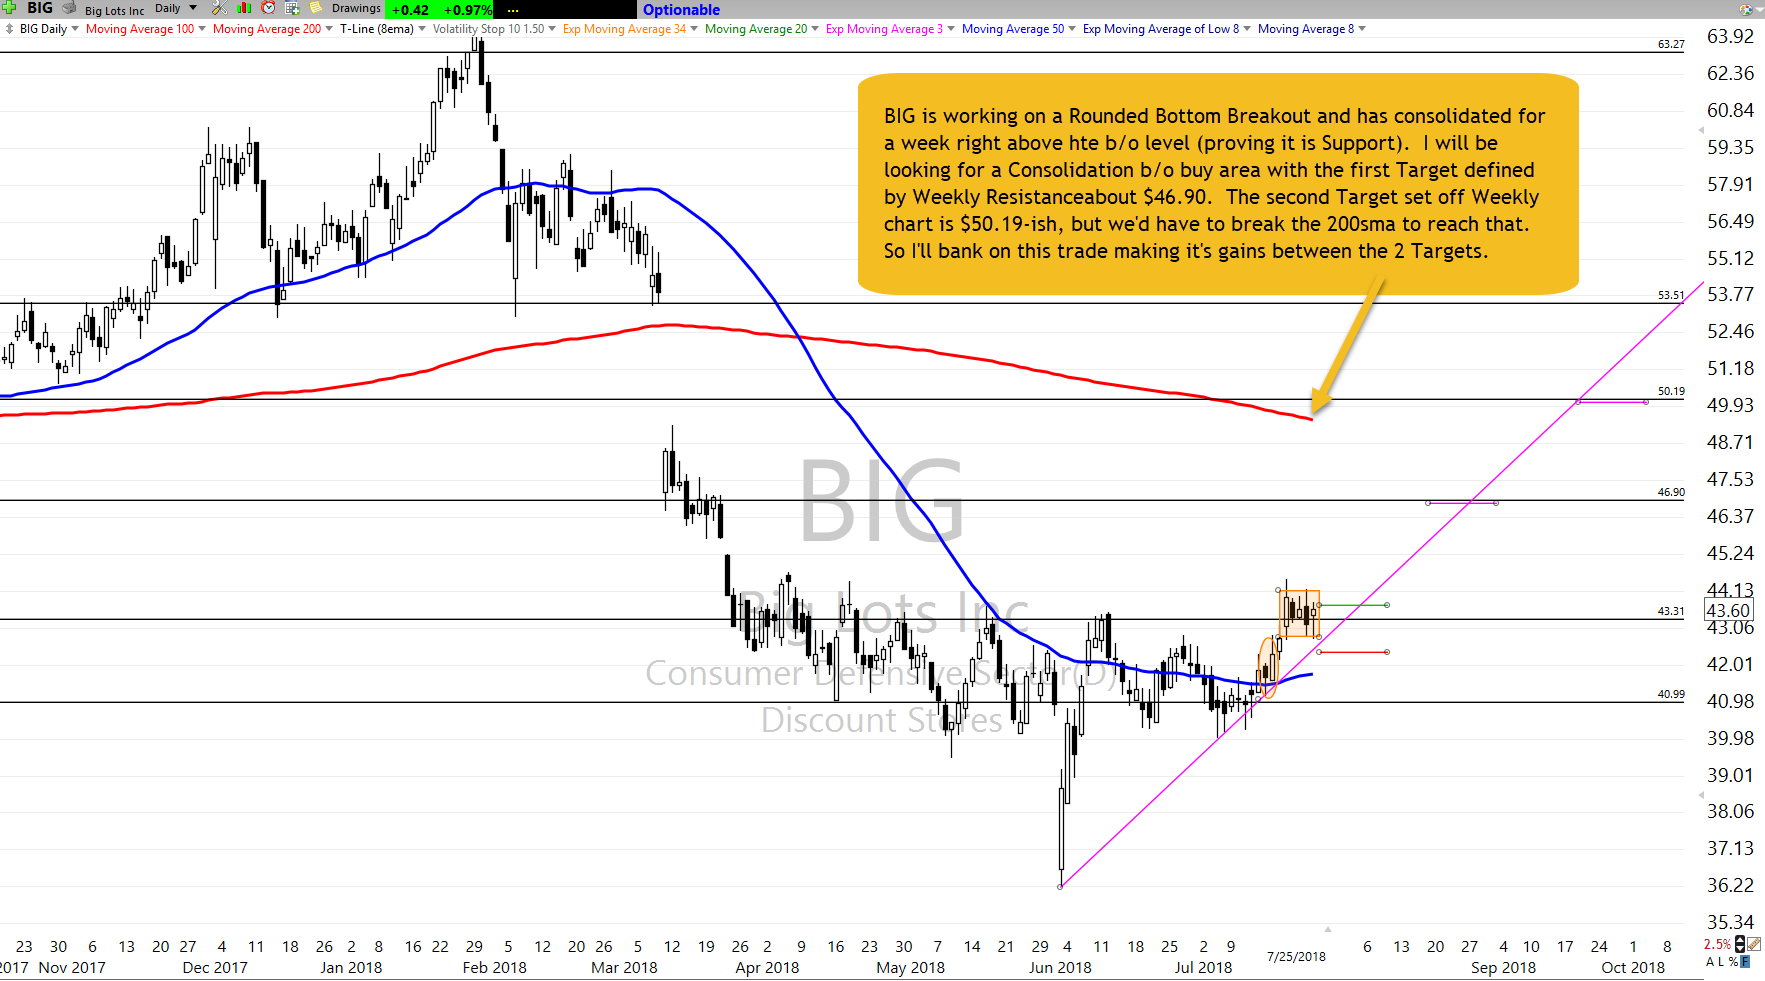
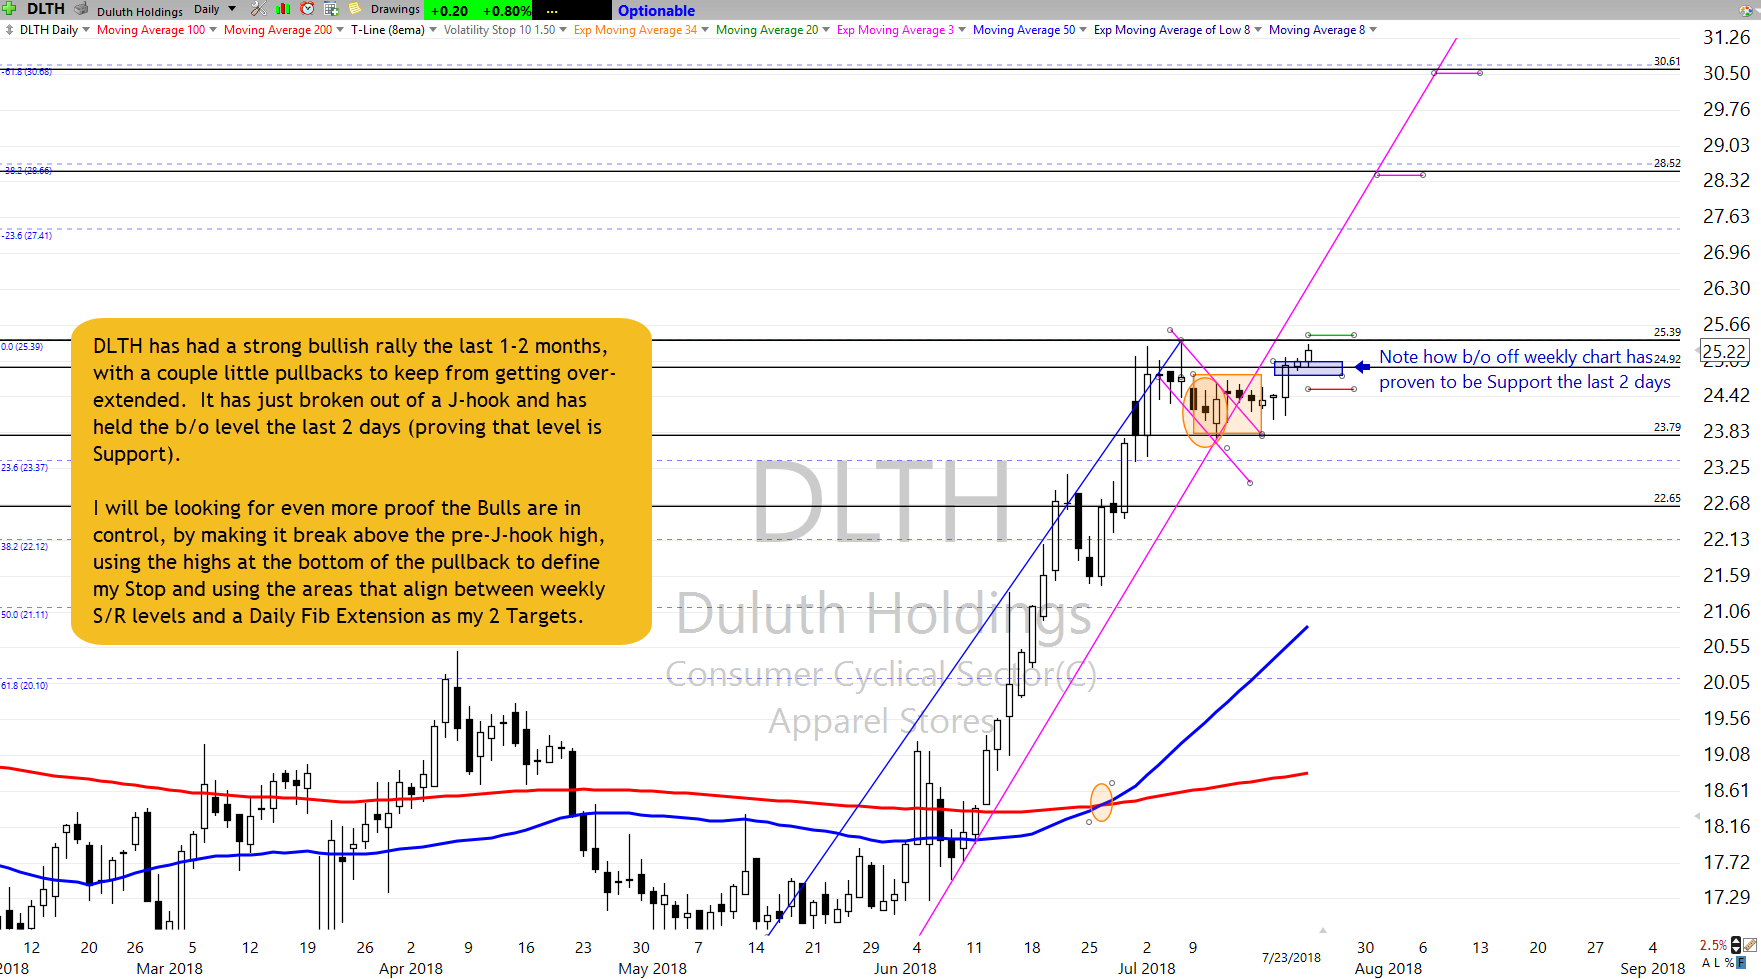
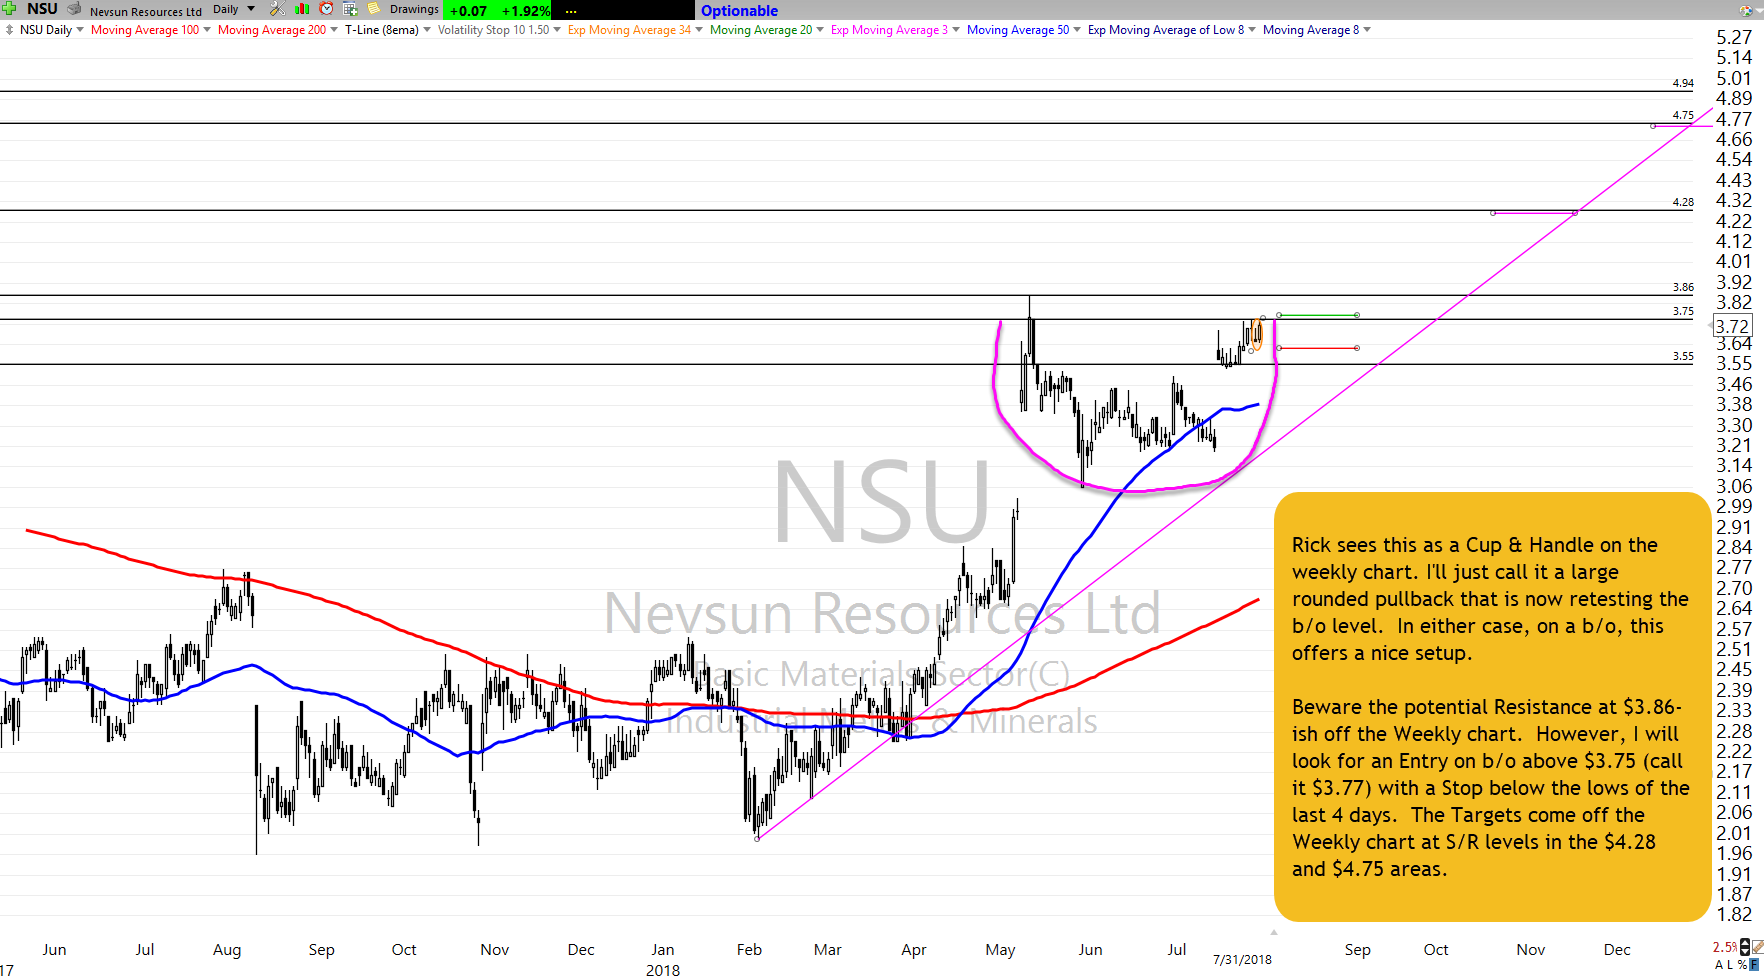
Rick sees NSU as a Cup & Handle on the weekly chart. I’ll just call it a large rounded pullback that is now retesting the b/o level. In either case, on a b/o, this offers a nice setup.  Just beware the potential Resistance at $3.86-ish off the Weekly chart. However, I will look for an Entry on b/o above $3.75 (call it $3.77) with a Stop below the lows of the last 4 days. The Targets come off the Weekly chart at S/R levels in the $4.28 and $4.75 areas.

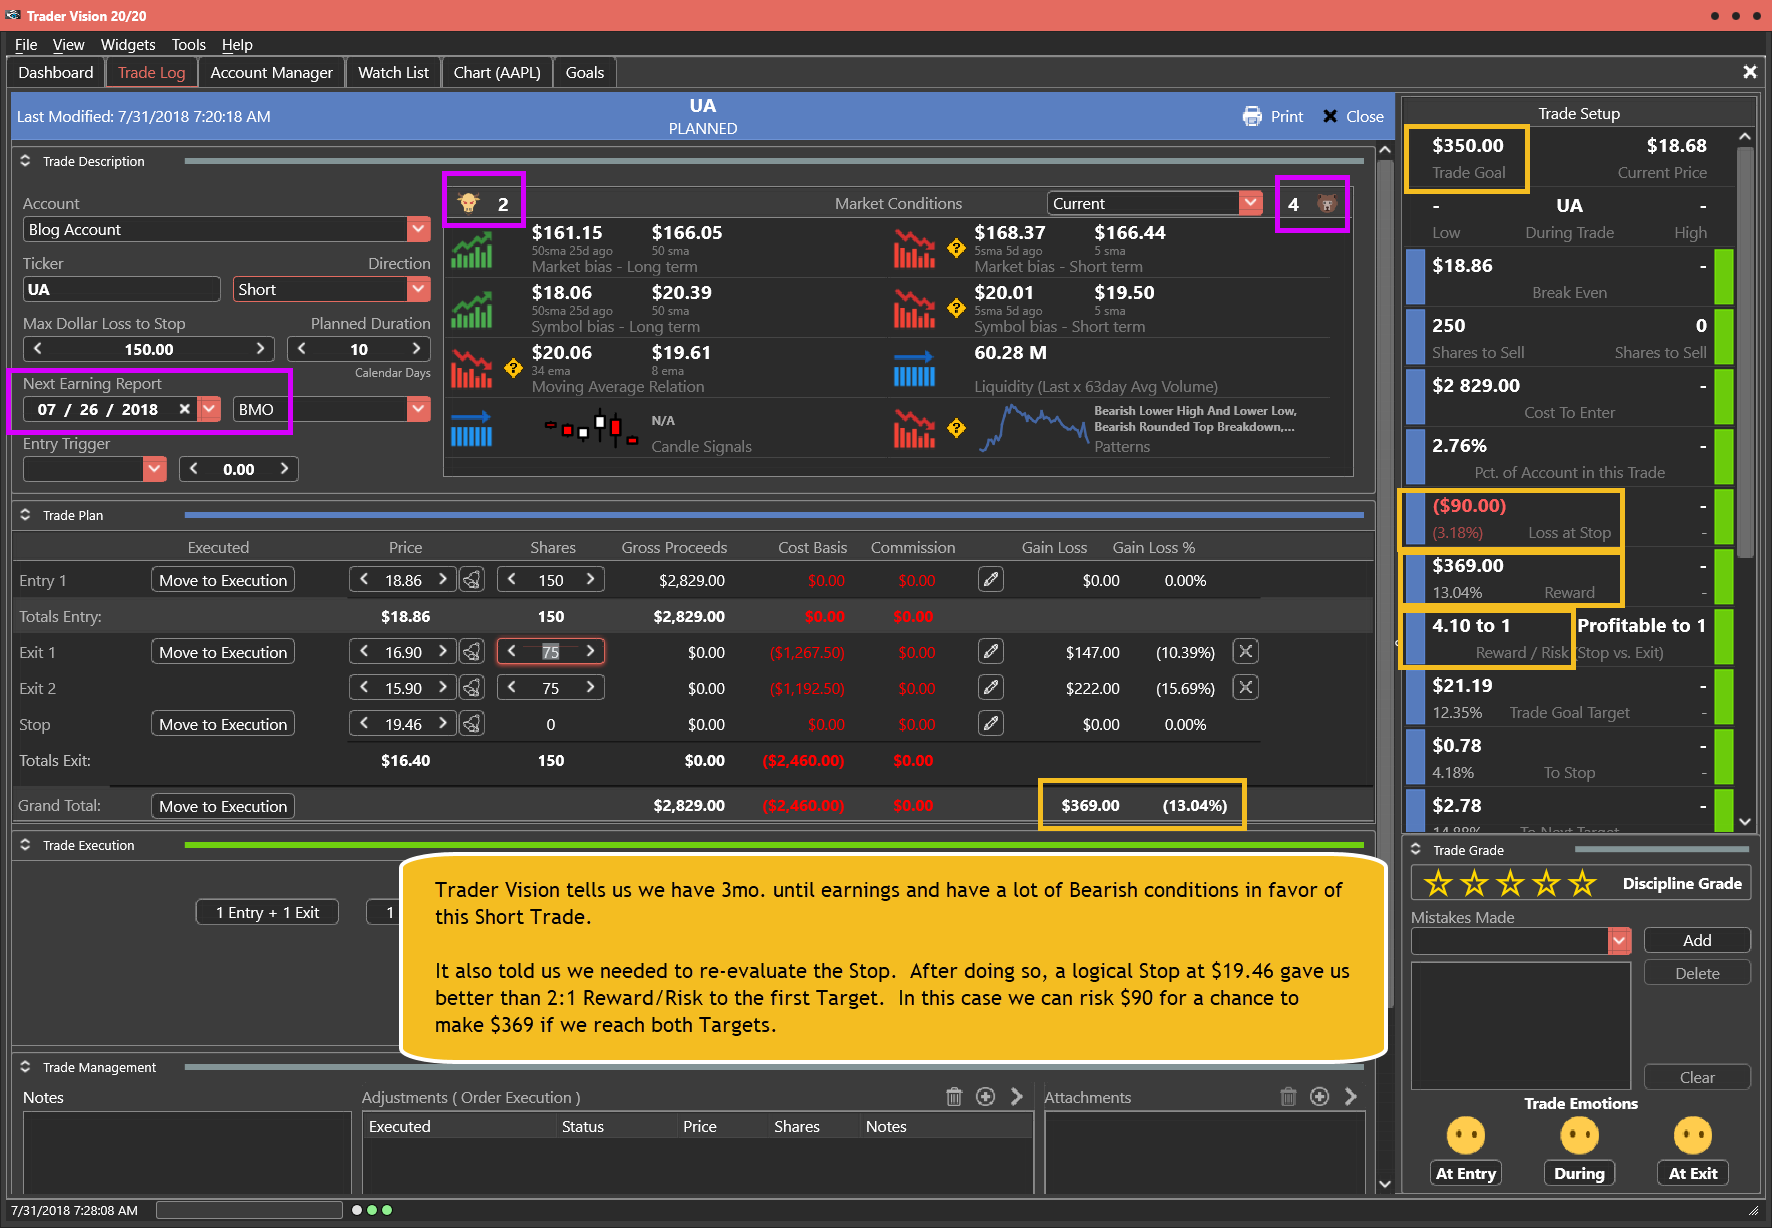
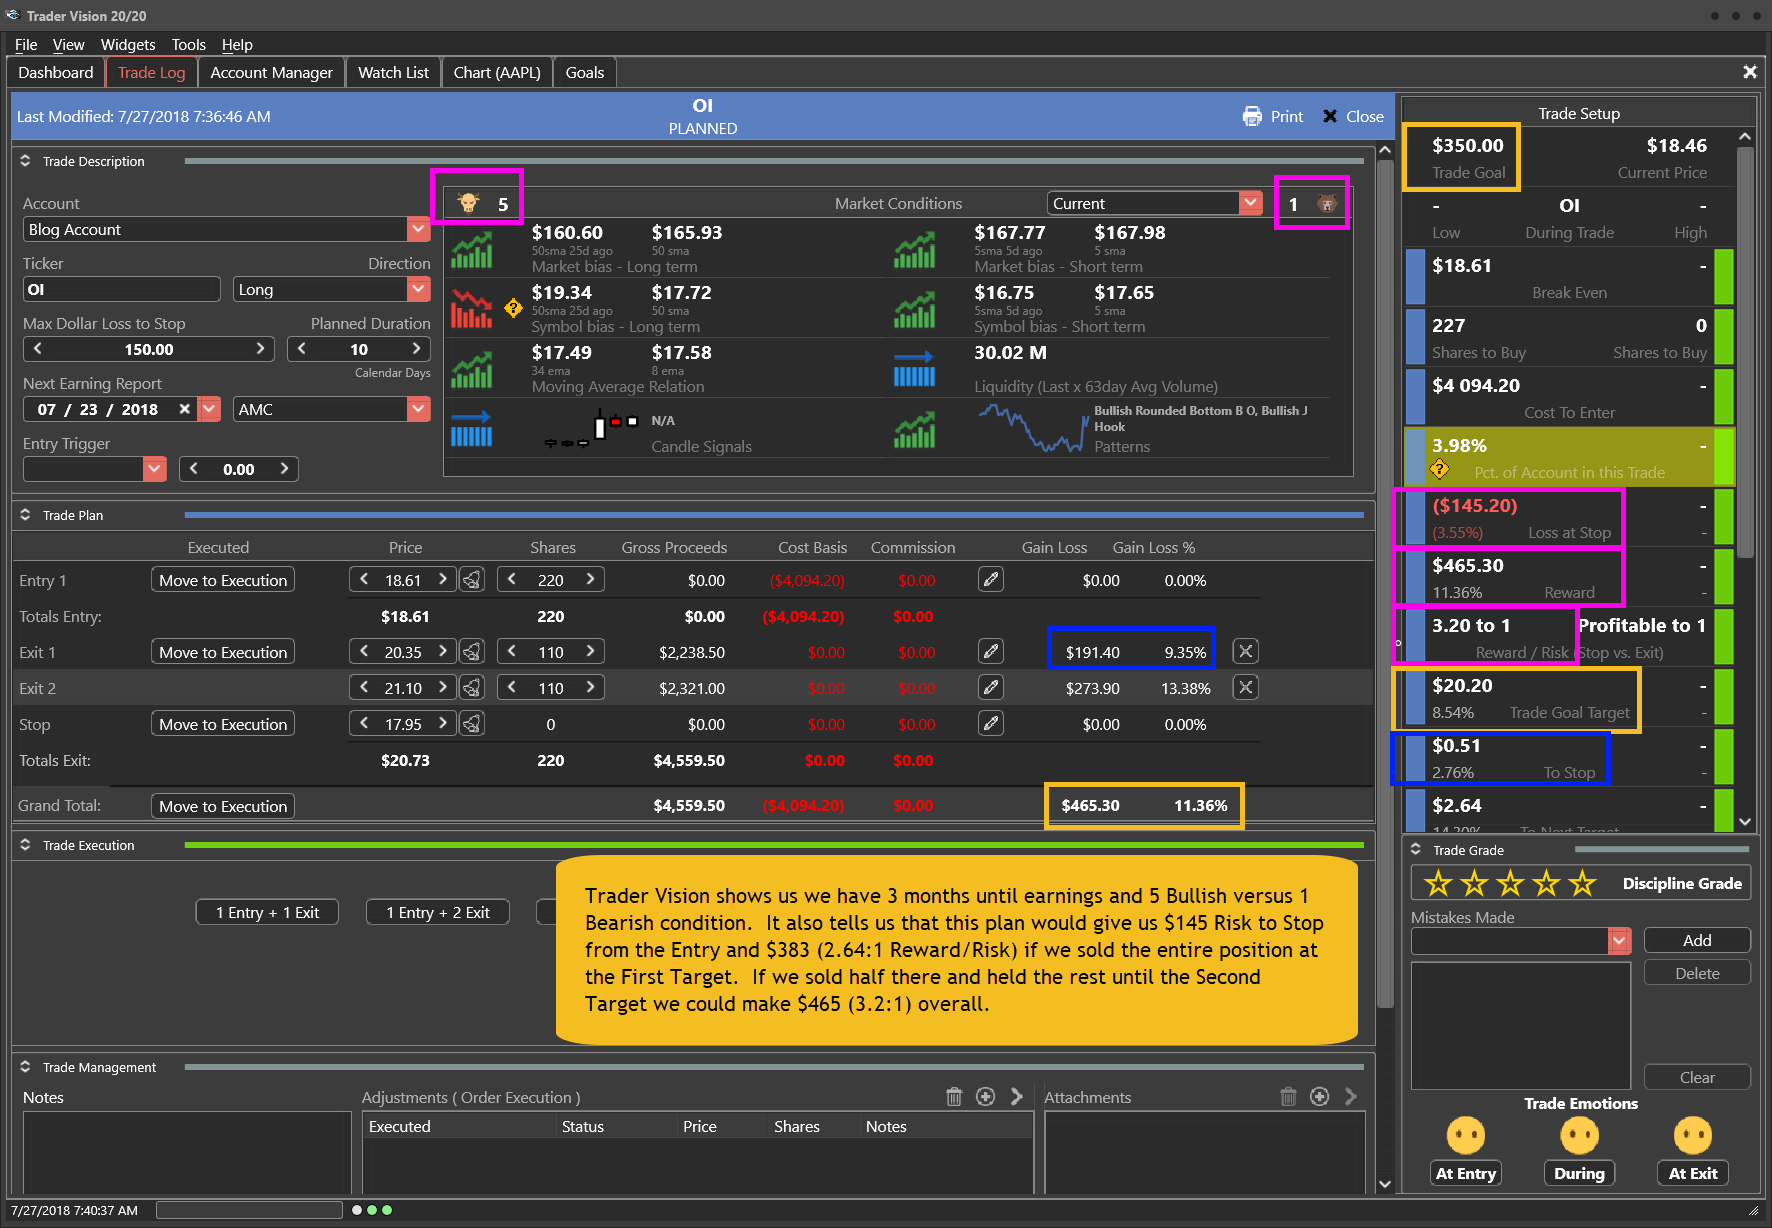
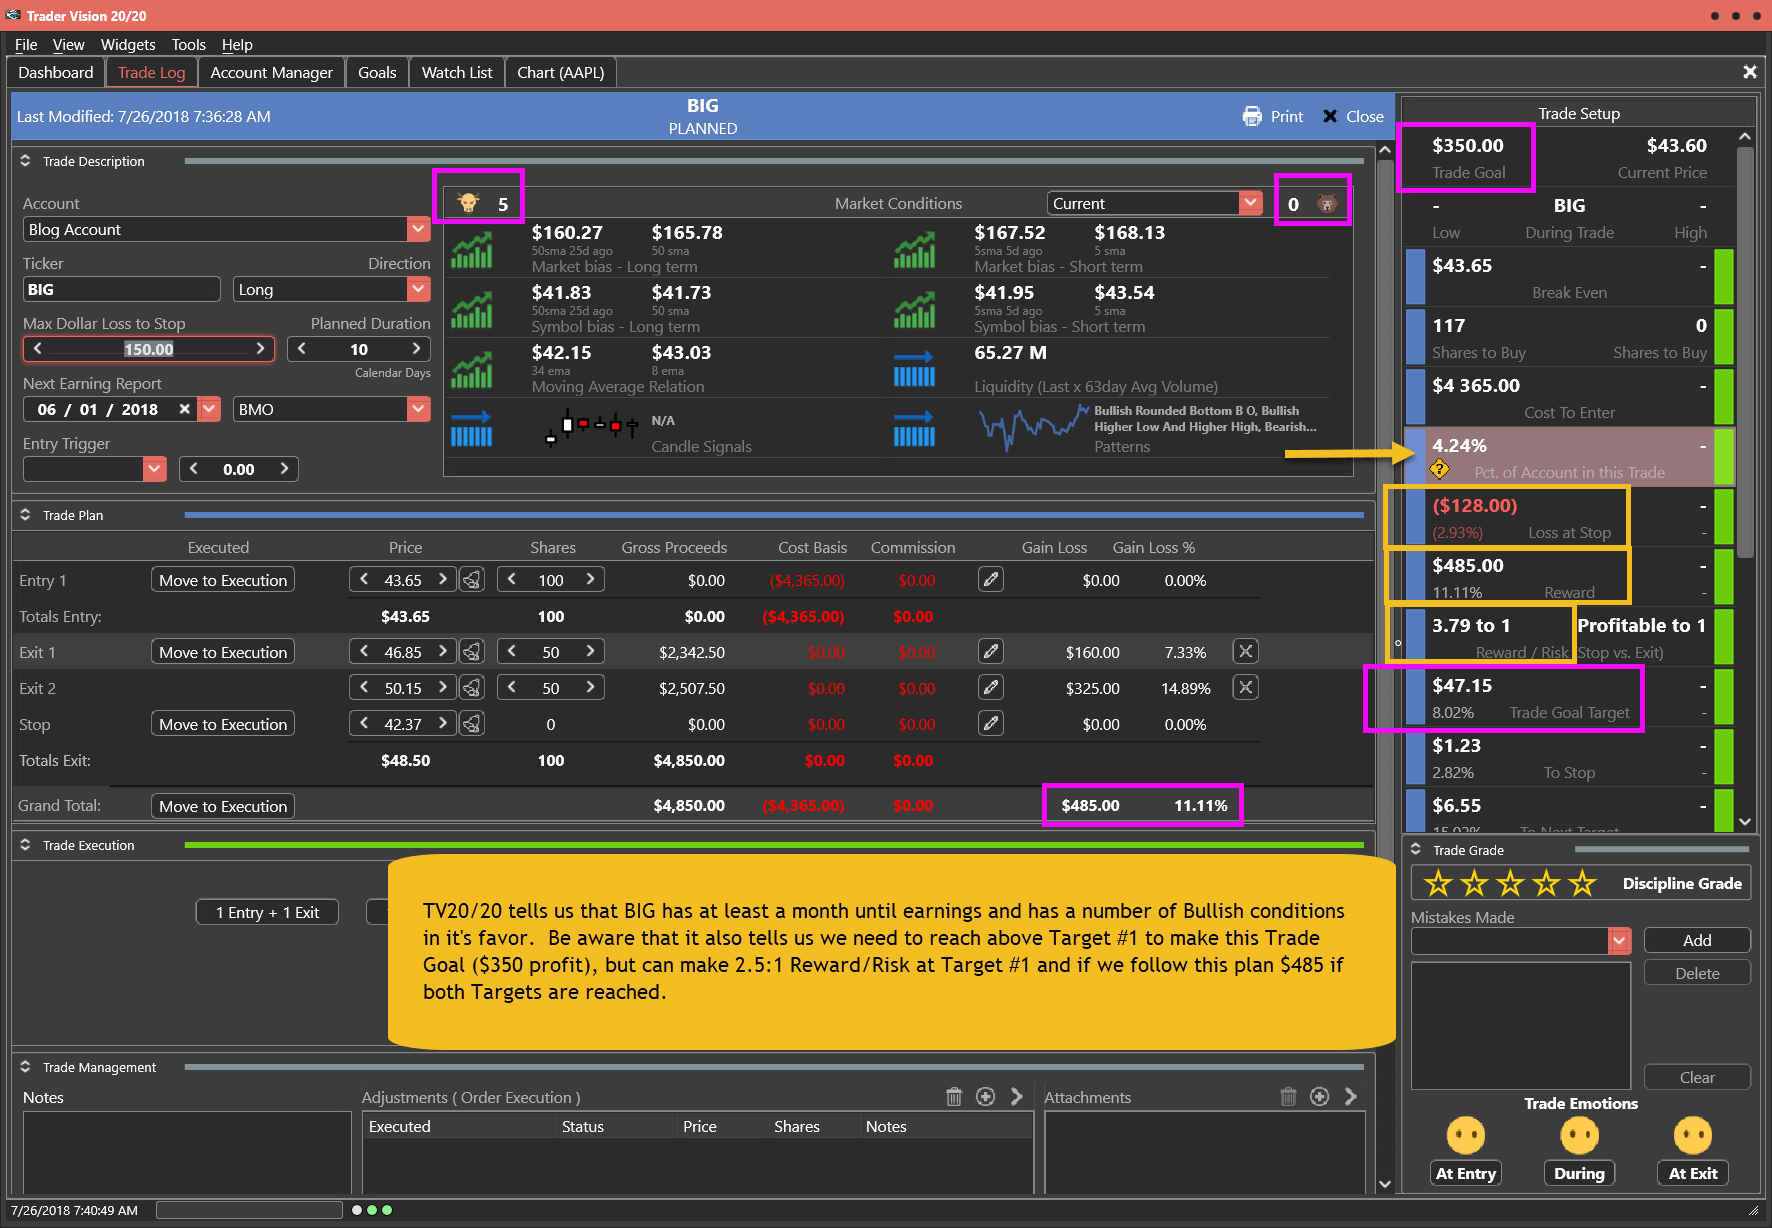
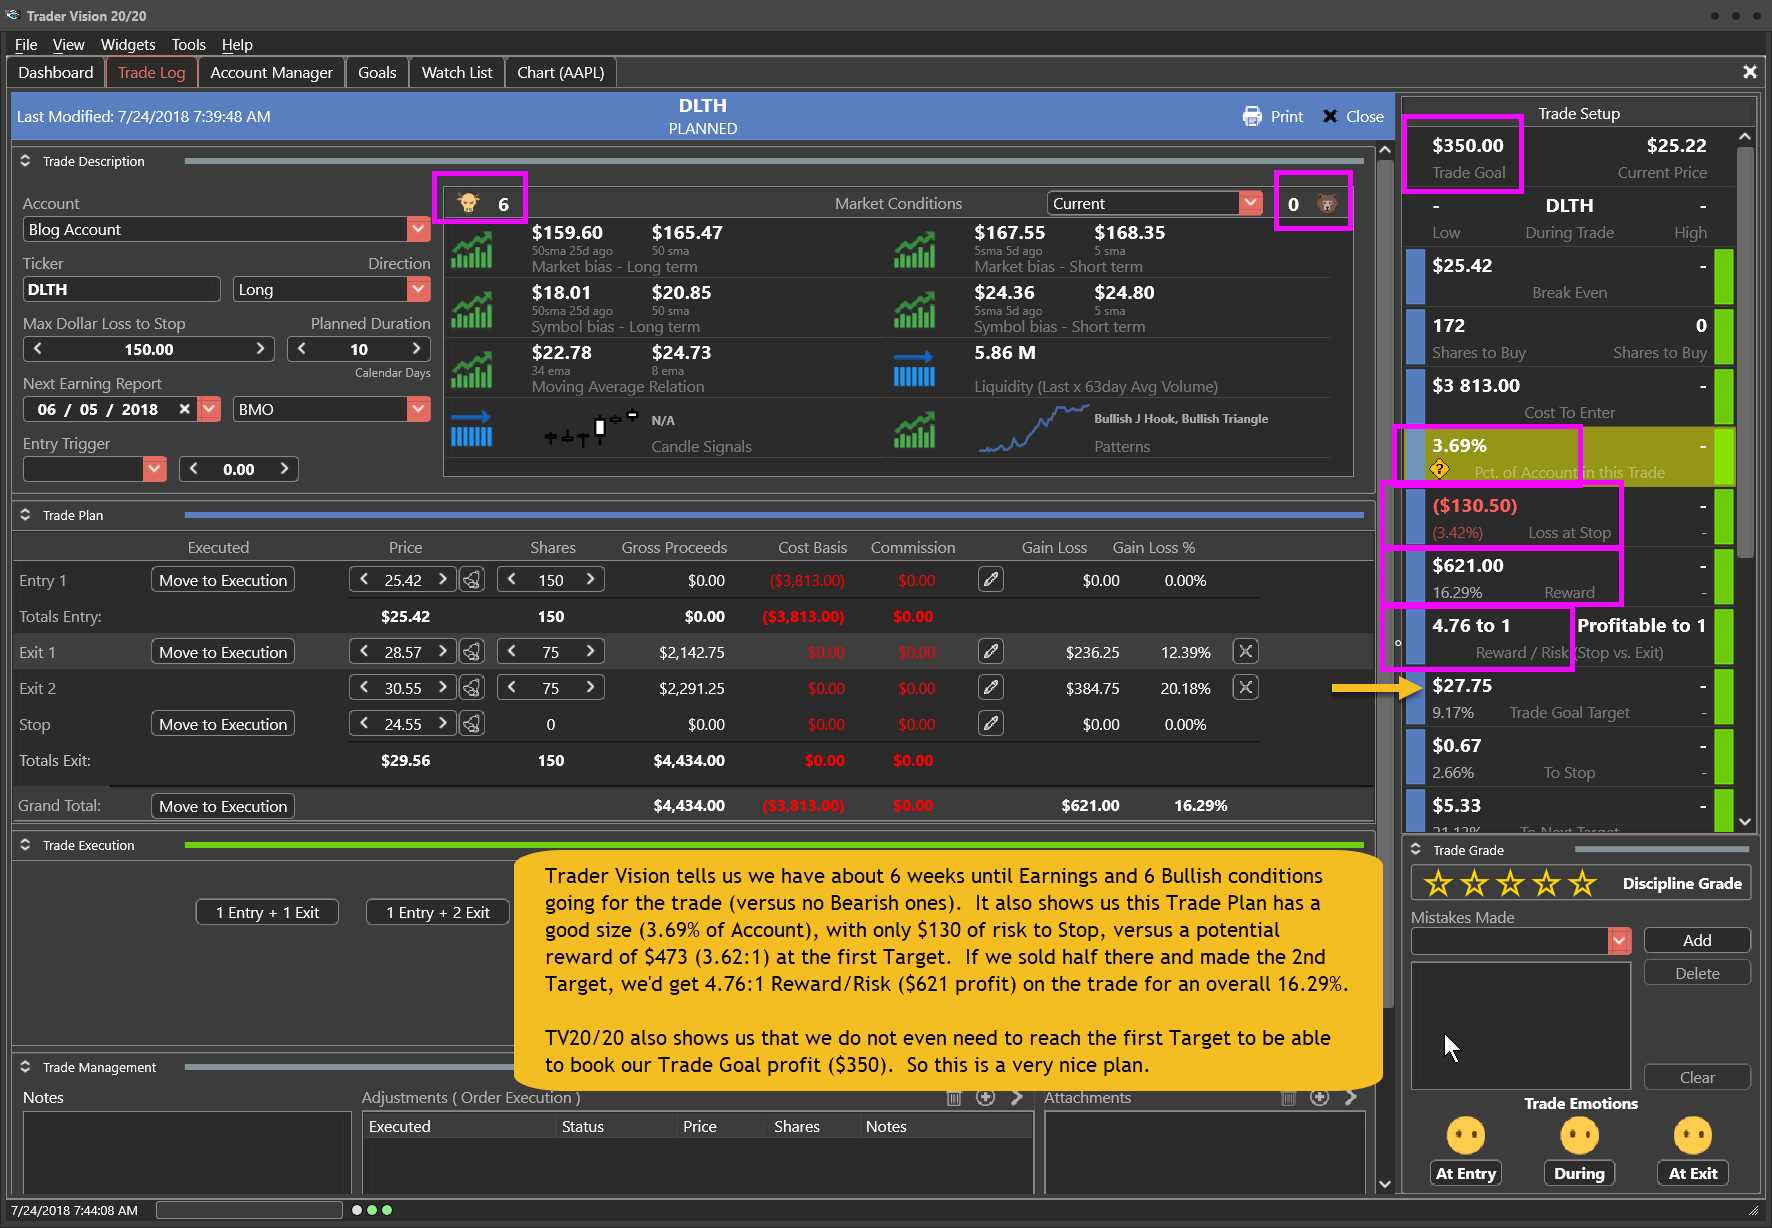
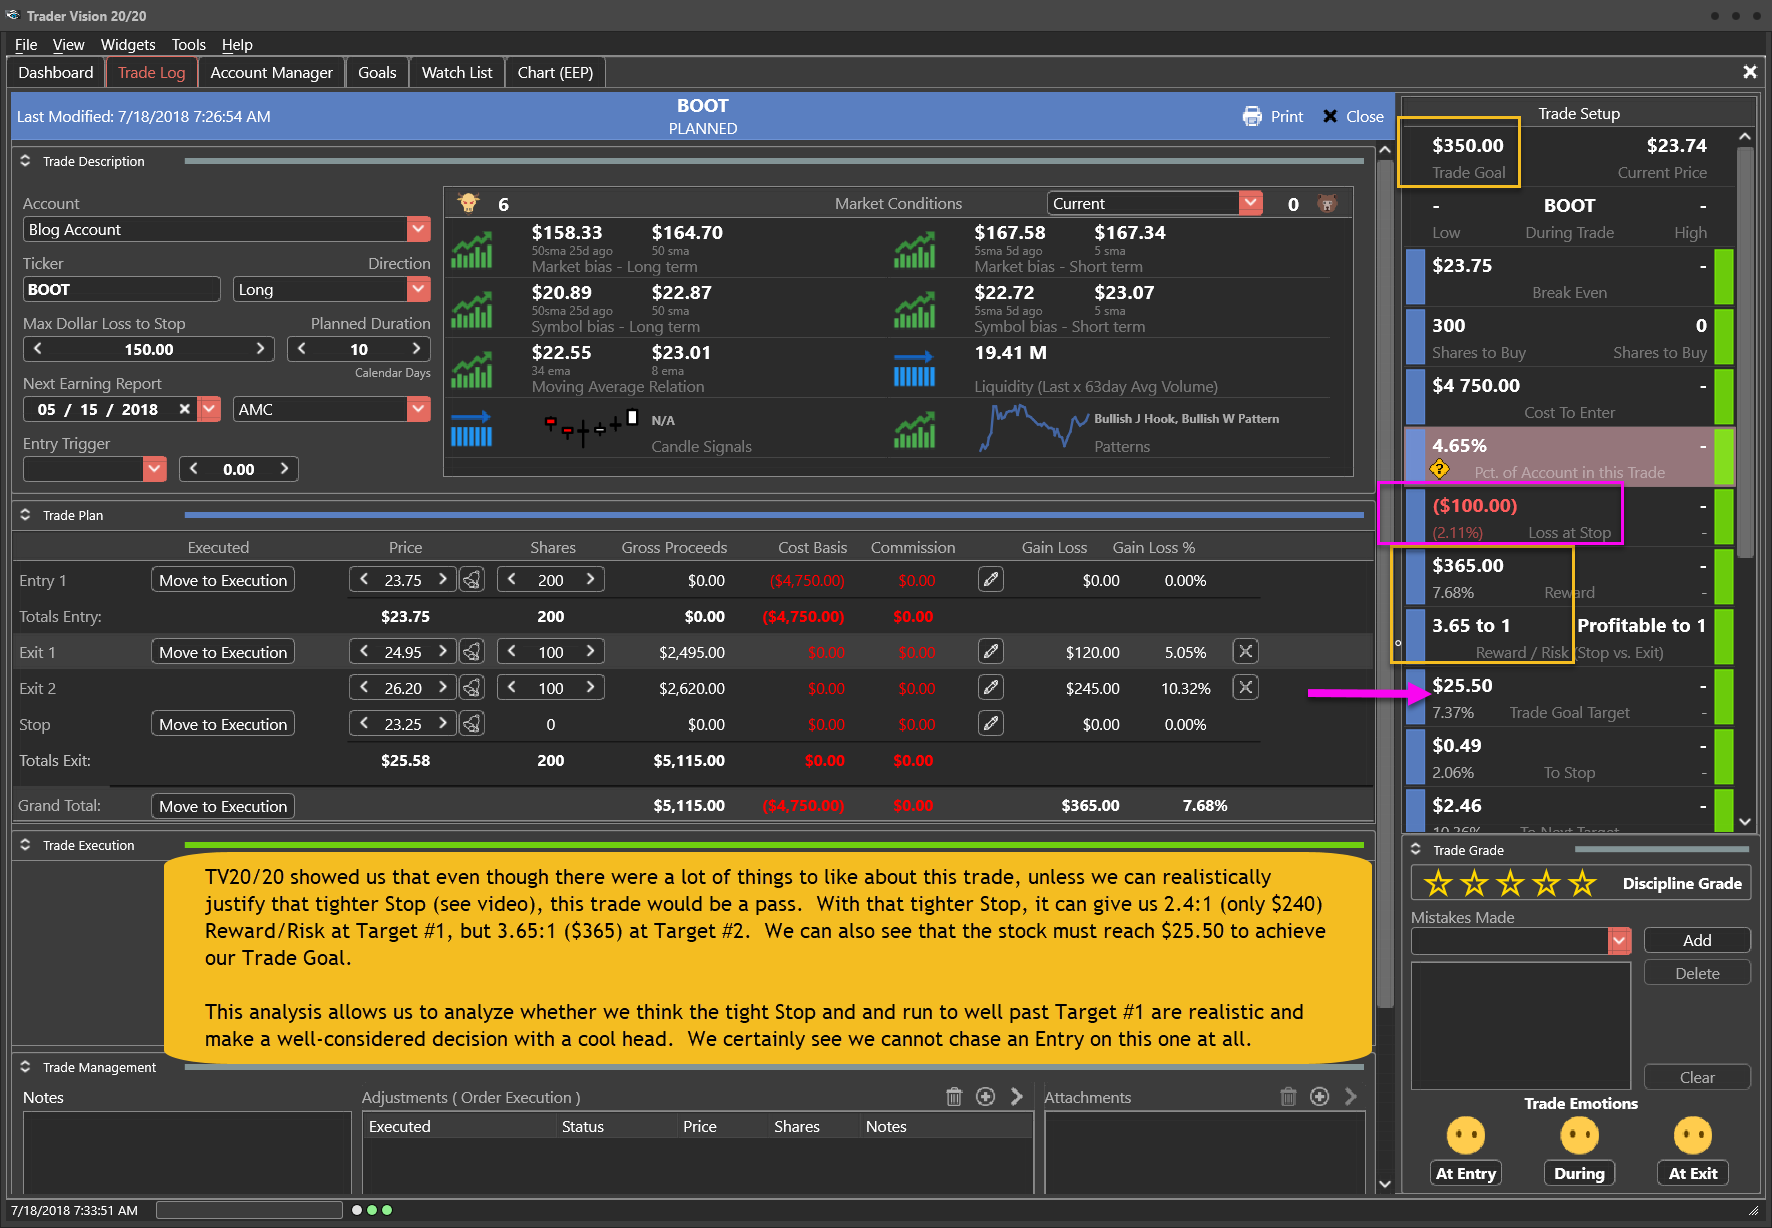
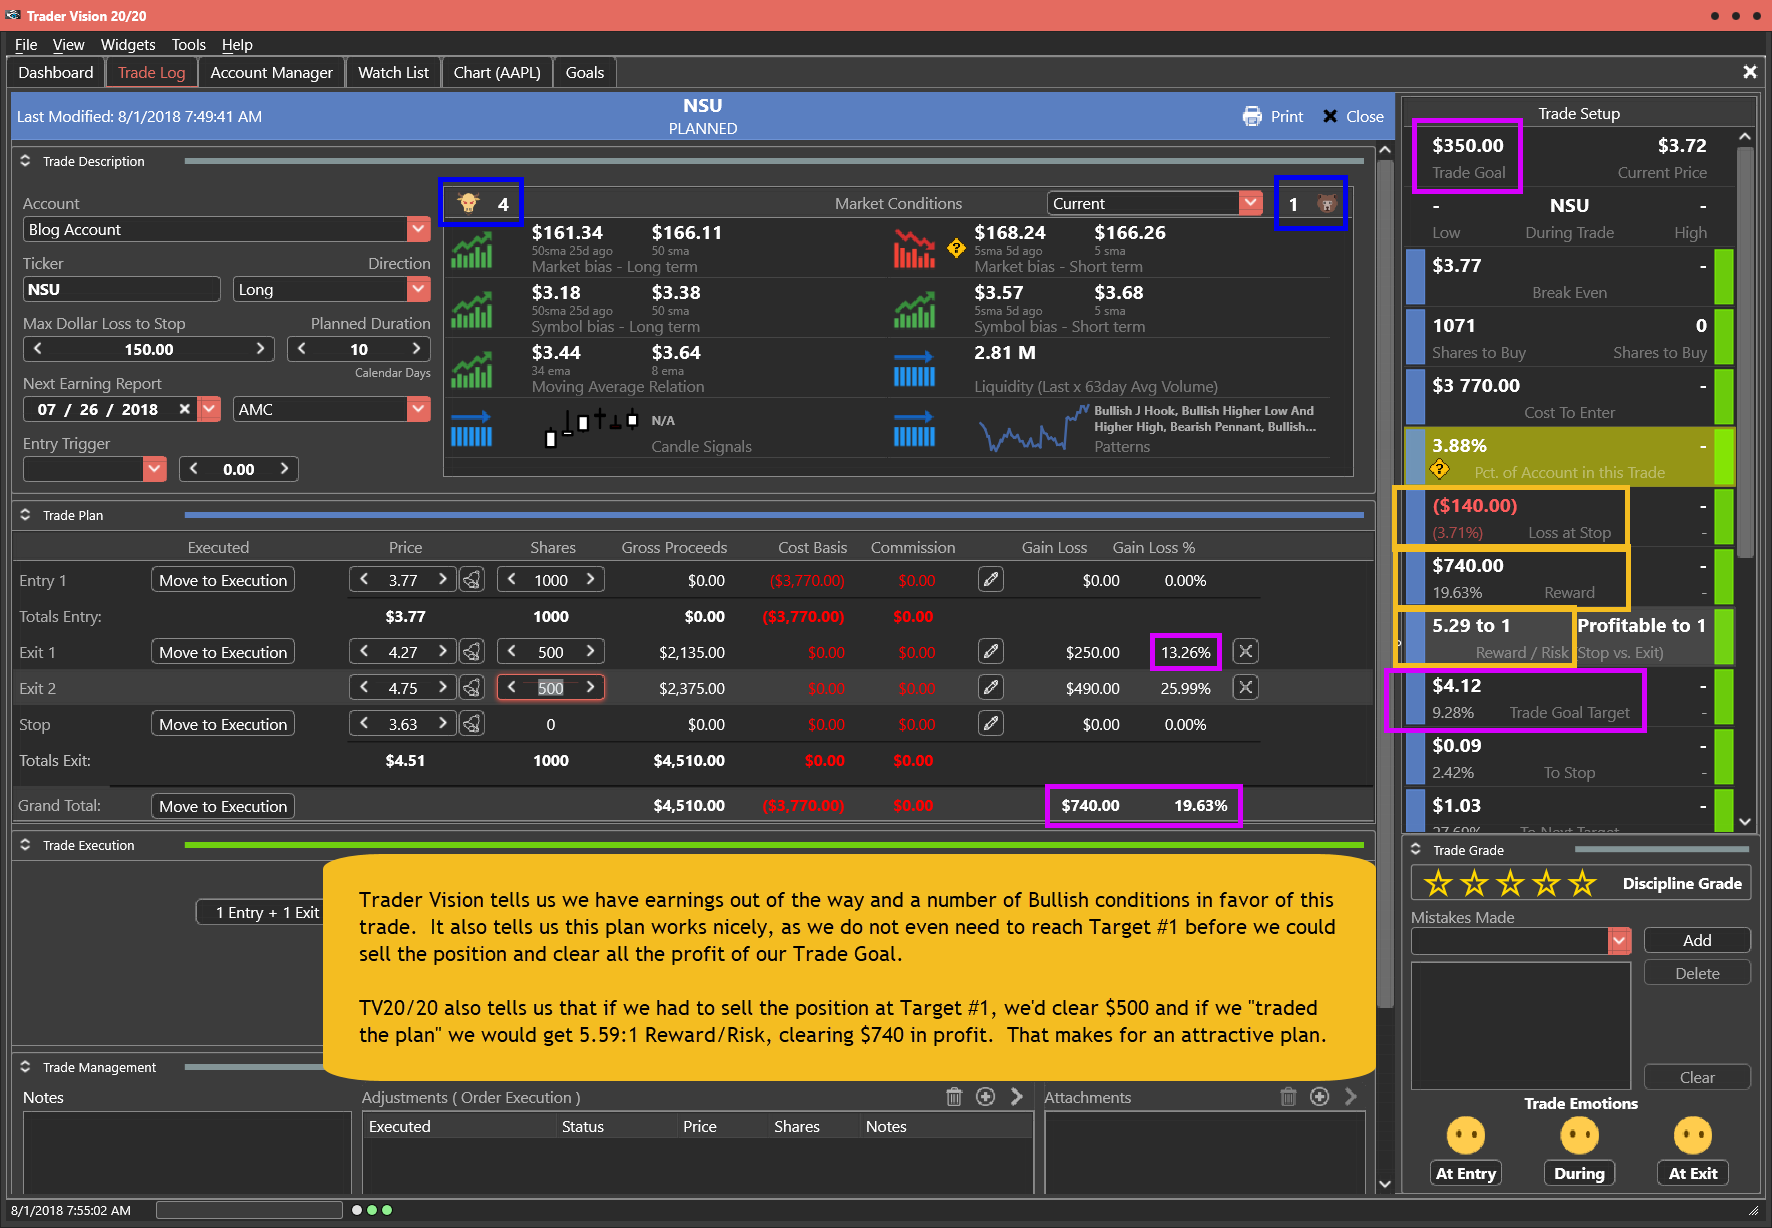
Trader Vision tells us we have earnings out of the way and a number of Bullish conditions in favor of this trade. It also tells us this plan works nicely, as we do not even need to reach Target #1 before we could sell the position and clear all the profit of our Trade Goal.  TV20/20 also tells us that if we had to sell the position at Target #1, we’d clear $500 and if we “traded the plan” we would get 5.59:1 Reward/Risk, clearing $740 in profit. That makes for an attractive plan.

Below is my markup of the chart and the trade plan as laid out by Trader Vision 20/20.  As a bonus, if you click the green button below, you’ll be able to watch a video of the chart markup and trade planning process.


The NSU Trade Setup – As of 7-31-18

NSU as of 7-31-18


The Trade Plan

NSU Trade Plan for 8-1-18


Note how Trader Vision 20/20 does so much of the work for you.  Knowing the ratio of Bullish Conditions to Bearish ones as well as the overall risk of the position size, risk to Stop out and the Reward possible at each Target price can help a great deal with controlling our emotions.  Knowing the dollar impact of every scenario ahead of time, allows us to make calm decisions during the trade.  It really takes the pressure off.  No guesswork.  No surprises.  No emotional roller coaster.

To see a short video of this trade’s chart markup and trade planning, click the button below.


Put the power to Trader Vision 20/20 to work for you…


Testimonial

Trader Vision immediately simplified the process…immediately it provided that information and guidance to me. I knew what I would risk for how much reward, I began taking trades off at the 1st target, 2nd target, I was no longer holding all my trades for the homerun. I also began implementing the stop losses if and when they were reached, not just hoping the stock would recover.  It then became easier to see what patterns were working for me and which were not.  It provided a much more relaxed and stress-free environment. –Joan G


***************************************************************************************************

Investing and Trading involve significant financial risk and are not suitable for everyone. Ed Carter is not a licensed financial adviser nor does he offer trade recommendations or investment advice to anyone. No communication from Hit and Run Candlesticks Inc. is to be considered financial or trading advice. All information is intended for Educational Purposes Only. Terms of Service.

***************************************************************************************************

UA Setup and Trade Plan

Before I forget, please join me for the Trader Vision 20/20 Weekly Workshop.

Wed. at 4:15 pm Eastern in Room #3 (no password needed)

http://hitandruncandlesticks.webinato.com/room3

 (This week, I will be providing a first look at our new Scanning tool…and how it will help you find the right trades.)


Today’s Featured Trade Idea is UA (short).

You can read more about this trade in Rick’s blog post here.  Members can also see his detailed review in the trading room at 9:10am Eastern.  For now, here is my analysis and a potential trade plan made using our Trader Vision 20/20 software.

UA has been trending down for over a month. On Monday, it broke down out of a “Dreaded h” pattern, confirming the “Blue Ice Failure” pattern from Friday an taking out the last Support level for awhile.  I will be looking for a Short Entry inside the lower half of Monday’s candle and expecting the trend to continue. The Stop will be above the area breached Friday (now potential Resistance).  Note that the 200sma should be near Target #2 by the time it is reached.

Trader Vision tells us we have 3mo. until earnings and have a lot of Bearish conditions in favor of this Short Trade.  It also told us we needed to re-evaluate the Stop. After doing so, a logical Stop at $19.46 gave us better than 2:1 Reward/Risk to the first Target. In this case, we can risk $90 for a chance to make $369 if we reach both Targets.

Below is my markup of the chart and the trade plan as laid out by Trader Vision 20/20.  As a bonus, if you click the green button below, you’ll be able to watch a video of the chart markup and trade planning process.


The UA Trade Setup – As of 7-30-18

UA as od 7-30-18


The Trade Plan

UA Trade Plan for 7-31-18


Note how Trader Vision 20/20 does so much of the work for you.  Knowing the ratio of Bullish Conditions to Bearish ones as well as the overall risk of the position size, risk to Stop out and the Reward possible at each Target price can help a great deal with controlling our emotions.  Knowing the dollar impact of every scenario ahead of time, allows us to make calm decisions during the trade.  It really takes the pressure off.  No guesswork.  No surprises.  No emotional roller coaster.

To see a short video of this trade’s chart markup and trade planning, click the button below.


Put the power to Trader Vision 20/20 to work for you…


Testimonial

Trader Vision immediately simplified the process…immediately it provided that information and guidance to me. I knew what I would risk for how much reward, I began taking trades off at the 1st target, 2nd target, I was no longer holding all my trades for the homerun. I also began implementing the stop losses if and when they were reached, not just hoping the stock would recover.  It then became easier to see what patterns were working for me and which were not.  It provided a much more relaxed and stress-free environment. –Joan G


***************************************************************************************************

Investing and Trading involve significant financial risk and are not suitable for everyone. Ed Carter is not a licensed financial adviser nor does he offer trade recommendations or investment advice to anyone. No communication from Hit and Run Candlesticks Inc. is to be considered financial or trading advice. All information is intended for Educational Purposes Only. Terms of Service.

***************************************************************************************************

AKRX Setup and Trade Plan

Today’s Featured Trade Idea is AKRX.

You can read more about this trade in Rick’s blog post here.  Members can also see his detailed review in the trading room at 9:10am Eastern.  For now, here is my analysis and a potential trade plan made using our Trader Vision 20/20 software.

AKRX printed a Trader’s Best Friend type signal Friday and is working on a Pullback Opportunity (PBO) pattern, inside a Rounded Bottom Breakout (RBB) pattern.  The Reward/Risk is not ideal to the J-hook breakout point, but if we can make it to the top of the gap-down candle body (2/27) we could have a nice trade.

Trader Vision tells us to check the earnings date! The last date we show was 3/1/17, but I find no better date elsewhere.  TV20/20 tells us we have a nice set of conditions, but as planned, that first Target does not offer a great Reward/Risk. However, if AKRX can reach the 2nd or 3rd Targets, this could be a nice trade in an otherwise terrible day for setups.

Below is my markup of the chart and the trade plan as laid out by Trader Vision 20/20.  As a bonus, if you click the green button below, you’ll be able to watch a video of the chart markup and trade planning process.


The AKRX Trade Setup – As of 7-27-18

AKRX as of 7-27-18


The Trade Plan

AKRX Trade Plan for 7-30-18


Note how Trader Vision 20/20 does so much of the work for you.  Knowing the ratio of Bullish Conditions to Bearish ones as well as the overall risk of the position size, risk to Stop out and the Reward possible at each Target price can help a great deal with controlling our emotions.  Knowing the dollar impact of every scenario ahead of time, allows us to make calm decisions during the trade.  It really takes the pressure off.  No guesswork.  No surprises.  No emotional roller coaster.

To see a short video of this trade’s chart markup and trade planning, click the button below.


Put the power to Trader Vision 20/20 to work for you…


Testimonial

Trader Vision immediately simplified the process…immediately it provided that information and guidance to me. I knew what I would risk for how much reward, I began taking trades off at the 1st target, 2nd target, I was no longer holding all my trades for the homerun. I also began implementing the stop losses if and when they were reached, not just hoping the stock would recover.  It then became easier to see what patterns were working for me and which were not.  It provided a much more relaxed and stress-free environment. –Joan G


***************************************************************************************************

Investing and Trading involve significant financial risk and are not suitable for everyone. Ed Carter is not a licensed financial adviser nor does he offer trade recommendations or investment advice to anyone. No communication from Hit and Run Candlesticks Inc. is to be considered financial or trading advice. All information is intended for Educational Purposes Only. Terms of Service.

***************************************************************************************************

OI Setup and Trade Plan

Today’s Featured Trade Idea is OI.

Members can also see his detailed review in the trading room at 9:10am Eastern.  For now, here is my analysis and a potential trade plan made using our Trader Vision 20/20 software.

OI popped into a Rounded Bottom Breakout pattern on 7/24 (off earnings) and has consolidated with a little profit taking since. It has a Resistance level just overhead and the 50sma not too far below. I will be looking for a breakout Entry using the Thursday Candle Body Low as a Stop and next Resistance (off Weekly) as 1st Target. The Second Target price is another Resistance level as well as the 200sma.

Trader Vision shows us we have 3 months until earnings and 5 Bullish versus 1 Bearish condition. It also tells us that this plan would give us $145 Risk to Stop from the Entry and $383 (2.64:1 Reward/Risk) if we sold the entire position at the First Target. If we sold half there and held the rest until the Second Target we could make $465 (3.2:1) overall.

Below is my markup of the chart and the trade plan as laid out by Trader Vision 20/20.  As a bonus, if you click the green button below, you’ll be able to watch a video of the chart markup and trade planning process.


The OI Trade Setup – As of 7-26-18

OI chart as of 7-26-18


The Trade Plan

OI Trade Plan for 7-27-18


Note how Trader Vision 20/20 does so much of the work for you.  Knowing the ratio of Bullish Conditions to Bearish ones as well as the overall risk of the position size, risk to Stop out and the Reward possible at each Target price can help a great deal with controlling our emotions.  Knowing the dollar impact of every scenario ahead of time, allows us to make calm decisions during the trade.  It really takes the pressure off.  No guesswork.  No surprises.  No emotional roller coaster.

To see a short video of this trade’s chart markup and trade planning, click the button below.


Put the power to Trader Vision 20/20 to work for you…


Testimonial

Trader Vision immediately simplified the process…immediately it provided that information and guidance to me. I knew what I would risk for how much reward, I began taking trades off at the 1st target, 2nd target, I was no longer holding all my trades for the homerun. I also began implementing the stop losses if and when they were reached, not just hoping the stock would recover.  It then became easier to see what patterns were working for me and which were not.  It provided a much more relaxed and stress-free environment. –Joan G


***************************************************************************************************

Investing and Trading involve significant financial risk and are not suitable for everyone. Ed Carter is not a licensed financial adviser nor does he offer trade recommendations or investment advice to anyone. No communication from Hit and Run Candlesticks Inc. is to be considered financial or trading advice. All information is intended for Educational Purposes Only. Terms of Service.

***************************************************************************************************

BIG Setup and Trade Plan

Today’s Featured Trade Idea is BIG.

You can read more about this trade in Rick’s blog post here.  Members can also see his detailed review in the trading room at 9:10am Eastern.  For now, here is my analysis and a potential trade plan made using our Trader Vision 20/20 software.

BIG is working on a Rounded Bottom Breakout and has consolidated for a week right above the b/o level (proving it is Support). I will be looking for a Consolidation b/o buy area with the first Target defined by Weekly Resistance about $46.90. The second Target set off Weekly chart is $50.19-ish, but we’d have to break the 200sma to reach that. So I’ll bank on this trade making its gains between the 2 Targets.

TV20/20 tells us that BIG has at least a month until earnings and has a number of Bullish conditions in its favor. Be aware that it also tells us we need to reach above Target #1 to make this Trade Goal ($350 profit), but can make 2.5:1 Reward/Risk at Target #1 and if we follow this plan $485 if both Targets are reached.

Below is my markup of the chart and the trade plan as laid out by Trader Vision 20/20.  As a bonus, if you click the green button below, you’ll be able to watch a video of the chart markup and trade planning process.


The BIG Trade Setup – As of 7-25-18

BIG as of  7-25-18


The Trade Plan

BIG Trade Plan for 7-26-18


Note how Trader Vision 20/20 does so much of the work for you.  Knowing the ratio of Bullish Conditions to Bearish ones as well as the overall risk of the position size, risk to Stop out and the Reward possible at each Target price can help a great deal with controlling our emotions.  Knowing the dollar impact of every scenario ahead of time, allows us to make calm decisions during the trade.  It really takes the pressure off.  No guesswork.  No surprises.  No emotional roller coaster.

To see a short video of this trade’s chart markup and trade planning, click the button below.


Put the power to Trader Vision 20/20 to work for you…


Testimonial

Trader Vision immediately simplified the process…immediately it provided that information and guidance to me. I knew what I would risk for how much reward, I began taking trades off at the 1st target, 2nd target, I was no longer holding all my trades for the homerun. I also began implementing the stop losses if and when they were reached, not just hoping the stock would recover.  It then became easier to see what patterns were working for me and which were not.  It provided a much more relaxed and stress-free environment. –Joan G


***************************************************************************************************

Investing and Trading involve significant financial risk and are not suitable for everyone. Ed Carter is not a licensed financial adviser nor does he offer trade recommendations or investment advice to anyone. No communication from Hit and Run Candlesticks Inc. is to be considered financial or trading advice. All information is intended for Educational Purposes Only. Terms of Service.

***************************************************************************************************

DLTH Setup and Trade Plan

Today’s Featured Trade Idea is DLTH.

You can read more about this trade in Rick’s blog post here.  Members can also see his detailed review in the trading room at 9:10am Eastern.  For now, here is my analysis and a potential trade plan made using our Trader Vision 20/20 software.

DLTH has had a strong bullish rally the last 1-2 months, with a couple little pullbacks to keep from getting over-extended. It has just broken out of a J-hook and has held the b/o level the last 2 days (proving that level is Support).  I will be looking for even more proof the Bulls are in control, by making it break above the pre-J-hook high, using the highs at the bottom of the pullback to define my Stop and using the areas that align between weekly S/R levels and a Daily Fib Extension as my 2 Targets.

Trader Vision tells us we have about 6 weeks until Earnings and 6 Bullish conditions going for the trade (versus no Bearish ones). It also shows us this Trade Plan has a good size (3.69% of Account), with only $130 of risk to Stop, versus a potential reward of $473 (3.62:1) at the first Target. If we sold half there and made the 2nd Target, we’d get 4.76:1 Reward/Risk ($621 profit) on the trade for an overall 16.29%.  TV20/20 also shows us that we do not even need to reach the first Target to be able to book our Trade Goal profit ($350). So this is a very nice plan.

Below is my markup of the chart and the trade plan as laid out by Trader Vision 20/20.  As a bonus, if you click the green button below, you’ll be able to watch a video of the chart markup and trade planning process.


The DLTH Trade Setup – As of 7-23-18

DLTH as of 7-23-18


The Trade Plan

DLTH Trade Plan 7-24-18


Note how Trader Vision 20/20 does so much of the work for you.  Knowing the ratio of Bullish Conditions to Bearish ones as well as the overall risk of the position size, risk to Stop out and the Reward possible at each Target price can help a great deal with controlling our emotions.  Knowing the dollar impact of every scenario ahead of time, allows us to make calm decisions during the trade.  It really takes the pressure off.  No guesswork.  No surprises.  No emotional roller coaster.

To see a short video of this trade’s chart markup and trade planning, click the button below.


Put the power to Trader Vision 20/20 to work for you…


Testimonial

Trader Vision immediately simplified the process…immediately it provided that information and guidance to me. I knew what I would risk for how much reward, I began taking trades off at the 1st target, 2nd target, I was no longer holding all my trades for the homerun. I also began implementing the stop losses if and when they were reached, not just hoping the stock would recover.  It then became easier to see what patterns were working for me and which were not.  It provided a much more relaxed and stress-free environment. –Joan G


***************************************************************************************************

Investing and Trading involve significant financial risk and are not suitable for everyone. Ed Carter is not a licensed financial adviser nor does he offer trade recommendations or investment advice to anyone. No communication from Hit and Run Candlesticks Inc. is to be considered financial or trading advice. All information is intended for Educational Purposes Only. Terms of Service.

***************************************************************************************************

TPB Setup and Trade Plan

Today’s Featured Trade Idea is TPB.

You can read more about this trade in Rick’s blog post here.  Members can also see his detailed review in the trading room at 9:10am Eastern.  For now, here is my analysis and a potential trade plan made using our Trader Vision 20/20 software.

TPB is sitting at an all-time high after just breaking out of a Triangle pattern on Friday. It has also printed a couple recent Morning Star signals, indicating the Bulls are still in control.  I will be looking for a breakout Entry using a Stop below the $32.20 Support level and Fib Extension Targets at the 38.2% and 61.8% levels. With 2.5 weeks until Earnings and no overhead resistance, TPB has a chance to make a little Bull run here.

TV20/20 tells us we should have 2.5 weeks until earnings and that the chart shows 5 Bullish conditions versus only the 1 Bearish. We can also see that we can reach our Trade Goal before even hitting the first Target price.  At that first Target, we’d be getting a 2.77:1 Reward/Risk on our $132 risk (to initial Stop) and if we were to follow the plan and reach Target #2, the overall trade would deliver 3.81:1 ($503.50). This seems like a pretty nice setup, all things considered.

Below is my markup of the chart and the trade plan as laid out by Trader Vision 20/20.  As a bonus, if you click the green button below, you’ll be able to watch a video of the chart markup and trade planning process.


The TPB Trade Setup – As of 7-20-18

TPB as of 7-20-18


The Trade Plan

TPB Trade Plan for 7-23-18


Note how Trader Vision 20/20 does so much of the work for you.  Knowing the ratio of Bullish Conditions to Bearish ones as well as the overall risk of the position size, risk to Stop out and the Reward possible at each Target price can help a great deal with controlling our emotions.  Knowing the dollar impact of every scenario ahead of time, allows us to make calm decisions during the trade.  It really takes the pressure off.  No guesswork.  No surprises.  No emotional roller coaster.

To see a short video of this trade’s chart markup and trade planning, click the button below.


Put the power to Trader Vision 20/20 to work for you…


Testimonial

Trader Vision immediately simplified the process…immediately it provided that information and guidance to me. I knew what I would risk for how much reward, I began taking trades off at the 1st target, 2nd target, I was no longer holding all my trades for the homerun. I also began implementing the stop losses if and when they were reached, not just hoping the stock would recover.  It then became easier to see what patterns were working for me and which were not.  It provided a much more relaxed and stress-free environment. –Joan G


***************************************************************************************************

Investing and Trading involve significant financial risk and are not suitable for everyone. Ed Carter is not a licensed financial adviser nor does he offer trade recommendations or investment advice to anyone. No communication from Hit and Run Candlesticks Inc. is to be considered financial or trading advice. All information is intended for Educational Purposes Only. Terms of Service.

***************************************************************************************************

Trade Follow-up for 7-20-18

No Featured Trade Idea on Friday.  Instead we have a follow-up on the performance of this blog’s trade ideas.

You can read more about the market in Rick’s blog post here.  Members can also see his detailed review in the trading room at 9:10am Eastern.  For now, here is my analysis and a potential trade plan made using our Trader Vision 20/20 software.

Below are the Trader Vision 20/20 Dashboard and Trade Log as of 7-19-18.  As a bonus, if you click the green button below, you’ll be able to watch a video of my review of Open, Closed and Unexecuted trades over the last week.


Blog Trade Performance – As of 7-19-18 (Pre-Market 7-20)

Account Follow-up 7-20-18 Trade Log as of 7-19-18


Note how Trader Vision 20/20 does so much of the work for you.  Knowing the ratio of Bullish Conditions to Bearish ones as well as the overall risk of the position size, risk to Stop out and the Reward possible at each Target price can help a great deal with controlling our emotions.  Knowing the dollar impact of every scenario ahead of time, allows us to make calm decisions during the trade.  It really takes the pressure off.  No guesswork.  No surprises.  No emotional roller coaster.

To see a short video of this trade’s chart markup and trade planning, click the button below.


Put the power to Trader Vision 20/20 to work for you…


Testimonial

Trader Vision immediately simplified the process…immediately it provided that information and guidance to me. I knew what I would risk for how much reward, I began taking trades off at the 1st target, 2nd target, I was no longer holding all my trades for the homerun. I also began implementing the stop losses if and when they were reached, not just hoping the stock would recover.  It then became easier to see what patterns were working for me and which were not.  It provided a much more relaxed and stress-free environment. –Joan G


***************************************************************************************************

Investing and Trading involve significant financial risk and are not suitable for everyone. Ed Carter is not a licensed financial adviser nor does he offer trade recommendations or investment advice to anyone. No communication from Hit and Run Candlesticks Inc. is to be considered financial or trading advice. All information is intended for Educational Purposes Only. Terms of Service.

***************************************************************************************************

MDCA Setup and Trade Plan

Today’s Featured Trade Idea is MDCA.

You can read more about this trade in Rick’s blog post here.  Members can also see his detailed review in the trading room at 9:10am Eastern.  For now, here is my analysis and a potential trade plan made using our Trader Vision 20/20 software.

MDCA has bottomed and begun an uptrend over the last 2 months. It recently broke into a Rounded Bottom Breakout pattern. In the last week it has pulled back after a nice run-up and printed a Hammer and Bullish Engulfing signal the last 2 days.  I will be looking for a b/o Entry above recent resistance with a clear Target up where the 38.2% Fib Ext. and both Daily and Weekly S/R levels align (about $6.60). The second Target will be a bit higher at the 61.8% and Weekly resistance level (about $7).

TV20/20 tells us we have roughly 2.5 weeks until earnings on MDCA and have several factors in our favor. This plan allows us to take a relatively small position (2.23% of Account), risking $152 to the Stop and still gives the potential of 2.24:1 ($340) or 2.76:1 ($420) Reward/Risk at Targets #1 and #2 respectively. We can also see we can achieve the Trade Goal just 3 cents above Target #1.

Below is my markup of the chart and the trade plan as laid out by Trader Vision 20/20.  As a bonus, if you click the green button below, you’ll be able to watch a video of the chart markup and trade planning process.


The MDCA Trade Setup – As of 7-18-18

MDCA as of 7-18-19


The Trade Plan

MDCA Trade Plan for 7-19-18


Note how Trader Vision 20/20 does so much of the work for you.  Knowing the ratio of Bullish Conditions to Bearish ones as well as the overall risk of the position size, risk to Stop out and the Reward possible at each Target price can help a great deal with controlling our emotions.  Knowing the dollar impact of every scenario ahead of time, allows us to make calm decisions during the trade.  It really takes the pressure off.  No guesswork.  No surprises.  No emotional roller coaster.

To see a short video of this trade’s chart markup and trade planning, click the button below.


Put the power to Trader Vision 20/20 to work for you…


Testimonial

Trader Vision immediately simplified the process…immediately it provided that information and guidance to me. I knew what I would risk for how much reward, I began taking trades off at the 1st target, 2nd target, I was no longer holding all my trades for the homerun. I also began implementing the stop losses if and when they were reached, not just hoping the stock would recover.  It then became easier to see what patterns were working for me and which were not.  It provided a much more relaxed and stress-free environment. –Joan G


***************************************************************************************************

Investing and Trading involve significant financial risk and are not suitable for everyone. Ed Carter is not a licensed financial adviser nor does he offer trade recommendations or investment advice to anyone. No communication from Hit and Run Candlesticks Inc. is to be considered financial or trading advice. All information is intended for Educational Purposes Only. Terms of Service.

***************************************************************************************************

BOOT Setup and Trade Plan

Today’s Featured Trade Idea is BOOT.  This idea shows the power of Trader Vision 20/20 to inform our trade selection/validation.  Don’t take this trade until you’ve watched the video!

You can read more about this trade in Rick’s blog post here.  Members can also see his detailed review in the trading room at 9:10am Eastern.  For now, here is my analysis and a potential trade plan made using our Trader Vision 20/20 software.

BOOT broke the recent downtrend by putting in a nice J-hook that broke up through and held the 50sma. It printed a Trader’s Best Friend signal yesterday.  However, when laying out the trade in TV20/20, we see that we cannot get the 2:1 I require at Target #1 without drawing that pink line and believing that support will be enough to warrant a tighter Stop. If you can see that, this trade lays out nice with Fibs and Weekly S/R levels aligning well.

TV20/20 showed us that even though there were a lot of things to like about this trade, unless we can really justify that tighter Stop (see video), this trade would be a pass. With that tighter Stop, it can give us 2.4:1 (only $240) Reward/Risk at Target #1, but 3.65:1 ($365) at Target #2. We can also see that the stock must reach $25.50 to achieve our Trade Goal.  This analysis allows us to analyze whether we think the tight Stop and run to well past Target #1 are realistic and make a well-considered decision with a cool head. We certainly see we cannot chase an Entry on this one at all.

Below is my markup of the chart and the trade plan as laid out by Trader Vision 20/20.  As a bonus, if you click the green button below, you’ll be able to watch a video of the chart markup and trade planning process.


The BOOT Trade Setup – As of 7-17-18

BOOT as of 7-17-18


The Trade Plan

BOOT Trade Plan for 7-18-18


Note how Trader Vision 20/20 does so much of the work for you.  Knowing the ratio of Bullish Conditions to Bearish ones as well as the overall risk of the position size, risk to Stop out and the Reward possible at each Target price can help a great deal with controlling our emotions.  Knowing the dollar impact of every scenario ahead of time, allows us to make calm decisions during the trade.  It really takes the pressure off.  No guesswork.  No surprises.  No emotional roller coaster.

To see a short video of this trade’s chart markup and trade planning, click the button below.


Put the power to Trader Vision 20/20 to work for you…


Testimonial

Trader Vision immediately simplified the process…immediately it provided that information and guidance to me. I knew what I would risk for how much reward, I began taking trades off at the 1st target, 2nd target, I was no longer holding all my trades for the homerun. I also began implementing the stop losses if and when they were reached, not just hoping the stock would recover.  It then became easier to see what patterns were working for me and which were not.  It provided a much more relaxed and stress-free environment. –Joan G


***************************************************************************************************

Investing and Trading involve significant financial risk and are not suitable for everyone. Ed Carter is not a licensed financial adviser nor does he offer trade recommendations or investment advice to anyone. No communication from Hit and Run Candlesticks Inc. is to be considered financial or trading advice. All information is intended for Educational Purposes Only. Terms of Service.

***************************************************************************************************