ERY Setup and Trade Plan

Today’s Featured Trade Idea is ERY .

Members can join us in Trading Room #1 as Rick reviews this setup and other Trade-Ideas at 9:10am Eastern.  For now, here are my own analysis and a potential trade plan made using our Trader Vision 20/20 software.

Note: Beware the overall market indecision. Mixed trends (short and long-term) and very volatile action (many “gap and fade” as well as intra-day reversals) make this a treacherous market.  Bear Market bounces are not when we should be getting very long in our account unless we are very quick and agile in our trading style.  This chart also lays out far less than optimal.  Great caution should be used!

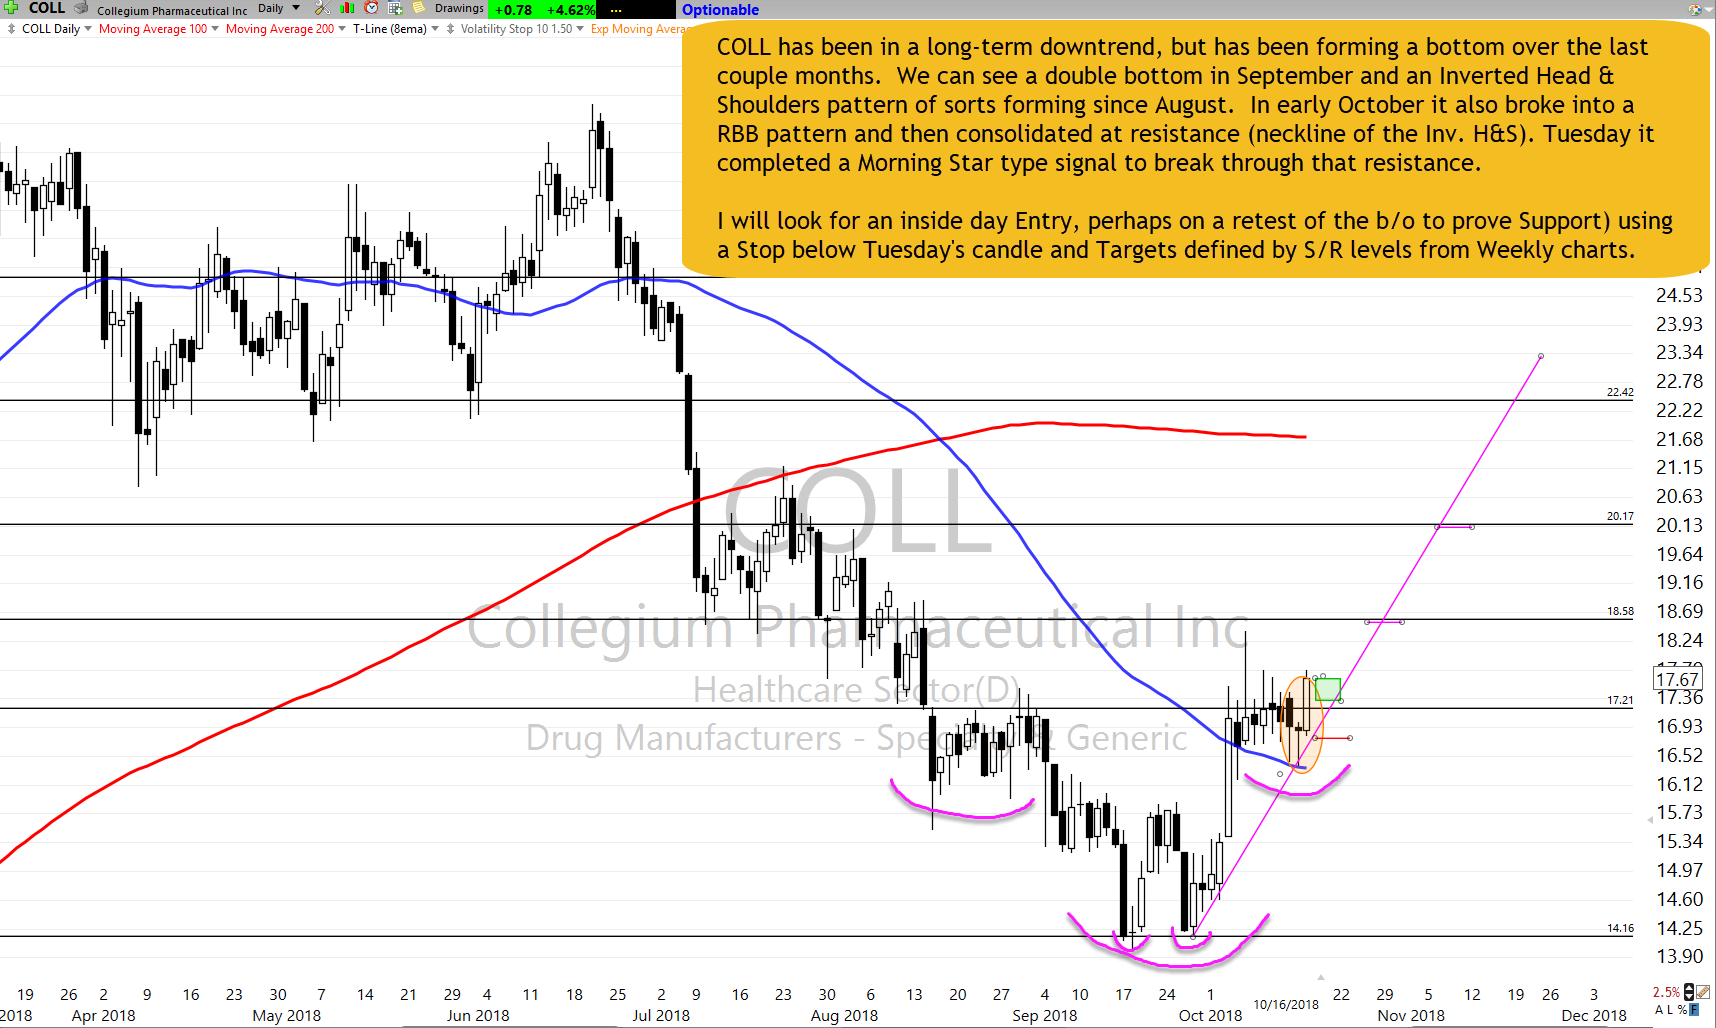
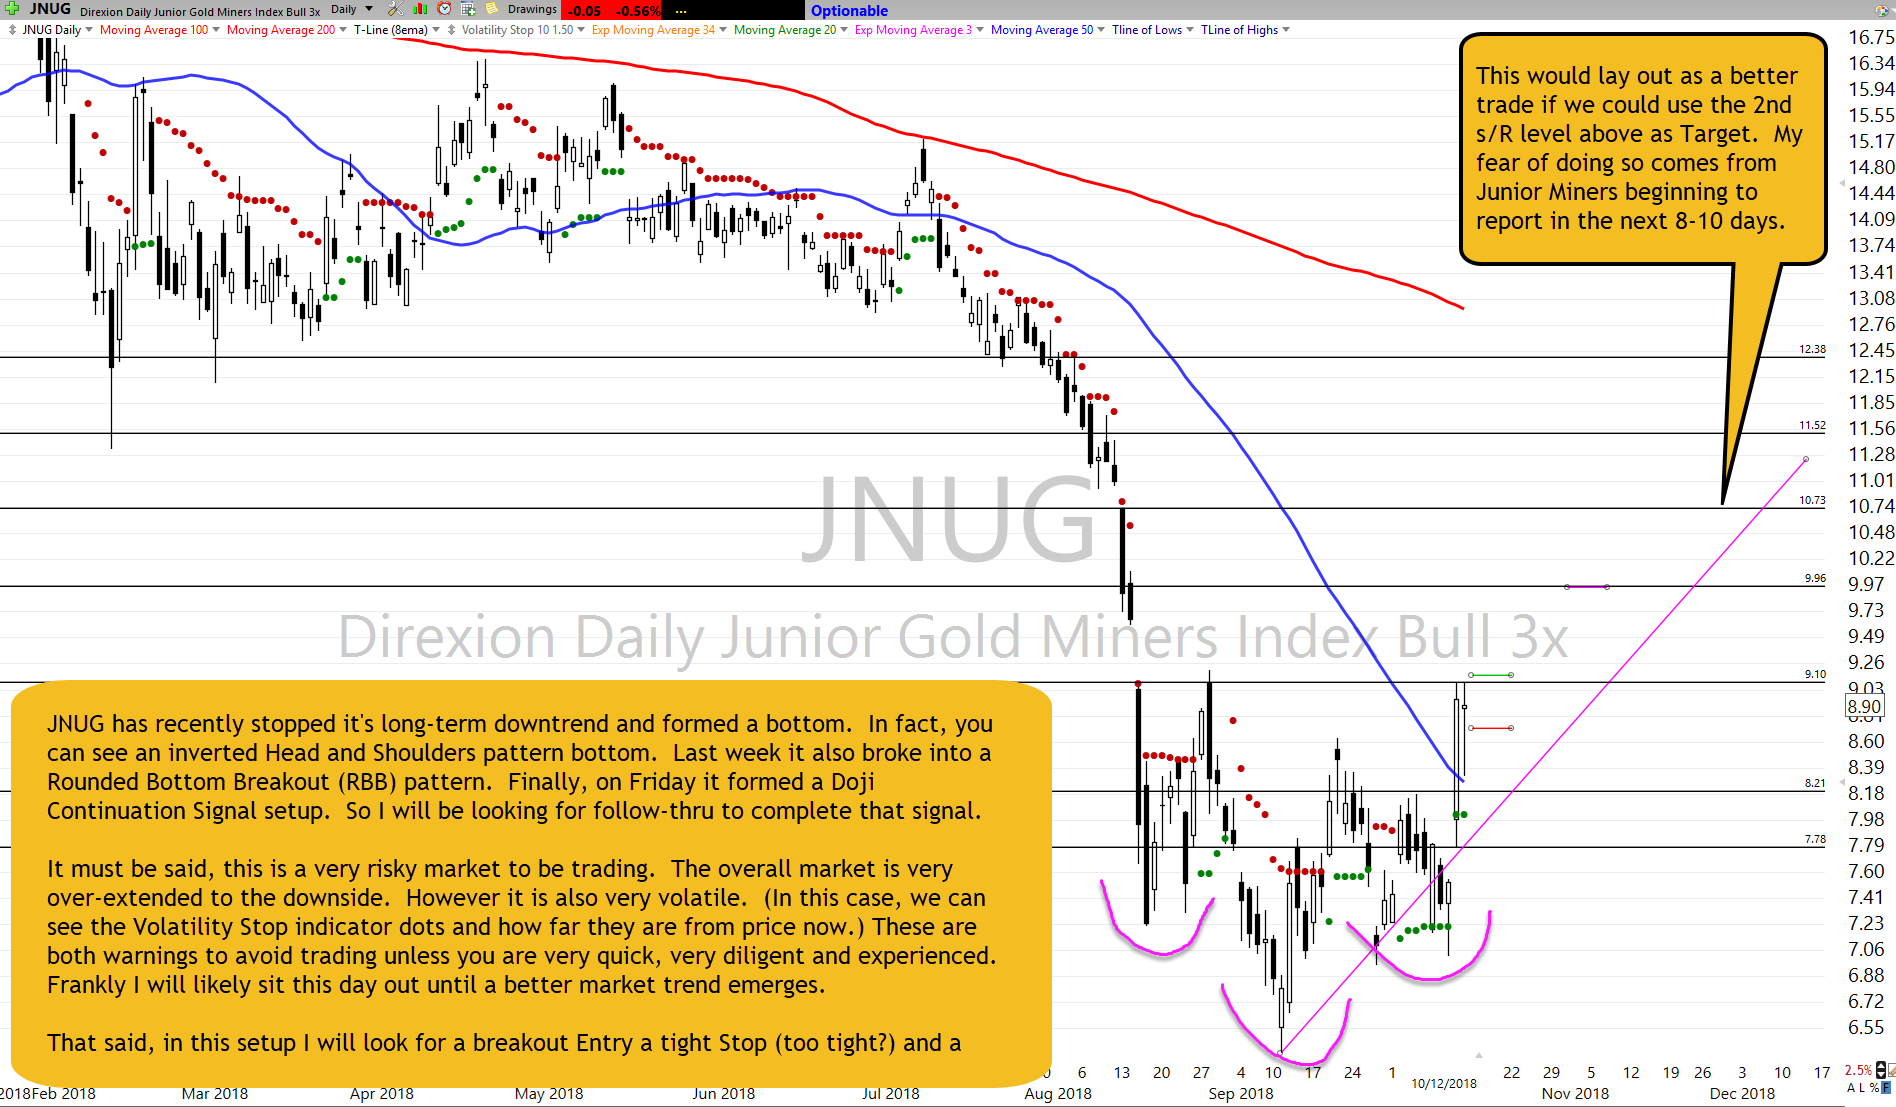
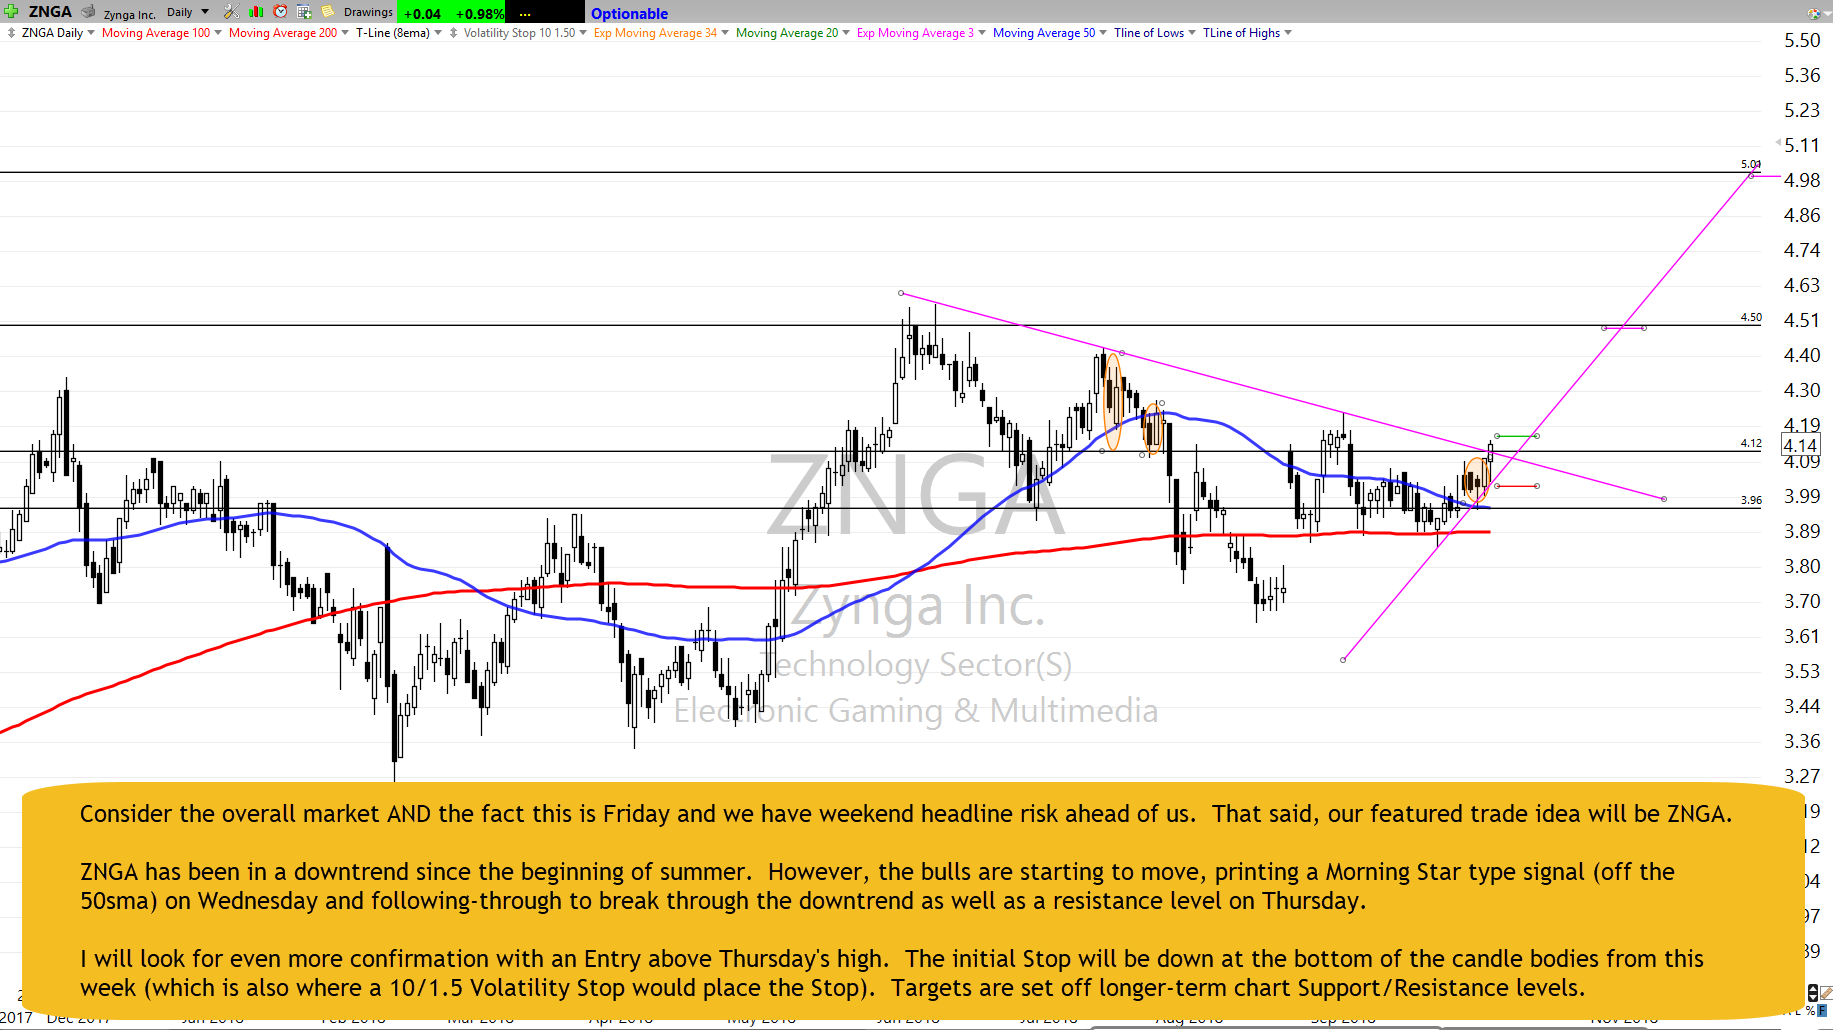
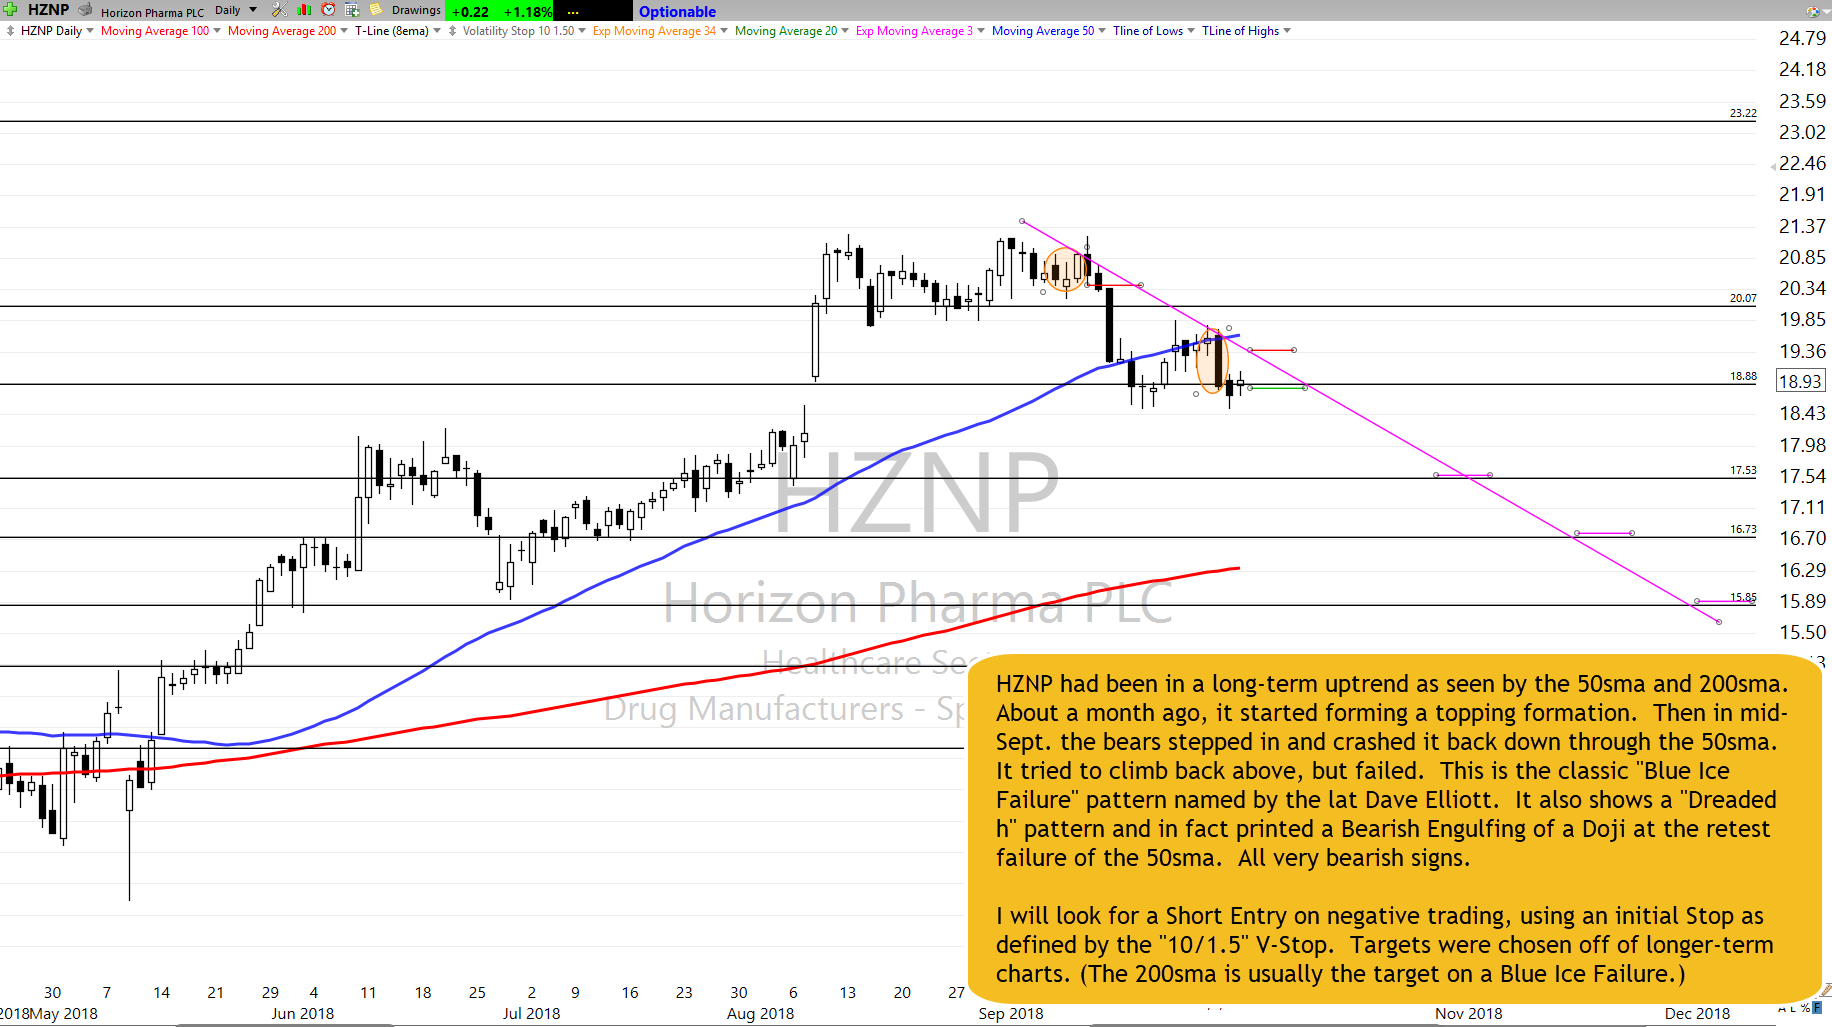
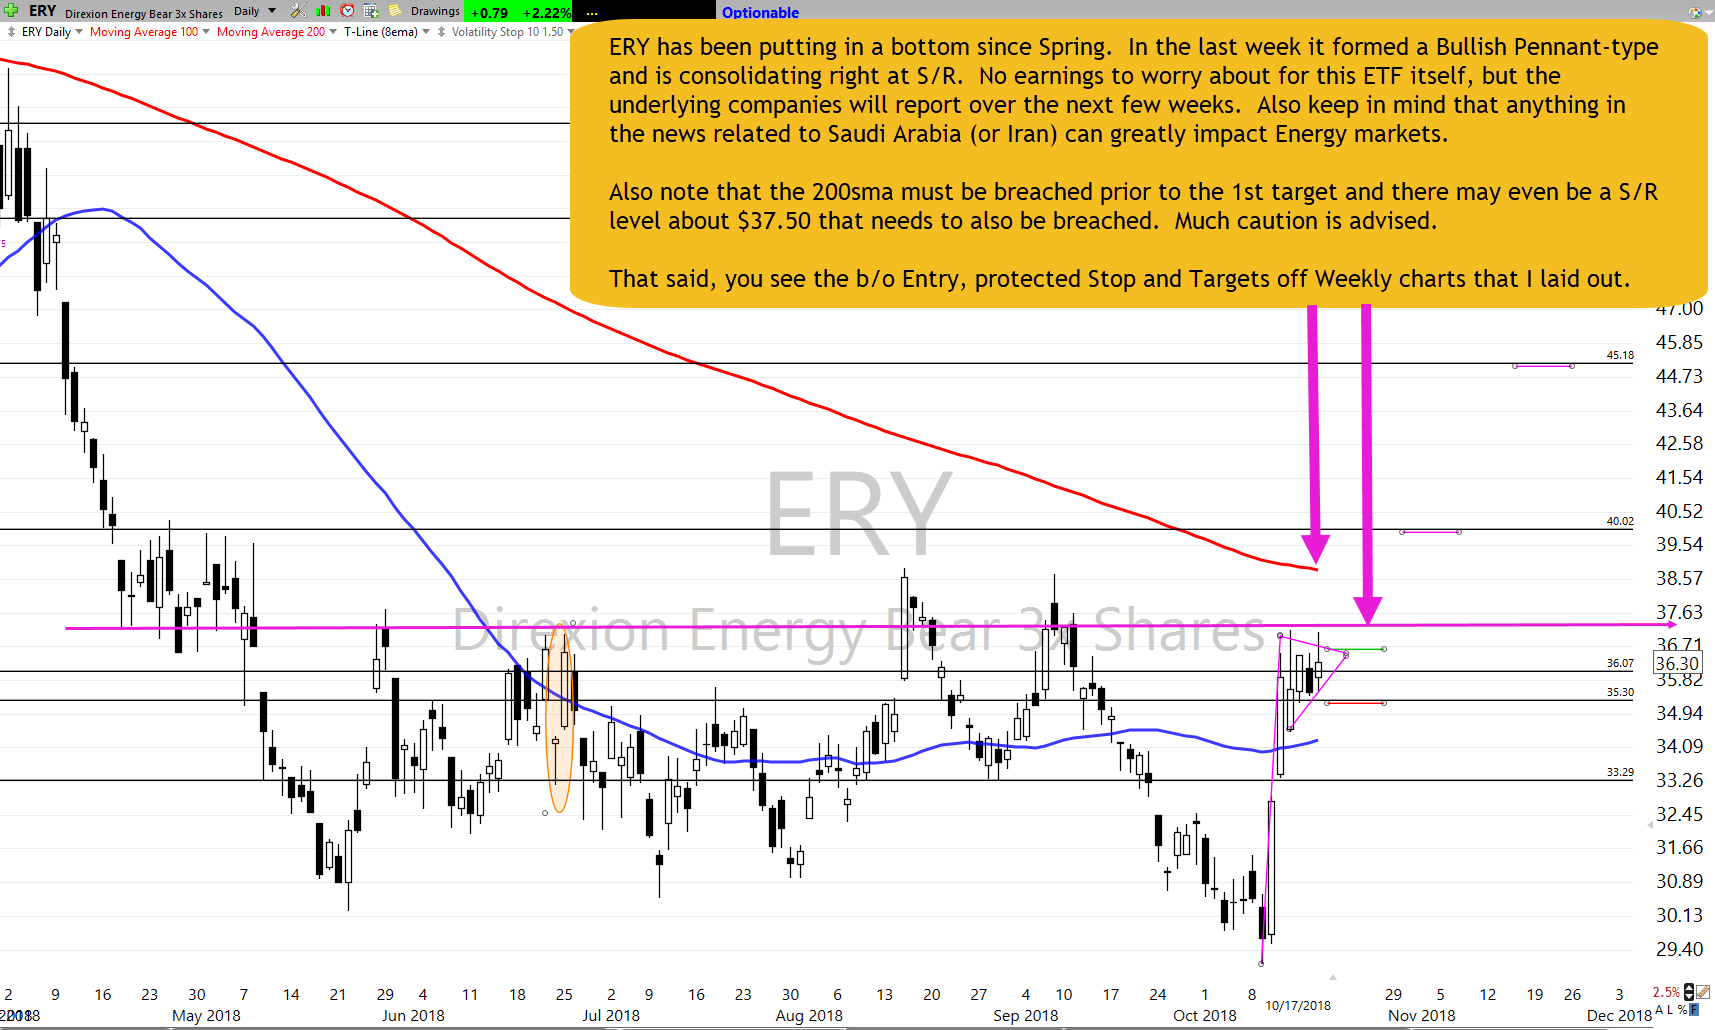
ERY has been putting in a bottom since Spring. In the last week it formed a Bullish Pennant-type and is consolidating right at S/R. No earnings to worry about for this ETF itself, but the underlying companies will report over the next few weeks. Also keep in mind that anything in the news related to Saudi Arabia (or Iran) can greatly impact Energy markets.

Also note that the 200sma must be breached prior to the 1st target and there may even be a S/R level about $37.50 that needs to also be breached. Much caution is advised.

That said, you see the b/o Entry, protected Stop and Targets off Weekly charts that I laid out.

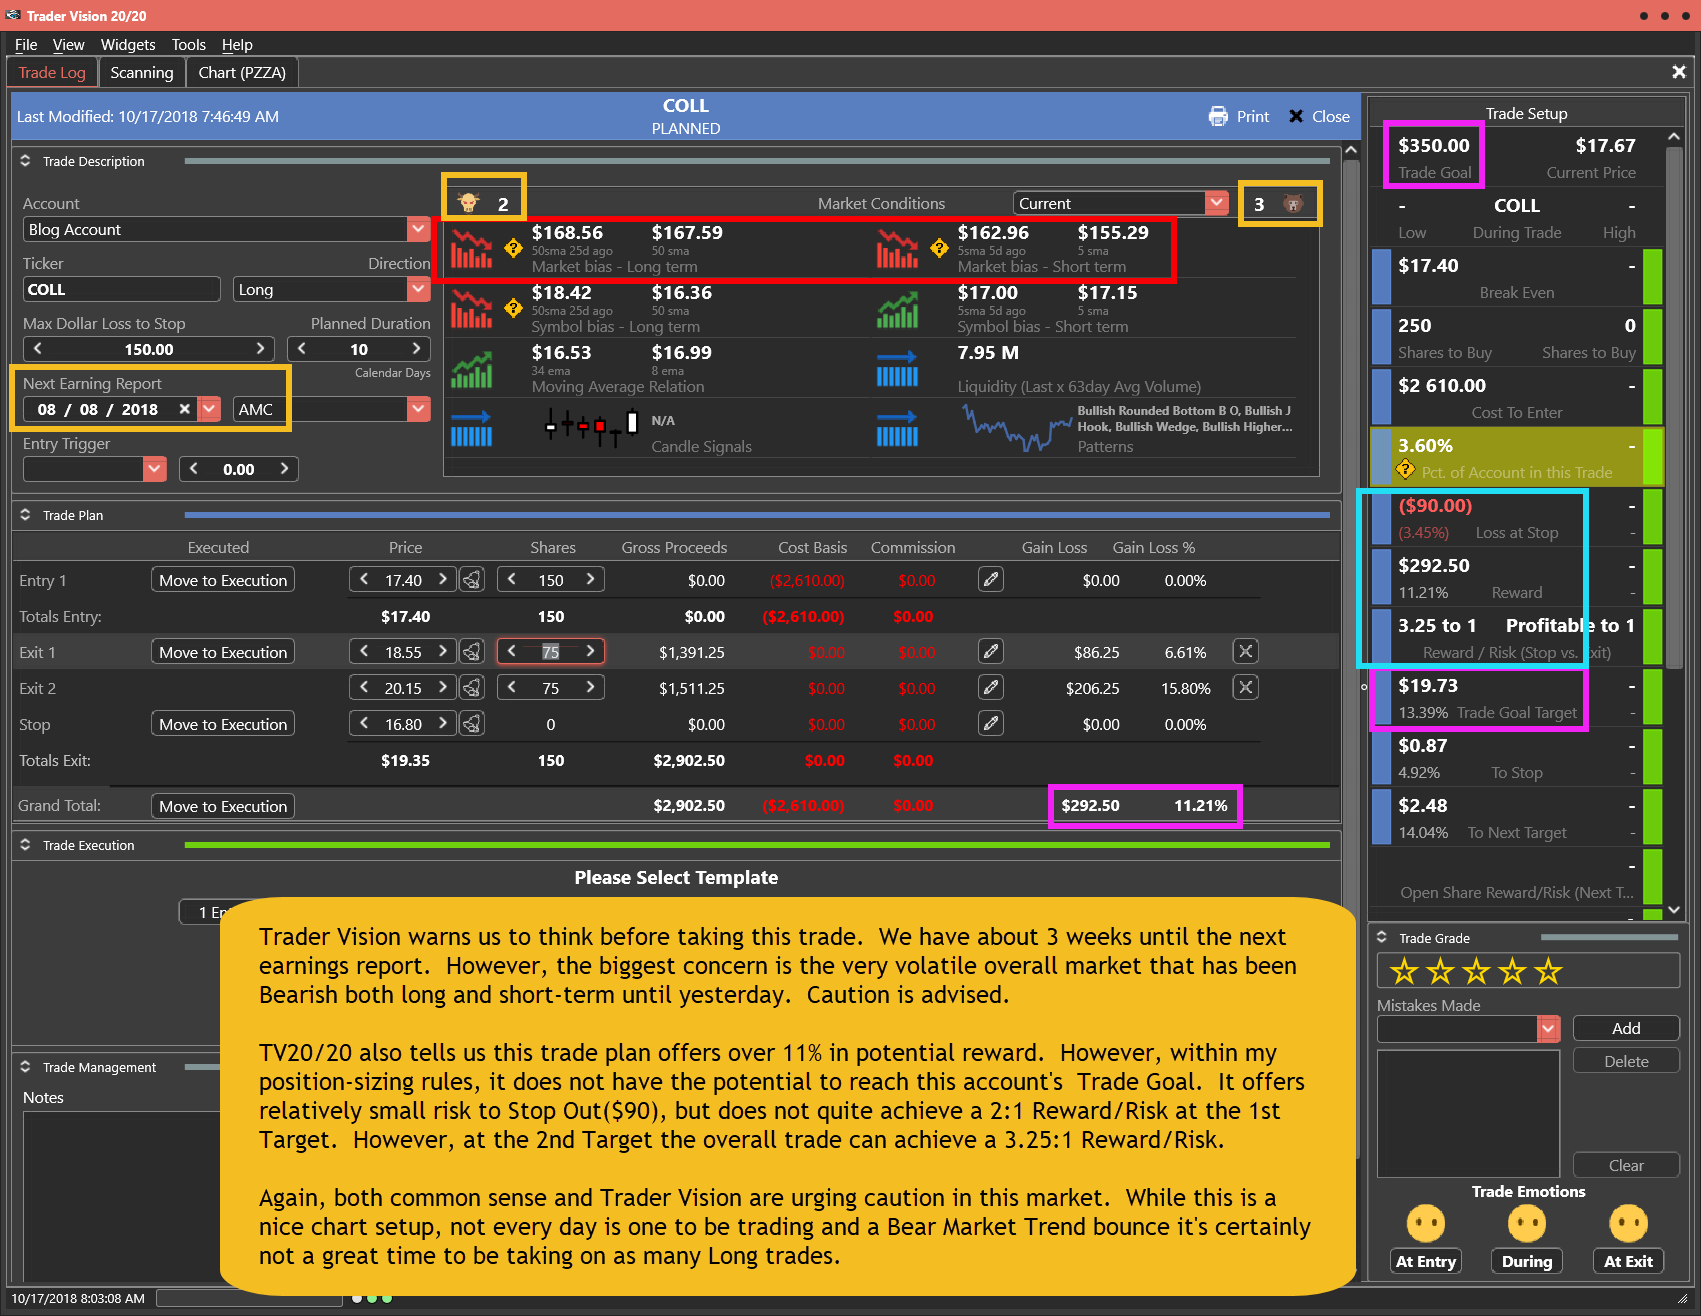
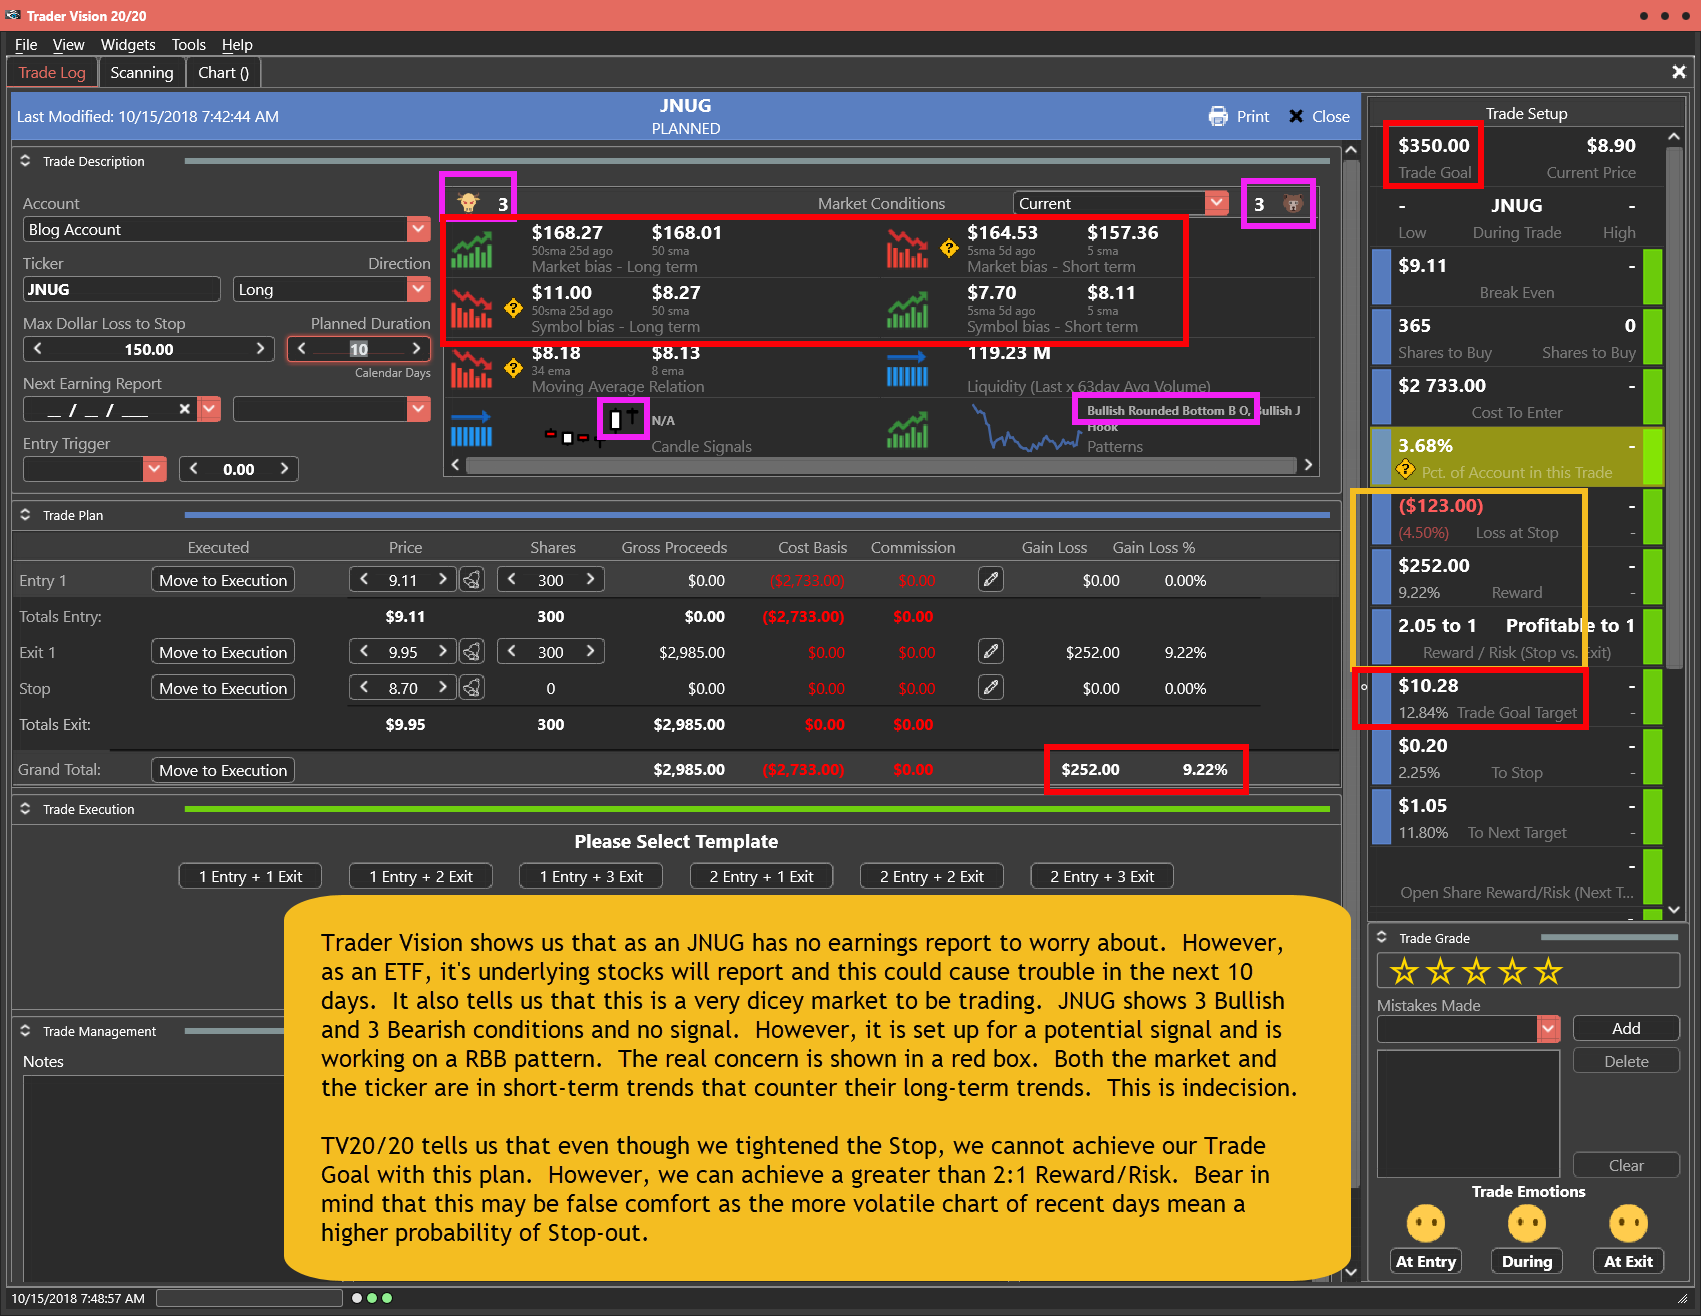
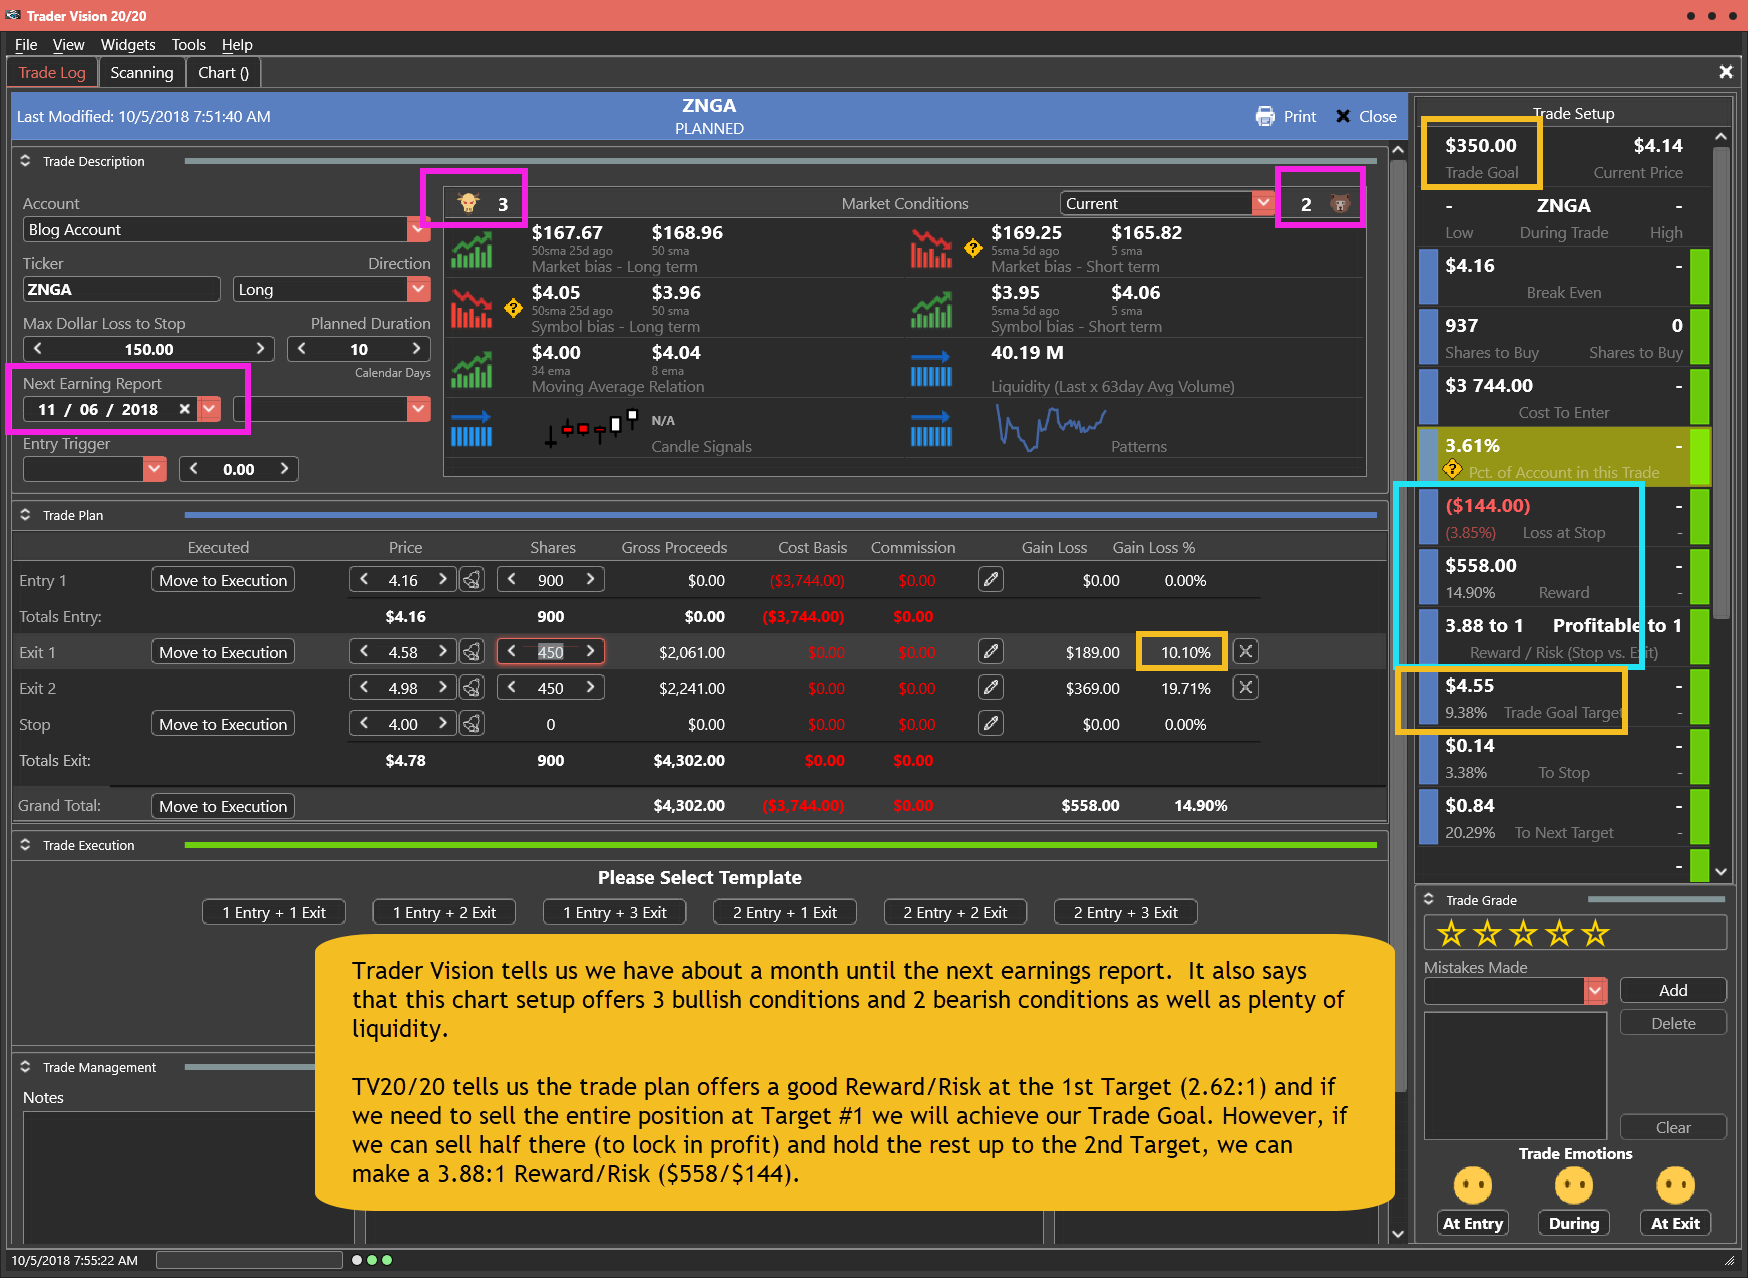
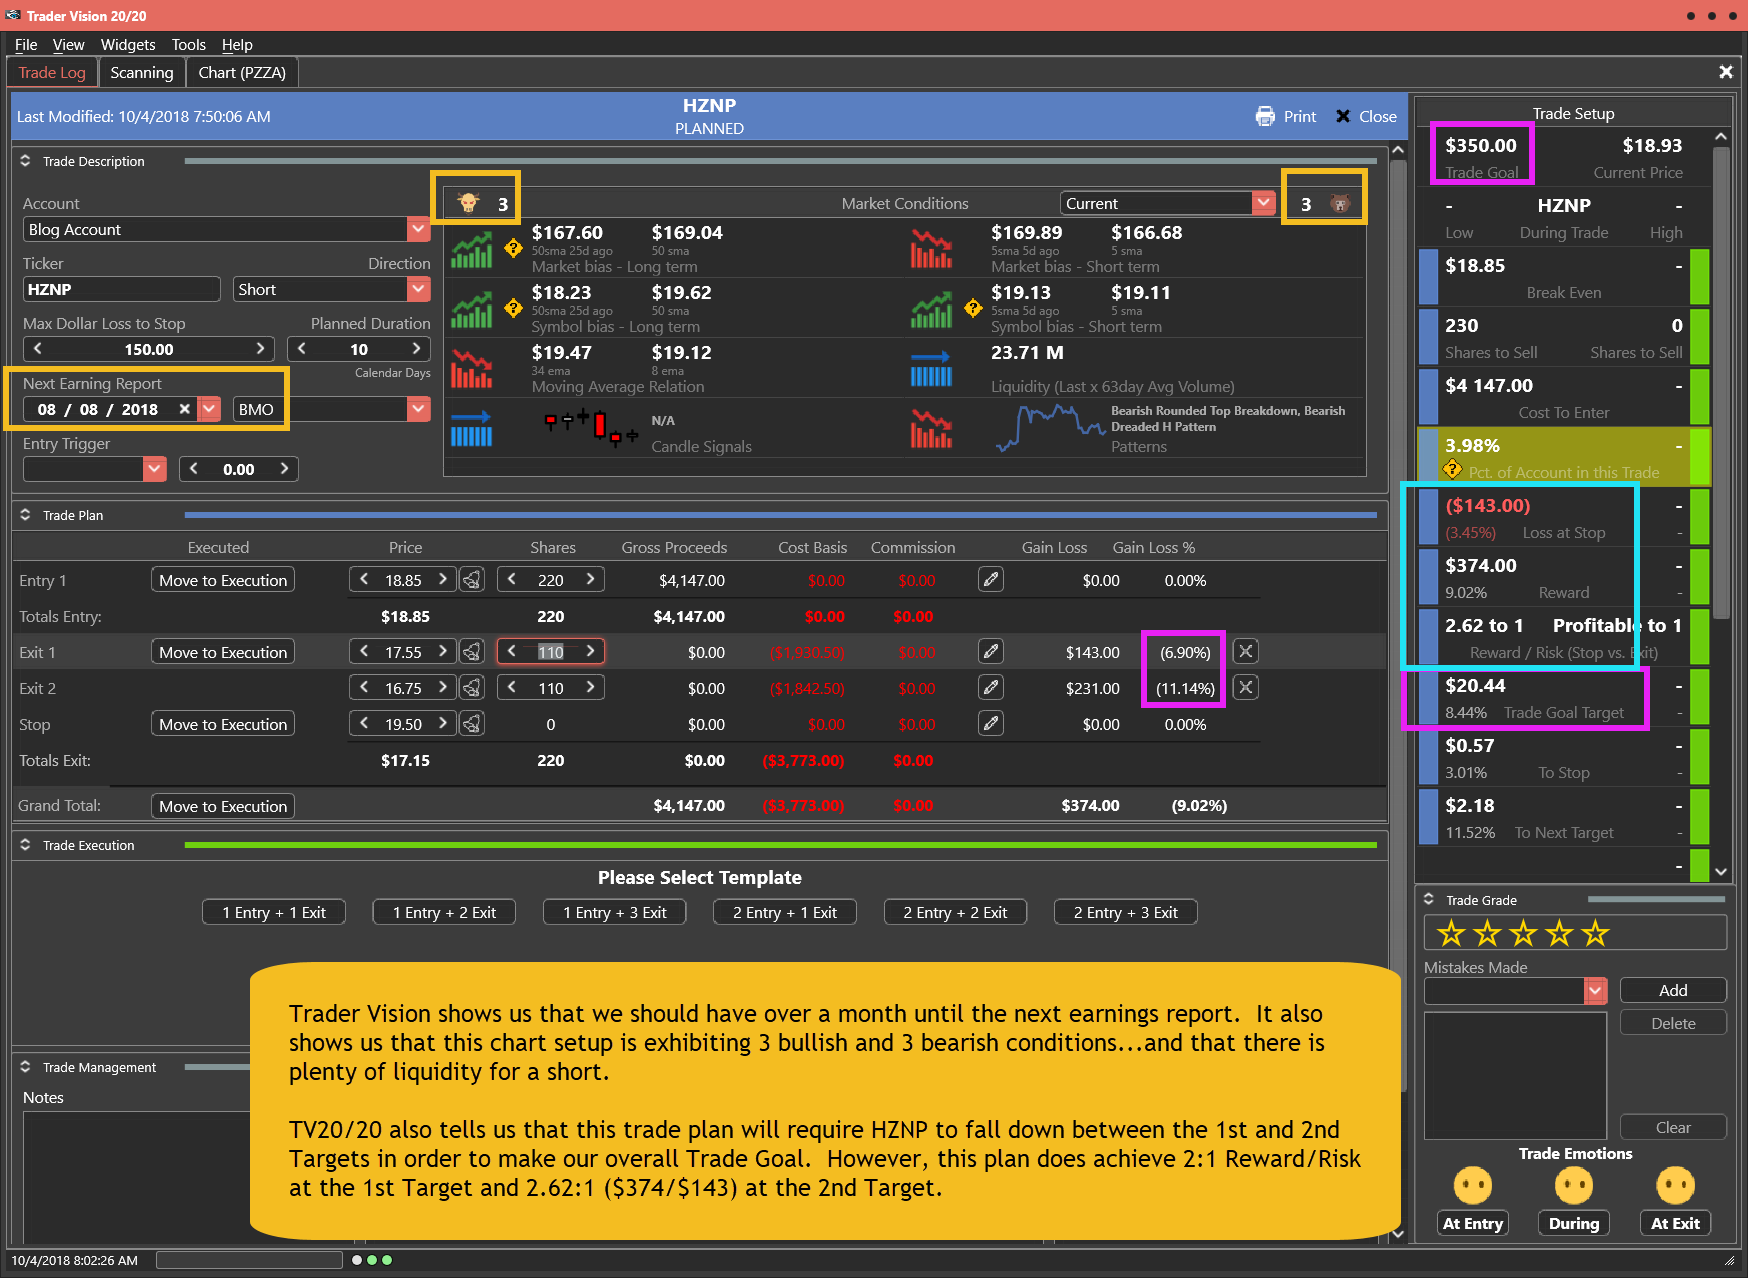
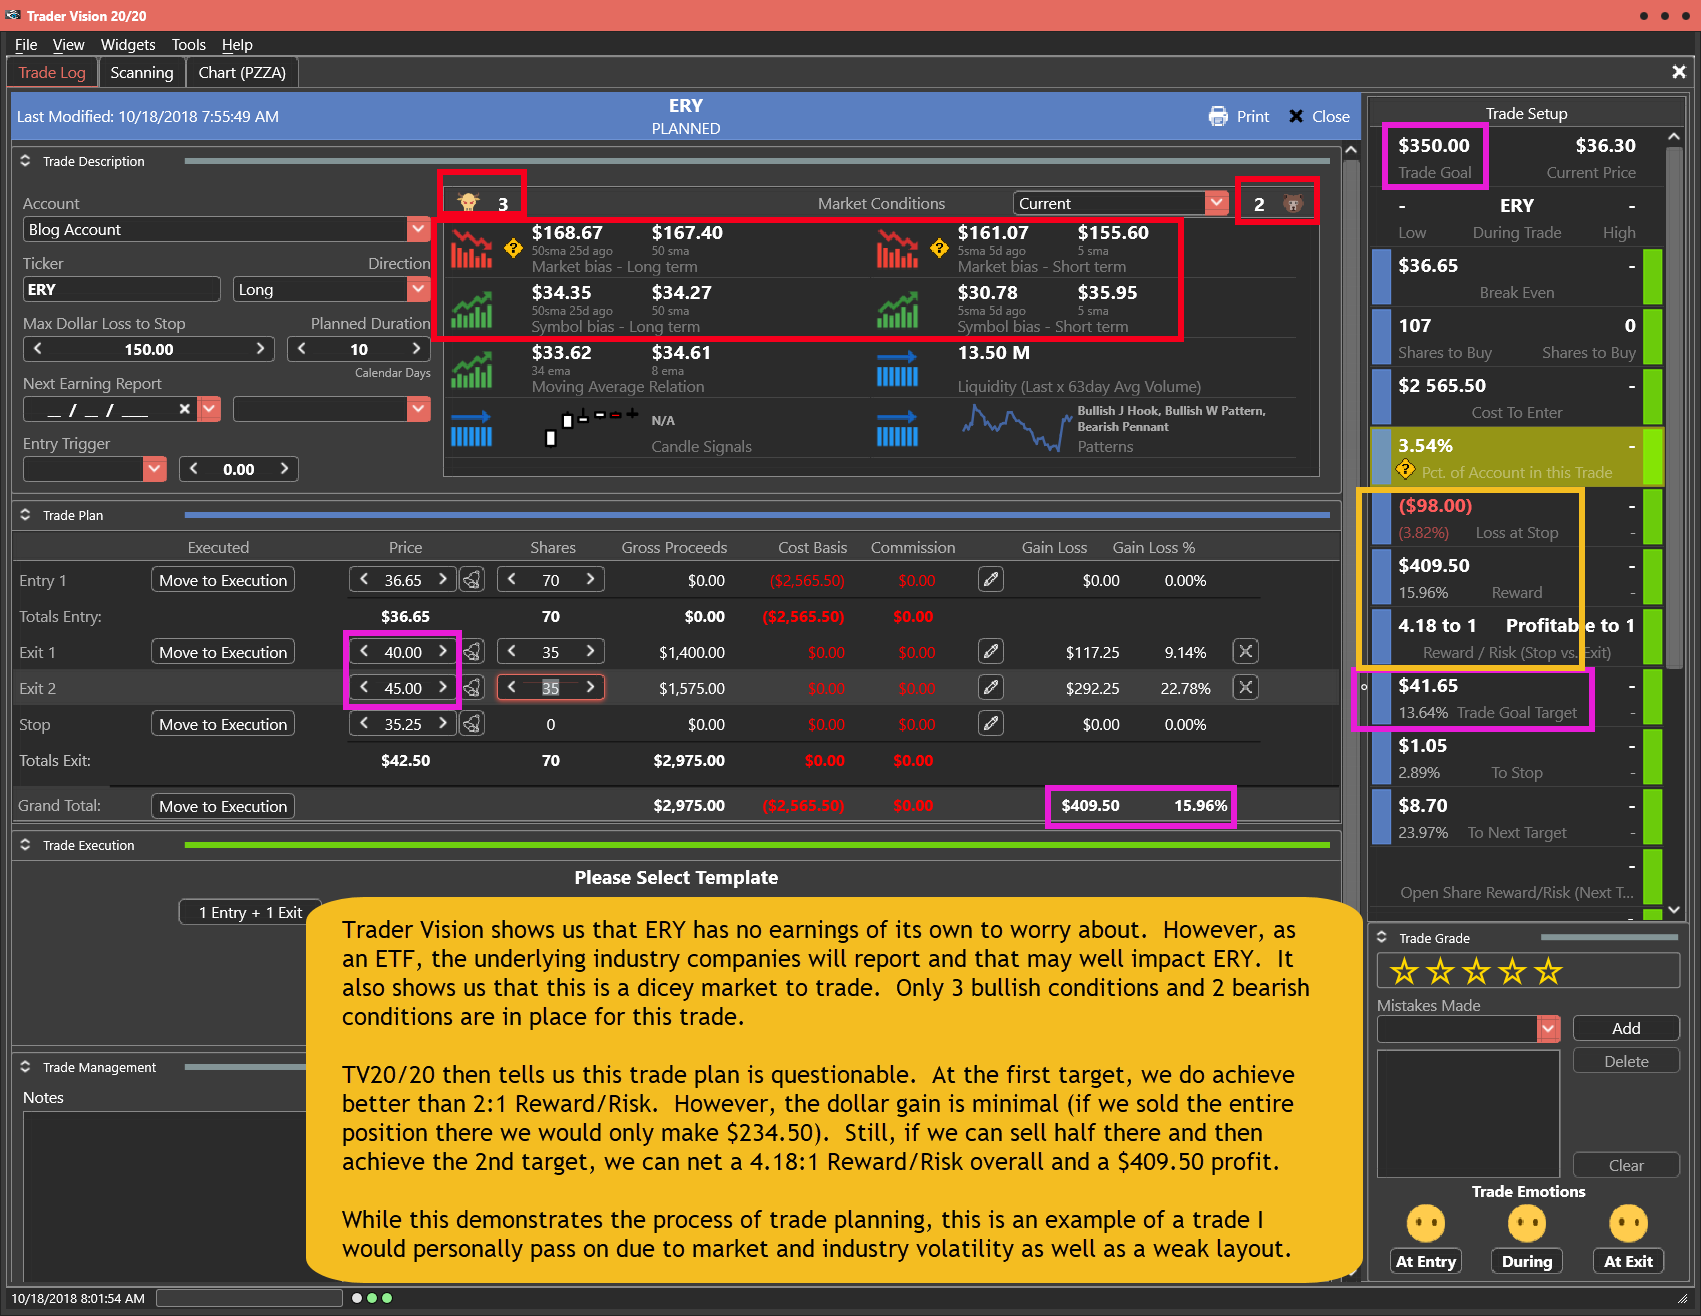
Trader Vision shows us that ERY has no earnings of its own to worry about. However, as an ETF, the underlying industry companies will report and that may well impact ERY. It also shows us that this is a dicey market to trade. Only 3 bullish conditions and 2 bearish conditions are in place for this trade.

TV20/20 then tells us this trade plan is questionable. At the first target, we do achieve better than 2:1 Reward/Risk. However, the dollar gain is minimal (if we sold the entire position there we would only make $234.50). Still, if we can sell half there and then achieve the 2nd target, we can net a 4.18:1 Reward/Risk overall and a $409.50 profit.

While this demonstrates the process of trade planning, this is an example of a trade I would personally pass on due to market and industry volatility as well as a weak layout.

Again, both common sense and Trader Vision are urging caution in this market. While this is a nice chart setup, not every day is one to be trading and a Bear Market Trend bounce it’s certainly not a great time to be taking on as many Long trades.

Having this knowledge before a trade is even entered makes it much easier to control emotions and maintain discipline.

Below is my markup of the chart and the trade plan as laid out by Trader Vision 20/20.  As a bonus, if you click the green button below, you’ll be able to watch a video of the chart markup and trade planning process.

The ERY Trade Setup – As of 10-17-18

ERY Chart Setup for 10-17-18

The Trade Plan

ERY Trade Plan for 10-18-18

Note how Trader Vision 20/20 does so much of the work for you.  Knowing the ratio of Bullish Conditions to Bearish ones as well as the overall risk of the position size, the risk to Stop out and the Reward possible at each Target price can help a great deal with controlling our emotions.  Knowing the dollar impact of every scenario ahead of time, allows us to make calm decisions during the trade.  It really takes the pressure off.  No guesswork.  No surprises.  No emotional roller coaster.

To see a short video of this trade’s chart markup and trade planning, click the button below.


Put the power to Trader Vision 20/20 to work for you…


Testimonial

Trader Vision immediately simplified the process…immediately it provided that information and guidance to me. I knew what I would risk for how much reward, I began taking trades off at the 1st target, 2nd target, I was no longer holding all my trades for the homerun. I also began implementing the stop losses if and when they were reached, not just hoping the stock would recover.  It then became easier to see what patterns were working for me and which were not.  It provided a much more relaxed and stress-free environment. –Joan G


***************************************************************************************************

Investing and Trading involve significant financial risk and are not suitable for everyone. Ed Carter is not a licensed financial adviser nor does he offer trade recommendations or investment advice to anyone. No communication from Hit and Run Candlesticks Inc. is to be considered financial or trading advice. All information is intended for Educational Purposes Only. Terms of Service.

***************************************************************************************************

COLL Setup and Trade Plan

Today’s Featured Trade Idea is COLL .

Members can join us in Trading Room #1 as Rick reviews this setup and other Trade-Ideas at 9:10am Eastern.  For now, here are my own analysis and a potential trade plan made using our Trader Vision 20/20 software.

Note: Beware the overall market indecision. Mixed trends (short and long-term) and very volatile action (many “gap and fade” as well as intra-day reversals) make this a treacherous market.  Bear Market bounces are not when we should be getting very long in our account unless we are very quick and agile in our trading style.

COLL has been in a long-term downtrend but has been forming a bottom over the last couple of months. We can see a double bottom in September and an Inverted Head & Shoulders pattern of sorts forming since August. In early October it also broke into an RBB pattern and then consolidated at resistance (neckline of the Inv. H&S). Tuesday it completed a Morning Star type signal to break through that resistance.

I will look for an inside day Entry, perhaps on a retest of the b/o to prove Support) using a Stop below Tuesday’s candle and Targets defined by S/R levels from Weekly charts.

Trader Vision warns us to think before taking this trade. We have about 3 weeks until the next earnings report. However, the biggest concern is the very volatile overall market that has been Bearish both long and short-term until yesterday. Caution is advised.

TV20/20 also tells us this trade plan offers over 11% in potential reward. However, within my position-sizing rules, it does not have the potential to reach this account’s Trade Goal. It offers relatively small risk to Stop Out($90), but does not quite achieve a 2:1 Reward/Risk at the 1st Target. However, at the 2nd Target, the overall trade can achieve a 3.25:1 Reward/Risk.

Again, both common sense and Trader Vision are urging caution in this market. While this is a nice chart setup, not every day is one to be trading and a Bear Market Trend bounce it’s certainly not a great time to be taking on as many Long trades.

Having this knowledge before a trade is even entered makes it much easier to control emotions and maintain discipline.

Below is my markup of the chart and the trade plan as laid out by Trader Vision 20/20.  As a bonus, if you click the green button below, you’ll be able to watch a video of the chart markup and trade planning process.

The COLL Trade Setup – As of 10-16-18

COLL Chart Setup as of 10-16-18

The Trade Plan

COLL Trade Plan for 10-17-18

Note how Trader Vision 20/20 does so much of the work for you.  Knowing the ratio of Bullish Conditions to Bearish ones as well as the overall risk of the position size, the risk to Stop out and the Reward possible at each Target price can help a great deal with controlling our emotions.  Knowing the dollar impact of every scenario ahead of time, allows us to make calm decisions during the trade.  It really takes the pressure off.  No guesswork.  No surprises.  No emotional roller coaster.

To see a short video of this trade’s chart markup and trade planning, click the button below.


Put the power to Trader Vision 20/20 to work for you…


Testimonial

Trader Vision immediately simplified the process…immediately it provided that information and guidance to me. I knew what I would risk for how much reward, I began taking trades off at the 1st target, 2nd target, I was no longer holding all my trades for the homerun. I also began implementing the stop losses if and when they were reached, not just hoping the stock would recover.  It then became easier to see what patterns were working for me and which were not.  It provided a much more relaxed and stress-free environment. –Joan G


***************************************************************************************************

Investing and Trading involve significant financial risk and are not suitable for everyone. Ed Carter is not a licensed financial adviser nor does he offer trade recommendations or investment advice to anyone. No communication from Hit and Run Candlesticks Inc. is to be considered financial or trading advice. All information is intended for Educational Purposes Only. Terms of Service.

***************************************************************************************************

JNUG Setup and Trade Plan

Today’s Featured Trade Idea is JNUG.

Members can join us in Trading Room #1 as Rick reviews this setup and other Trade-Ideas at 9:10am Eastern.  For now, here are my own analysis and a potential trade plan made using our Trader Vision 20/20 software.

Note: Beware the overall market indecision. Mixed trends (short and long term) and very volatile action (many “gap and fade” as well as intra-day reversals) make this a treacherous market.

JNUG has recently stopped it’s long-term downtrend and formed a bottom. In fact, you can see an inverted Head and Shoulders pattern bottom. Last week it also broke into a Rounded Bottom Breakout (RBB) pattern. Finally, on Friday it formed a Doji Continuation Signal setup. So I will be looking for follow-thru to complete that signal.

It must be said, this is a very risky market to be trading. The overall market is very over-extended to the downside. However it is also very volatile. (In this case, we can see the Volatility Stop indicator dots and how far they are from price now.) These are both warnings to avoid trading unless you are very quick, very diligent and experienced. Frankly I will likely sit this day out until a better market trend emerges.

That said, in this setup I will look for a breakout Entry a tight Stop (too tight?) and a Target set off a Weekly chart.

This would lay out as a better trade if we could use the 2nd s/R level above as Target. My fear of doing so comes from Junior Miners beginning to report in the next 8-10 days.

Trader Vision shows us that as an JNUG has no earnings report to worry about. However, as an ETF, it’s underlying stocks will report and this could cause trouble in the next 10 days. It also tells us that this is a very dicey market to be trading. JNUG shows 3 Bullish and 3 Bearish conditions and no signal. However, it is set up for a potential signal and is working on a RBB pattern. The real concern is shown in a red box. Both the market and the ticker are in short-term trends that counter their long-term trends. This is indecision.

TV20/20 tells us that even though we tightened the Stop, we cannot achieve our Trade Goal with this plan. However, we can achieve a greater than 2:1 Reward/Risk. Bear in mind that this may be false comfort as the more volatile chart of recent days mean a higher probability of Stop-out.

Having this knowledge before a trade is even entered makes it much easier to control emotions and maintain discipline.

Below is my markup of the chart and the trade plan as laid out by Trader Vision 20/20.  As a bonus, if you click the green button below, you’ll be able to watch a video of the chart markup and trade planning process.

The JNUG Trade Setup – As of 10-12-18

JNUG Chart Setup as of 10-12-18

The Trade Plan

JNUG Trade Plan for 10-15-18

Note how Trader Vision 20/20 does so much of the work for you.  Knowing the ratio of Bullish Conditions to Bearish ones as well as the overall risk of the position size, the risk to Stop out and the Reward possible at each Target price can help a great deal with controlling our emotions.  Knowing the dollar impact of every scenario ahead of time, allows us to make calm decisions during the trade.  It really takes the pressure off.  No guesswork.  No surprises.  No emotional roller coaster.

To see a short video of this trade’s chart markup and trade planning, click the button below.


Put the power to Trader Vision 20/20 to work for you…


Testimonial

Trader Vision immediately simplified the process…immediately it provided that information and guidance to me. I knew what I would risk for how much reward, I began taking trades off at the 1st target, 2nd target, I was no longer holding all my trades for the homerun. I also began implementing the stop losses if and when they were reached, not just hoping the stock would recover.  It then became easier to see what patterns were working for me and which were not.  It provided a much more relaxed and stress-free environment. –Joan G


***************************************************************************************************

Investing and Trading involve significant financial risk and are not suitable for everyone. Ed Carter is not a licensed financial adviser nor does he offer trade recommendations or investment advice to anyone. No communication from Hit and Run Candlesticks Inc. is to be considered financial or trading advice. All information is intended for Educational Purposes Only. Terms of Service.

***************************************************************************************************

WRD Setup and Trade Plan

Today’s Featured Trade Idea is WRD.

Members can join us in Trading Room #1 as Rick reviews this setup and other Trade-Ideas at 9:10am Eastern.  For now, here are my own analysis and a potential trade plan made using our Trader Vision 20/20 software.

Note: Beware the overall market indecision. Indecisive candles with a short-term bear trend, long-term bull trend and support close below and resistance close above.

WRD broke out of its downtrend in September and is coming out of a recent Inverted Head & Shoulders pattern. After the most recent strong bullish run, it has consolidated for a couple weeks, printing a couple Bullish signals during this time. This includes a quasi-Doji Continuation signal on the breakout Tuesday.

I will look for an inside day buy with a Stop blow the consolidation area bodies and Targets set off of Resistance levels above.

Trader Vision tells us that we should have about a month until WRD reports again. It also shows us that we have 4 Bullish conditions and 2 Bearish conditions in the chart setup. Both the bearish long-term symbol bias and the short-term market bias are expected with this chart and market. Also, the last 3 candles are not technically a Doji Continuation pattern but do convey the same sentiment.

TV20/20 tells us this plan offers a 2.22:1 Reward/Risk to the 1st Target, with a risk to Stop-out of $135. It also tells us the ticker must reach $26.43 in order to achieve our Trade Goal. Still, if we can sell half there and the rest at Target #2, we can achieve almost 3:1 Reward/Risk and book a $400 profit.

Having this knowledge before a trade is even entered makes it much easier to control emotions and maintain discipline.

Below is my markup of the chart and the trade plan as laid out by Trader Vision 20/20.  As a bonus, if you click the green button below, you’ll be able to watch a video of the chart markup and trade planning process.

The WRD Trade Setup – As of 10-9-18

WRD Chart Setup as of 10-9-18

The Trade Plan

WRD Trade Plan for 10-10-18

Note how Trader Vision 20/20 does so much of the work for you.  Knowing the ratio of Bullish Conditions to Bearish ones as well as the overall risk of the position size, the risk to Stop out and the Reward possible at each Target price can help a great deal with controlling our emotions.  Knowing the dollar impact of every scenario ahead of time, allows us to make calm decisions during the trade.  It really takes the pressure off.  No guesswork.  No surprises.  No emotional roller coaster.

To see a short video of this trade’s chart markup and trade planning, click the button below.


Put the power to Trader Vision 20/20 to work for you…


Testimonial

Trader Vision immediately simplified the process…immediately it provided that information and guidance to me. I knew what I would risk for how much reward, I began taking trades off at the 1st target, 2nd target, I was no longer holding all my trades for the homerun. I also began implementing the stop losses if and when they were reached, not just hoping the stock would recover.  It then became easier to see what patterns were working for me and which were not.  It provided a much more relaxed and stress-free environment. –Joan G


***************************************************************************************************

Investing and Trading involve significant financial risk and are not suitable for everyone. Ed Carter is not a licensed financial adviser nor does he offer trade recommendations or investment advice to anyone. No communication from Hit and Run Candlesticks Inc. is to be considered financial or trading advice. All information is intended for Educational Purposes Only. Terms of Service.

***************************************************************************************************

AXGN Setup and Trade Plan

Today’s Featured Trade Idea is AXGN (Short).

Members can join us in Trading Room #1 as Rick reviews this setup and other Trade-Ideas at 9:10am Eastern.  For now, here are my own analysis and a potential trade plan made using our Trader Vision 20/20 software.

AXGN broke its long-term uptrend by falling off a cliff in mid-summer. It has failed multiple attempts to break the downtrend (most recently the end of last week). It is currently in a “Dreaded h” pattern, shows a Death Cross signal as of Monday and also a quasi-Doji Continuation signal.

I will be looking to Enter Short on a breakout of the “h” (below Monday’s low) with a Stop set above a couple potential resistance levels (still tight) and Targets defined off Daily and Weekly chart S/R levels.

The 1st thing to note that this is a large position. Trader Vision tells us it represents almost 8% of the account. This is more acceptable on a Short, because the company going out of business would be in our favor as a short. In addition, while it theoretically can go to infinity in price, the practical limit makes this risk more palatable.

Trader Vision tells us we should have 3-4 weeks until the next earnings report. It also shows us that this chart setup has 5 Bearish and only 1 Bullish condition.

TV20/20 tells us this trade plan offers very low risk to stop ($64) with very high potential reward ($986). At the 1st target, the Reward/Risk is 5.83:1 ($373/$64). So we can make our trade goal by covering the short at Target #1. However, if we can cover only half there and hold the rest until target #2, we can achieve a huge 15.41:1 Reward/Risk.

Having this knowledge before a trade is even entered makes it much easier to control emotions and maintain discipline.

Below is my markup of the chart and the trade plan as laid out by Trader Vision 20/20.  As a bonus, if you click the green button below, you’ll be able to watch a video of the chart markup and trade planning process.

The AXGN Trade Setup – As of 10-8-18

AXGN Chart Setup as of 10-8-18

The Trade Plan

AXGN Trade Plan for 10-9-18

Note how Trader Vision 20/20 does so much of the work for you.  Knowing the ratio of Bullish Conditions to Bearish ones as well as the overall risk of the position size, the risk to Stop out and the Reward possible at each Target price can help a great deal with controlling our emotions.  Knowing the dollar impact of every scenario ahead of time, allows us to make calm decisions during the trade.  It really takes the pressure off.  No guesswork.  No surprises.  No emotional roller coaster.

To see a short video of this trade’s chart markup and trade planning, click the button below.


Put the power to Trader Vision 20/20 to work for you…


Testimonial

Trader Vision immediately simplified the process…immediately it provided that information and guidance to me. I knew what I would risk for how much reward, I began taking trades off at the 1st target, 2nd target, I was no longer holding all my trades for the homerun. I also began implementing the stop losses if and when they were reached, not just hoping the stock would recover.  It then became easier to see what patterns were working for me and which were not.  It provided a much more relaxed and stress-free environment. –Joan G


***************************************************************************************************

Investing and Trading involve significant financial risk and are not suitable for everyone. Ed Carter is not a licensed financial adviser nor does he offer trade recommendations or investment advice to anyone. No communication from Hit and Run Candlesticks Inc. is to be considered financial or trading advice. All information is intended for Educational Purposes Only. Terms of Service.

***************************************************************************************************

MNK Setup and Trade Plan

Today’s Featured Trade Idea is MNK.

Members can join us in Trading Room #1 as Rick reviews this setup and other Trade-Ideas at 9:10am Eastern.  For now, here are my own analysis and a potential trade plan made using our Trader Vision 20/20 software.

MNK formed a Blue Ice Failure pattern on a huge Bearish Kicker signal on Thursday. On Friday there was indecisive trading (profit taking by bears), forming a Spinning Top / Doji candle that sets up the potential of a Bearish Doji Continuation pattern.

I will be looking for a Short Entry on negative trading with a Stop not far above. I will use 3 Targets for the trade since a Blue Ice Failure pattern tends to fall to the 200sma. Those target levels are defined by Daily and Weekly chart history.

Trade Vision tells us we should have a month until the next earnings report. It also shows us that this chart setup has 4 Bearish conditions and 2 Bullish ones (the long-term stock and overall market biases).

TV20/20 shows us that this trade plan offers a $150 risk to stop-out with more than 2:1 Reward at the 1st Target. If all 3 Targets are reached (making it to the 200sma) the trade can give us a 3.45:1 overall Reward/Risk. It also shows us that we need to get below the 1st Target in order to achieve our Trade Goal for this account.

Having this knowledge before a trade is even entered makes it much easier to control emotions and maintain discipline.

Below is my markup of the chart and the trade plan as laid out by Trader Vision 20/20.  As a bonus, if you click the green button below, you’ll be able to watch a video of the chart markup and trade planning process.

The MNK Trade Setup – As of 10-5-18

MNK Chart Setup as of 10-5-18

The Trade Plan

MNK Trade Plan for 10-8-18

Note how Trader Vision 20/20 does so much of the work for you.  Knowing the ratio of Bullish Conditions to Bearish ones as well as the overall risk of the position size, the risk to Stop out and the Reward possible at each Target price can help a great deal with controlling our emotions.  Knowing the dollar impact of every scenario ahead of time, allows us to make calm decisions during the trade.  It really takes the pressure off.  No guesswork.  No surprises.  No emotional roller coaster.

To see a short video of this trade’s chart markup and trade planning, click the button below.


Put the power to Trader Vision 20/20 to work for you…


Testimonial

Trader Vision immediately simplified the process…immediately it provided that information and guidance to me. I knew what I would risk for how much reward, I began taking trades off at the 1st target, 2nd target, I was no longer holding all my trades for the homerun. I also began implementing the stop losses if and when they were reached, not just hoping the stock would recover.  It then became easier to see what patterns were working for me and which were not.  It provided a much more relaxed and stress-free environment. –Joan G


***************************************************************************************************

Investing and Trading involve significant financial risk and are not suitable for everyone. Ed Carter is not a licensed financial adviser nor does he offer trade recommendations or investment advice to anyone. No communication from Hit and Run Candlesticks Inc. is to be considered financial or trading advice. All information is intended for Educational Purposes Only. Terms of Service.

***************************************************************************************************

ZNGA Setup and Trade Plan

Today’s Featured Trade Idea is ZNGA.  (Make sure you consider the Bearish overall market in the short-term and the fact that this is Friday, meaning we have weekend headline risk to handle.  However, if you can accept those things, perhaps leaning on the longer-term indices stall all being bullish, the a ZNGA long will be today’s featured trade idea.)

Members can join us in Trading Room #1 as Rick reviews this setup and other Trade-Ideas at 9:10am Eastern.  For now, here are my own analysis and a potential trade plan made using our Trader Vision 20/20 software.

Consider the overall market AND the fact this is Friday and we have weekend headline risk ahead of us. That said, our featured trade idea will be ZNGA.

ZNGA has been in a downtrend since the beginning of summer. However, the bulls are starting to move, printing a Morning Star type signal (off the 50sma) on Wednesday and following-through to break through the downtrend as well as a resistance level on Thursday.

I will look for even more confirmation with an Entry above Thursday’s high. The initial Stop will be down at the bottom of the candle bodies from this week (which is also where a 10/1.5 Volatility Stop would place the Stop). Targets are set off longer-term chart Support/Resistance levels.

Trader Vision tells us we have about a month until the next earnings report. It also says that this chart setup offers 3 bullish conditions and 2 bearish conditions as well as plenty of liquidity.

TV20/20 tells us the trade plan offers a good Reward/Risk at the 1st Target (2.62:1) and if we need to sell the entire position at Target #1 we will achieve our Trade Goal. However, if we can sell half there (to lock in profit) and hold the rest up to the 2nd Target, we can make a 3.88:1 Reward/Risk ($558/$144).

Having this knowledge before a trade is even entered makes it much easier to control emotions and maintain discipline.

Below is my markup of the chart and the trade plan as laid out by Trader Vision 20/20.  As a bonus, if you click the green button below, you’ll be able to watch a video of the chart markup and trade planning process.

The ZNGA Trade Setup – As of 10-4-18

ZNGA Chart Setup as of 10-4-18

The Trade Plan

ZNGA Trade Plan for 10-5-18

Note how Trader Vision 20/20 does so much of the work for you.  Knowing the ratio of Bullish Conditions to Bearish ones as well as the overall risk of the position size, risk to Stop out and the Reward possible at each Target price can help a great deal with controlling our emotions.  Knowing the dollar impact of every scenario ahead of time, allows us to make calm decisions during the trade.  It really takes the pressure off.  No guesswork.  No surprises.  No emotional roller coaster.

To see a short video of this trade’s chart markup and trade planning, click the button below.


Put the power to Trader Vision 20/20 to work for you…


Testimonial

Trader Vision immediately simplified the process…immediately it provided that information and guidance to me. I knew what I would risk for how much reward, I began taking trades off at the 1st target, 2nd target, I was no longer holding all my trades for the homerun. I also began implementing the stop losses if and when they were reached, not just hoping the stock would recover.  It then became easier to see what patterns were working for me and which were not.  It provided a much more relaxed and stress-free environment. –Joan G


***************************************************************************************************

Investing and Trading involve significant financial risk and are not suitable for everyone. Ed Carter is not a licensed financial adviser nor does he offer trade recommendations or investment advice to anyone. No communication from Hit and Run Candlesticks Inc. is to be considered financial or trading advice. All information is intended for Educational Purposes Only. Terms of Service.

***************************************************************************************************

HZNP Setup and Trade Plan

Today’s Featured Trade Idea is HZNP (short) .

Members can join us in Trading Room #1 as Rick reviews this setup and other Trade-Ideas at 9:10am Eastern.  For now, here are my own analysis and a potential trade plan made using our Trader Vision 20/20 software.

HZNP had been in a long-term uptrend as seen by the 50sma and 200sma. About a month ago, it started forming a topping formation. Then in mid-Sept. the bears stepped in and crashed it back down through the 50sma. It tried to climb back above, but failed. This is the classic “Blue Ice Failure” pattern named by the lat Dave Elliott. It also shows a “Dreaded h” pattern and in fact printed a Bearish Engulfing of a Doji at the retest failure of the 50sma. All very bearish signs.

I will look for a Short Entry on negative trading, using an initial Stop as defined by the “10/1.5” V-Stop. Targets were chosen off of longer-term charts. (The 200sma is usually the target on a Blue Ice Failure.)

Trader Vision shows us that we should have over a month until the next earnings report. It also shows us that this chart setup is exhibiting 3 bullish and 3 bearish conditions…and that there is plenty of liquidity for a short.

TV20/20 also tells us that this trade plan will require HZNP to fall down between the 1st and 2nd Targets in order to make our overall Trade Goal. However, this plan does achieve 2:1 Reward/Risk at the 1st Target and 2.62:1 ($374/$143) at the 2nd Target.

Having this knowledge before a trade is even entered makes it much easier to control emotions and maintain discipline.

Below is my markup of the chart and the trade plan as laid out by Trader Vision 20/20.  As a bonus, if you click the green button below, you’ll be able to watch a video of the chart markup and trade planning process.

The HZNP Trade Setup – As of 10-3-18

HZNP Chart Setup as of 10-3-18

The Trade Plan

HZNP Trade Plan for 10-4-18

Note how Trader Vision 20/20 does so much of the work for you.  Knowing the ratio of Bullish Conditions to Bearish ones as well as the overall risk of the position size, risk to Stop out and the Reward possible at each Target price can help a great deal with controlling our emotions.  Knowing the dollar impact of every scenario ahead of time, allows us to make calm decisions during the trade.  It really takes the pressure off.  No guesswork.  No surprises.  No emotional roller coaster.

To see a short video of this trade’s chart markup and trade planning, click the button below.


Put the power to Trader Vision 20/20 to work for you…


Testimonial

Trader Vision immediately simplified the process…immediately it provided that information and guidance to me. I knew what I would risk for how much reward, I began taking trades off at the 1st target, 2nd target, I was no longer holding all my trades for the homerun. I also began implementing the stop losses if and when they were reached, not just hoping the stock would recover.  It then became easier to see what patterns were working for me and which were not.  It provided a much more relaxed and stress-free environment. –Joan G


***************************************************************************************************

Investing and Trading involve significant financial risk and are not suitable for everyone. Ed Carter is not a licensed financial adviser nor does he offer trade recommendations or investment advice to anyone. No communication from Hit and Run Candlesticks Inc. is to be considered financial or trading advice. All information is intended for Educational Purposes Only. Terms of Service.

***************************************************************************************************

COTY Setup and Trade Plan

Today’s Featured Trade Idea is COTY.

Members can join us in Trading Room #1 as Rick reviews the COTY setup and other Trade-Ideas at 9:10am Eastern.  For now, here are my own analysis and a potential trade plan made using our Trader Vision 20/20 software.

COTY was in a long-term downtrend most of the year. Then in August, the Bulls stepped in to begin a rally. After a failed attempt in late August, COTY broke through the 50sma into a RBB pattern last week.

Following a short profit-taking pullback the bulls stepped back in. On Tuesday the chart printed a Bullish Engulfing of a Dragonfly Doji-type candle in a Pullback Opportunity Pattern.

I will look for follow-through to break out of what will then be a J-hook. My initial Stop will be below a recent Support line with Target defined by longer-term charts.

Trader Vision tells us we have about 2 months until the next earnings on COTY. It also shows us that we have 3 bullish (should be 4 with a signal) and 3 bearish conditions on this chart setup.

TV20/20 also tells us that this trade plan can offer a 5.02 : 1 overall Reward/Risk if all 3 Targets are reached. At the 2nd Target, the R/R would be 3.5 : 1 and at the 1st Target he R/R would be 2.28 : 1. TV20/20 also tells us we need to reach $14.22 in order to chieve our Trade Goal.

Having this knowledge before a trade is even entered makes it much easier to control emotions and maintain discipline.

Below is my markup of the chart and the trade plan as laid out by Trader Vision 20/20.  As a bonus, if you click the green button below, you’ll be able to watch a video of the chart markup and trade planning process.

The COTY Trade Setup – As of 10-2-18

COTY Chart Setup as of 10-2-18

The Trade Plan

COTY Trade Plan for 10-3-18

Note how Trader Vision 20/20 does so much of the work for you.  Knowing the ratio of Bullish Conditions to Bearish ones as well as the overall risk of the position size, risk to Stop out and the Reward possible at each Target price can help a great deal with controlling our emotions.  Knowing the dollar impact of every scenario ahead of time, allows us to make calm decisions during the trade.  It really takes the pressure off.  No guesswork.  No surprises.  No emotional roller coaster.

To see a short video of this trade’s chart markup and trade planning, click the button below.


Put the power to Trader Vision 20/20 to work for you…


Testimonial

Trader Vision immediately simplified the process…immediately it provided that information and guidance to me. I knew what I would risk for how much reward, I began taking trades off at the 1st target, 2nd target, I was no longer holding all my trades for the homerun. I also began implementing the stop losses if and when they were reached, not just hoping the stock would recover.  It then became easier to see what patterns were working for me and which were not.  It provided a much more relaxed and stress-free environment. –Joan G


***************************************************************************************************

Investing and Trading involve significant financial risk and are not suitable for everyone. Ed Carter is not a licensed financial adviser nor does he offer trade recommendations or investment advice to anyone. No communication from Hit and Run Candlesticks Inc. is to be considered financial or trading advice. All information is intended for Educational Purposes Only. Terms of Service.

***************************************************************************************************

HAL Setup and Trade Plan

Today’s Featured Trade Idea is HAL.

Members can join us in Trading Room #1 as Rick reviews the HAL setup and other Trade-Ideas at 9:10am Eastern.  For now, here are my own analysis and a potential trade plan made using our Trader Vision 20/20 software.

HAL was in a downtrend all summer. However, the bulls stepped in during early September to start a strong month-long rally. After breaking above the 50sma (into a Rounded Bottom Breakout pattern), it ran into a S/R level and has formed a nice Bull Flag pattern as traders took profits from the rally. This also puts HAL in a nice Inverted Head and Shoulder pattern, with the S/R level as the neckline. Then on Monday, it printed a Hammer signal off the 50sma.

I will be looking for follow-through to give me a B/O Entry above the Resistance / Neckline level. The initial Stop will be down at the 50sma and I have chosen 2 Targets from longer-term charts.

Trader Vision 20/20 tells us that we should have about 3-4 weeks before earnings come around again. It also tells us this chart setup offers 4 bullish conditions and the only 2 bearish conditions are to be expected from a RBB pattern (long-term downtrend has not flipped bullish yet) during a short-term overall market pullback.

TV20/20 also tells us that this plan offers a good Reward/Risk (2.71:1) at the 1st Target, with the potential to book close to our Trade Goal ($325/$350) if we need to sell at that level. However, if we can sell half at Target #1 and hold the remainder until we reach Target #2, we can book a 3.33:1 Reward/Risk and clear $400 in profit.

Having this knowledge before a trade is even entered makes it much easier to control emotions and maintain discipline.

Below is my markup of the chart and the trade plan as laid out by Trader Vision 20/20.  As a bonus, if you click the green button below, you’ll be able to watch a video of the chart markup and trade planning process.

The HAL Trade Setup – As of 10-1-18

HAL Chart Setup as of 10-1-18

The Trade Plan

HAL Trade Plan for 10-2-18

Note how Trader Vision 20/20 does so much of the work for you.  Knowing the ratio of Bullish Conditions to Bearish ones as well as the overall risk of the position size, risk to Stop out and the Reward possible at each Target price can help a great deal with controlling our emotions.  Knowing the dollar impact of every scenario ahead of time, allows us to make calm decisions during the trade.  It really takes the pressure off.  No guesswork.  No surprises.  No emotional roller coaster.

To see a short video of this trade’s chart markup and trade planning, click the button below.


Put the power to Trader Vision 20/20 to work for you…


Testimonial

Trader Vision immediately simplified the process…immediately it provided that information and guidance to me. I knew what I would risk for how much reward, I began taking trades off at the 1st target, 2nd target, I was no longer holding all my trades for the homerun. I also began implementing the stop losses if and when they were reached, not just hoping the stock would recover.  It then became easier to see what patterns were working for me and which were not.  It provided a much more relaxed and stress-free environment. –Joan G


***************************************************************************************************

Investing and Trading involve significant financial risk and are not suitable for everyone. Ed Carter is not a licensed financial adviser nor does he offer trade recommendations or investment advice to anyone. No communication from Hit and Run Candlesticks Inc. is to be considered financial or trading advice. All information is intended for Educational Purposes Only. Terms of Service.

***************************************************************************************************