Friday Performance Update Be Our Guest in Trading Room 1
As you know, Hit and Run Candlesticks does not issue Featured Trade Ideas on Fridays. That is especially true heading into what may turn into a 5 day weekend for the market (With Independence Day falling on Wednesday and Tuesday being a half day, I don’t anticipate much market action Friday, Monday or Tuesday. So it is quite possible there won’t be much trading volume until at least Thursday 7/5.
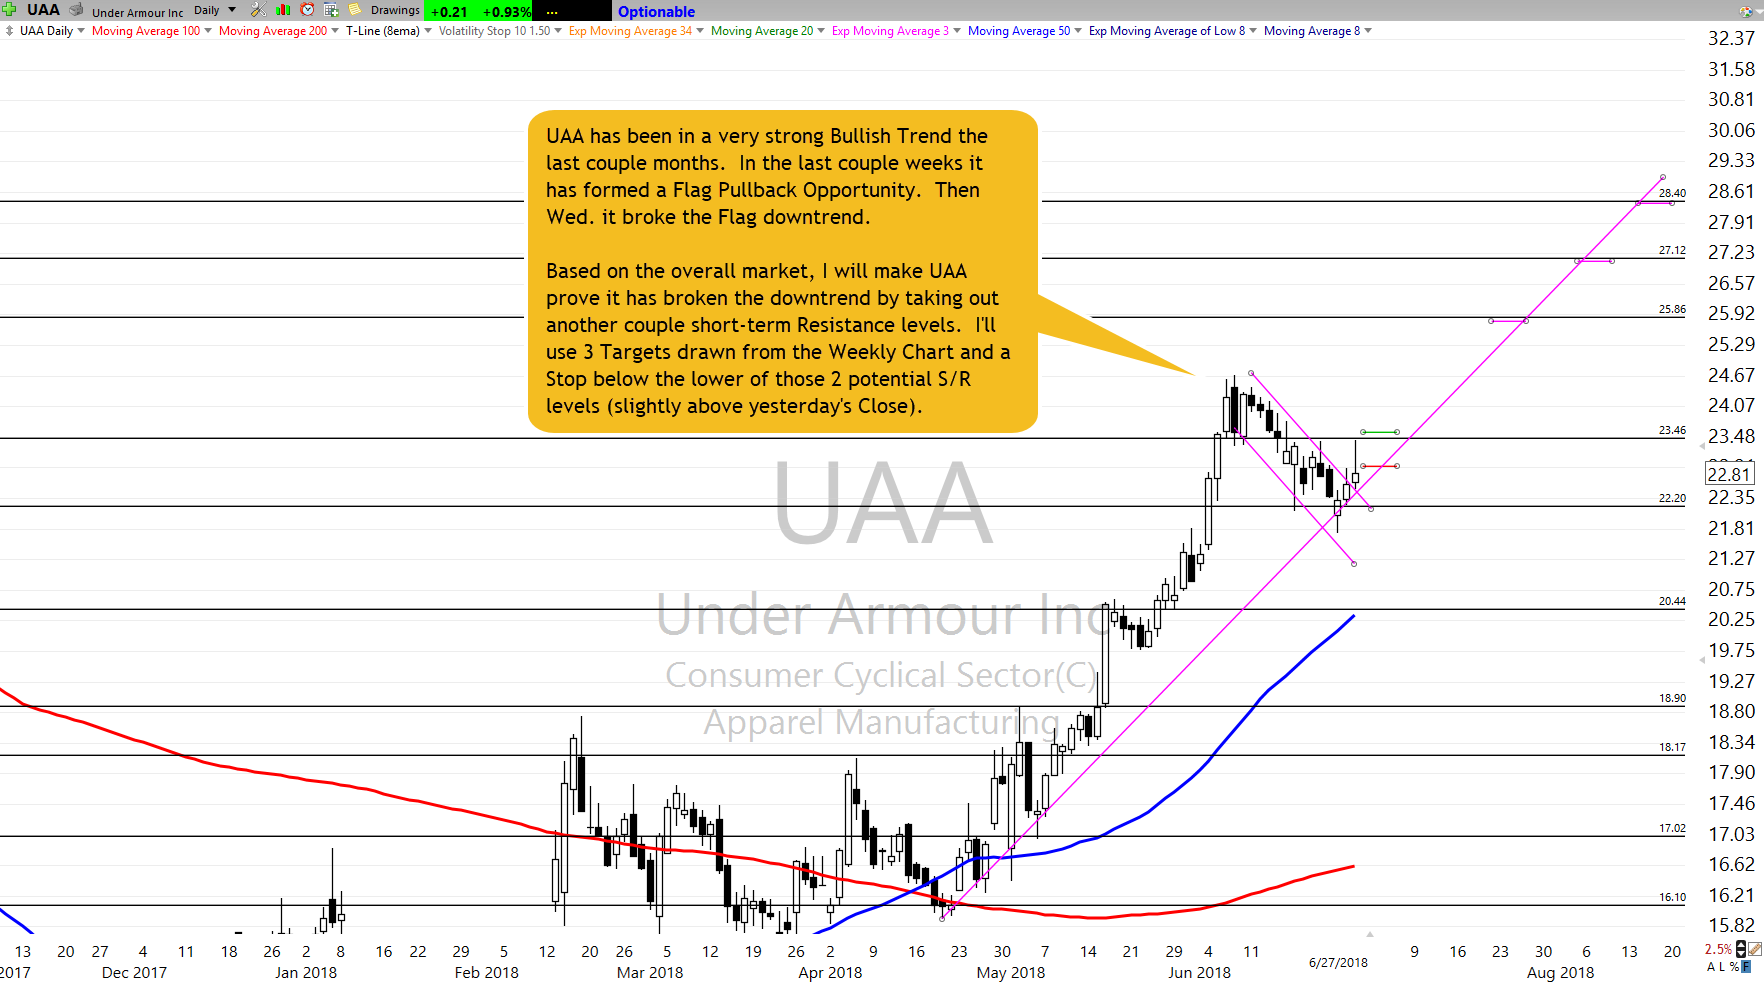
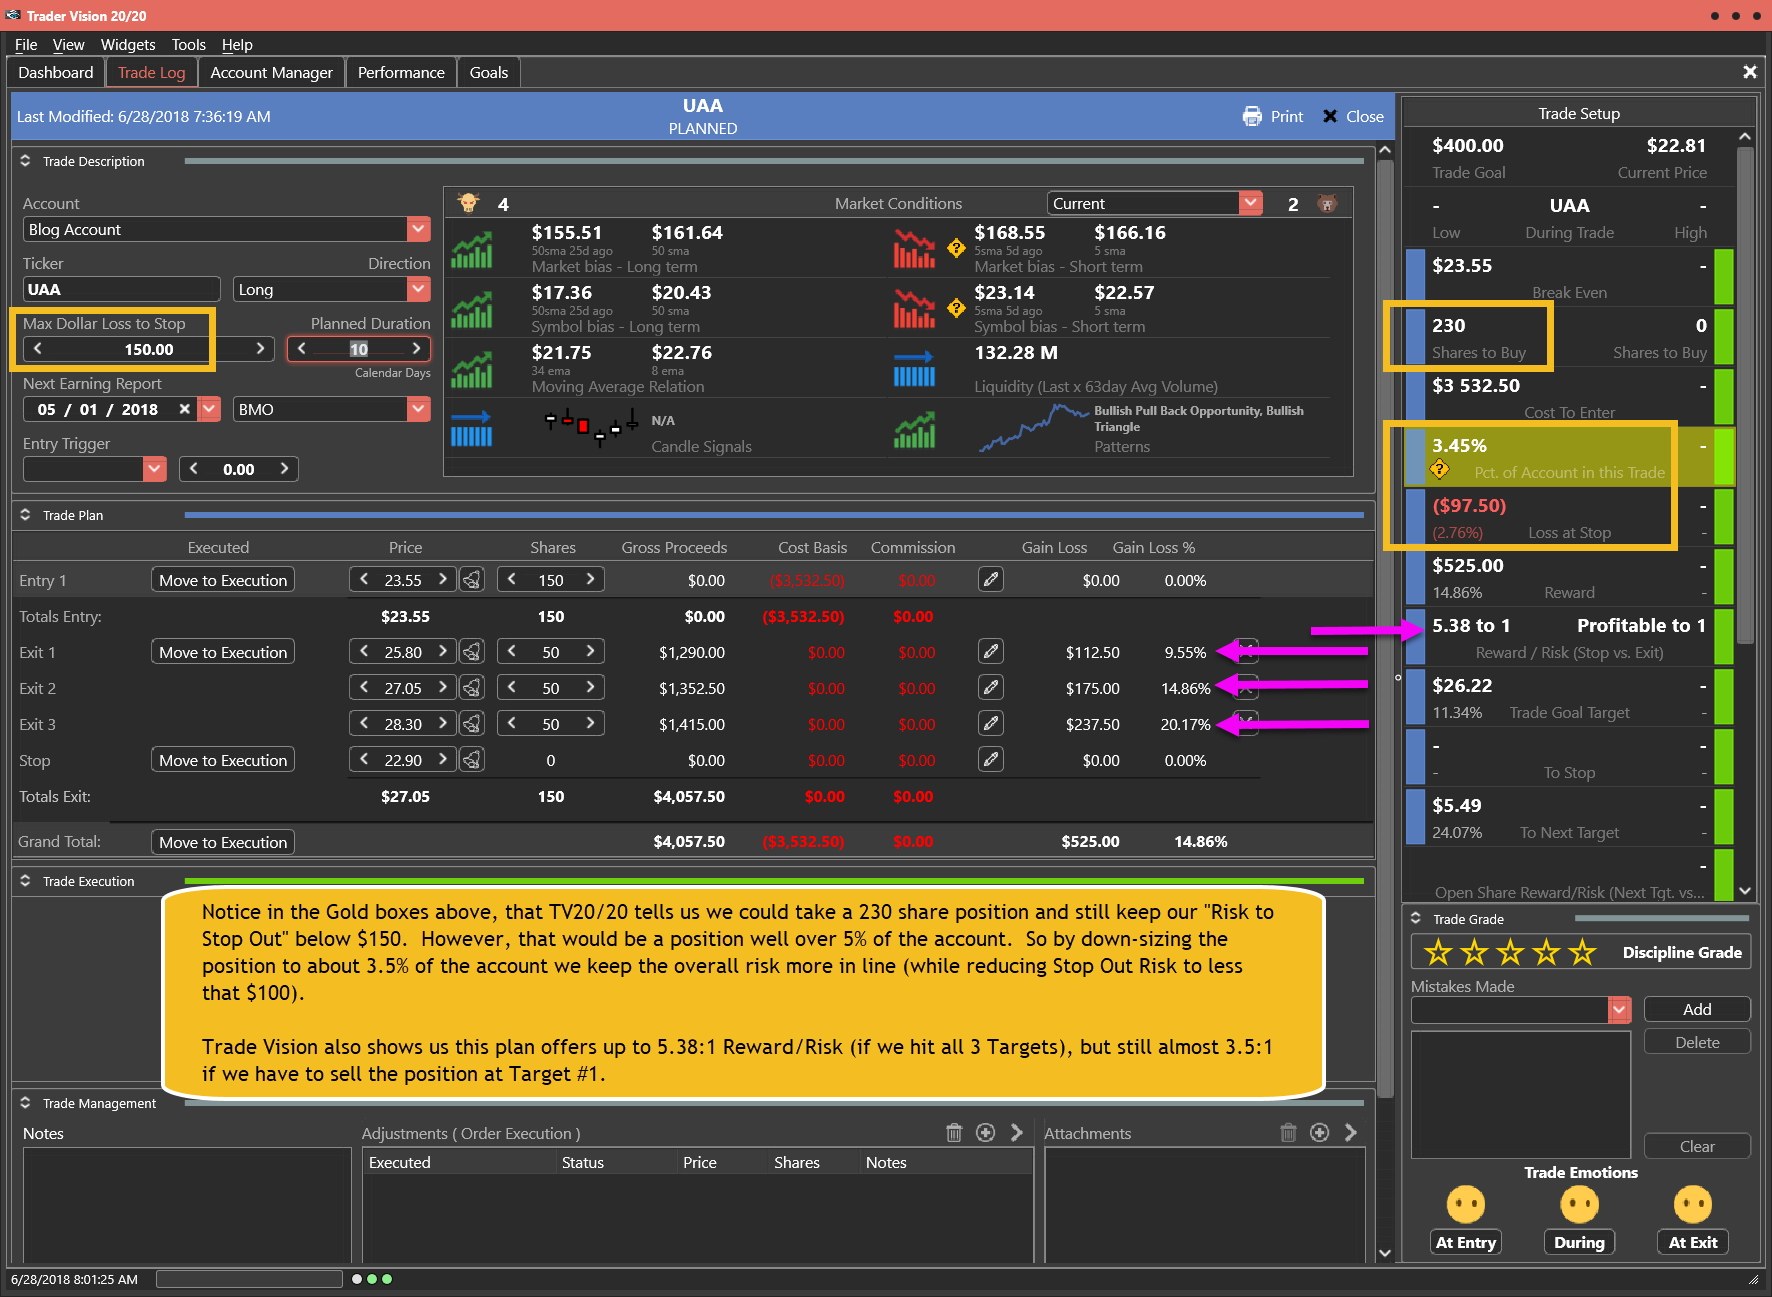
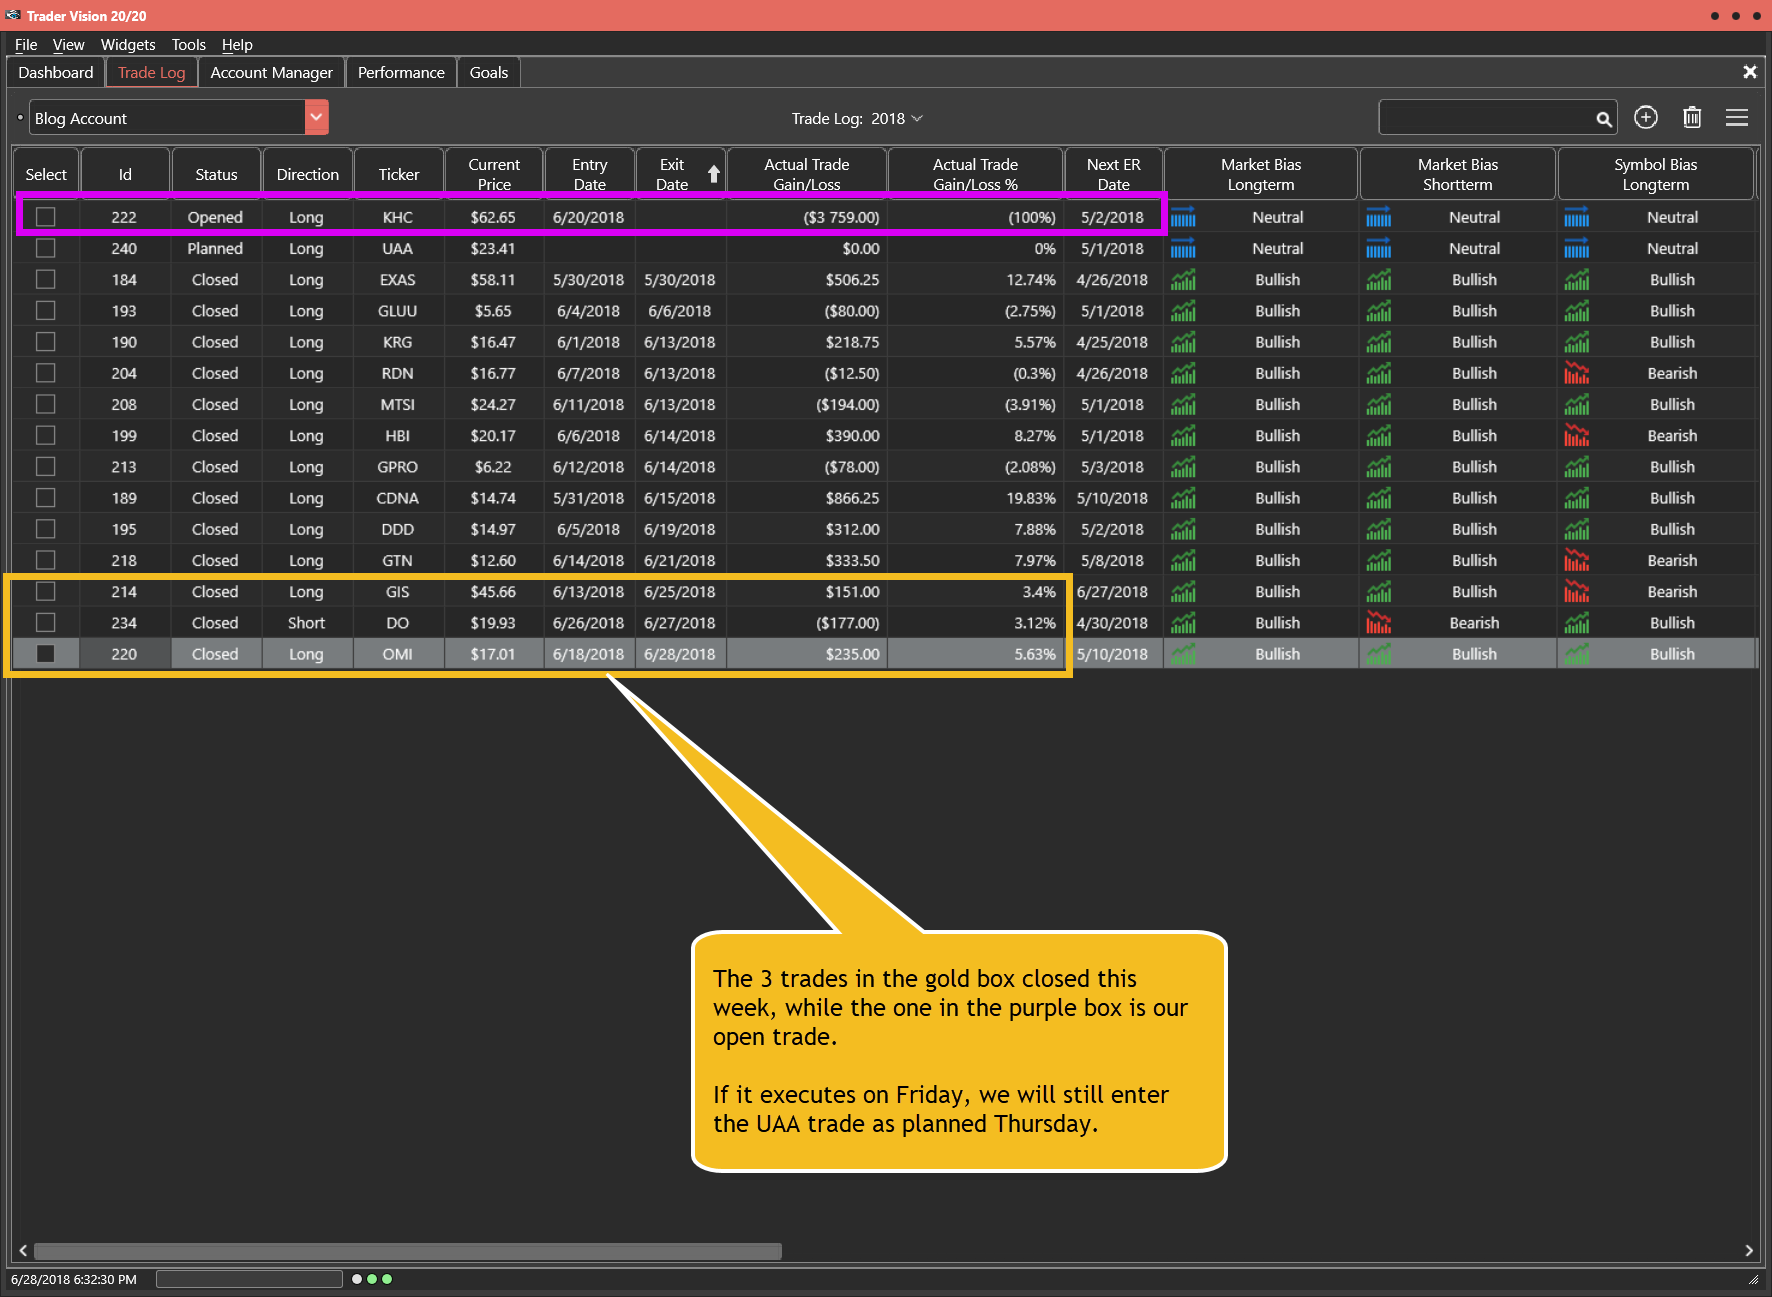
That said, the UAA trade did not execute on Thursday. However, UAA had a nice day, it just did not meet my stringent entry criteria of breaking resistance. If it gets going and breaks out on Friday, I will Enter the trade as planned. Nothing has fundamentally changed and, in fact, I am more confident the Bullish Flag has been broken. The means the J-hook breakout is more probable Friday morning than it was Thursday morning. So, if UAA triggers an Entry Friday, I will enter that trade as originally planned.
Instead of planning a new trade, we’ll use Friday’s to check the performance of our trades to date, check on our open trades and adjust and positions as needed.
Bear in mind that this update covers the period up through 6-28-18.
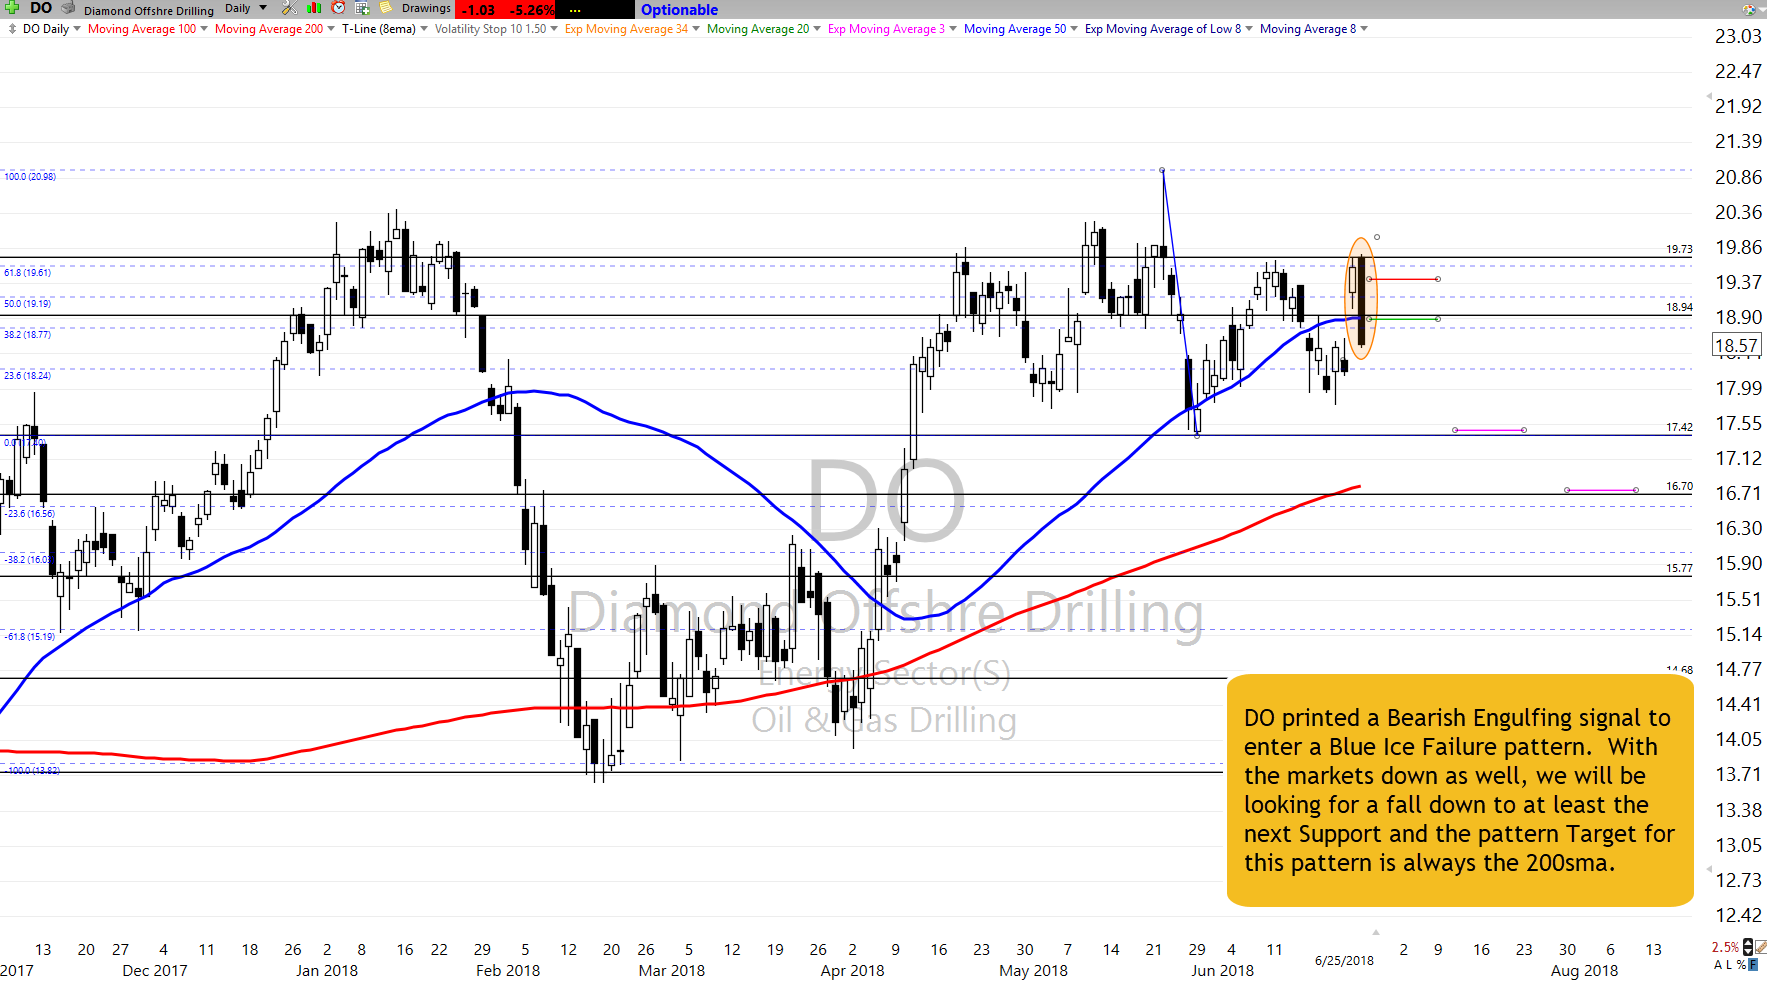
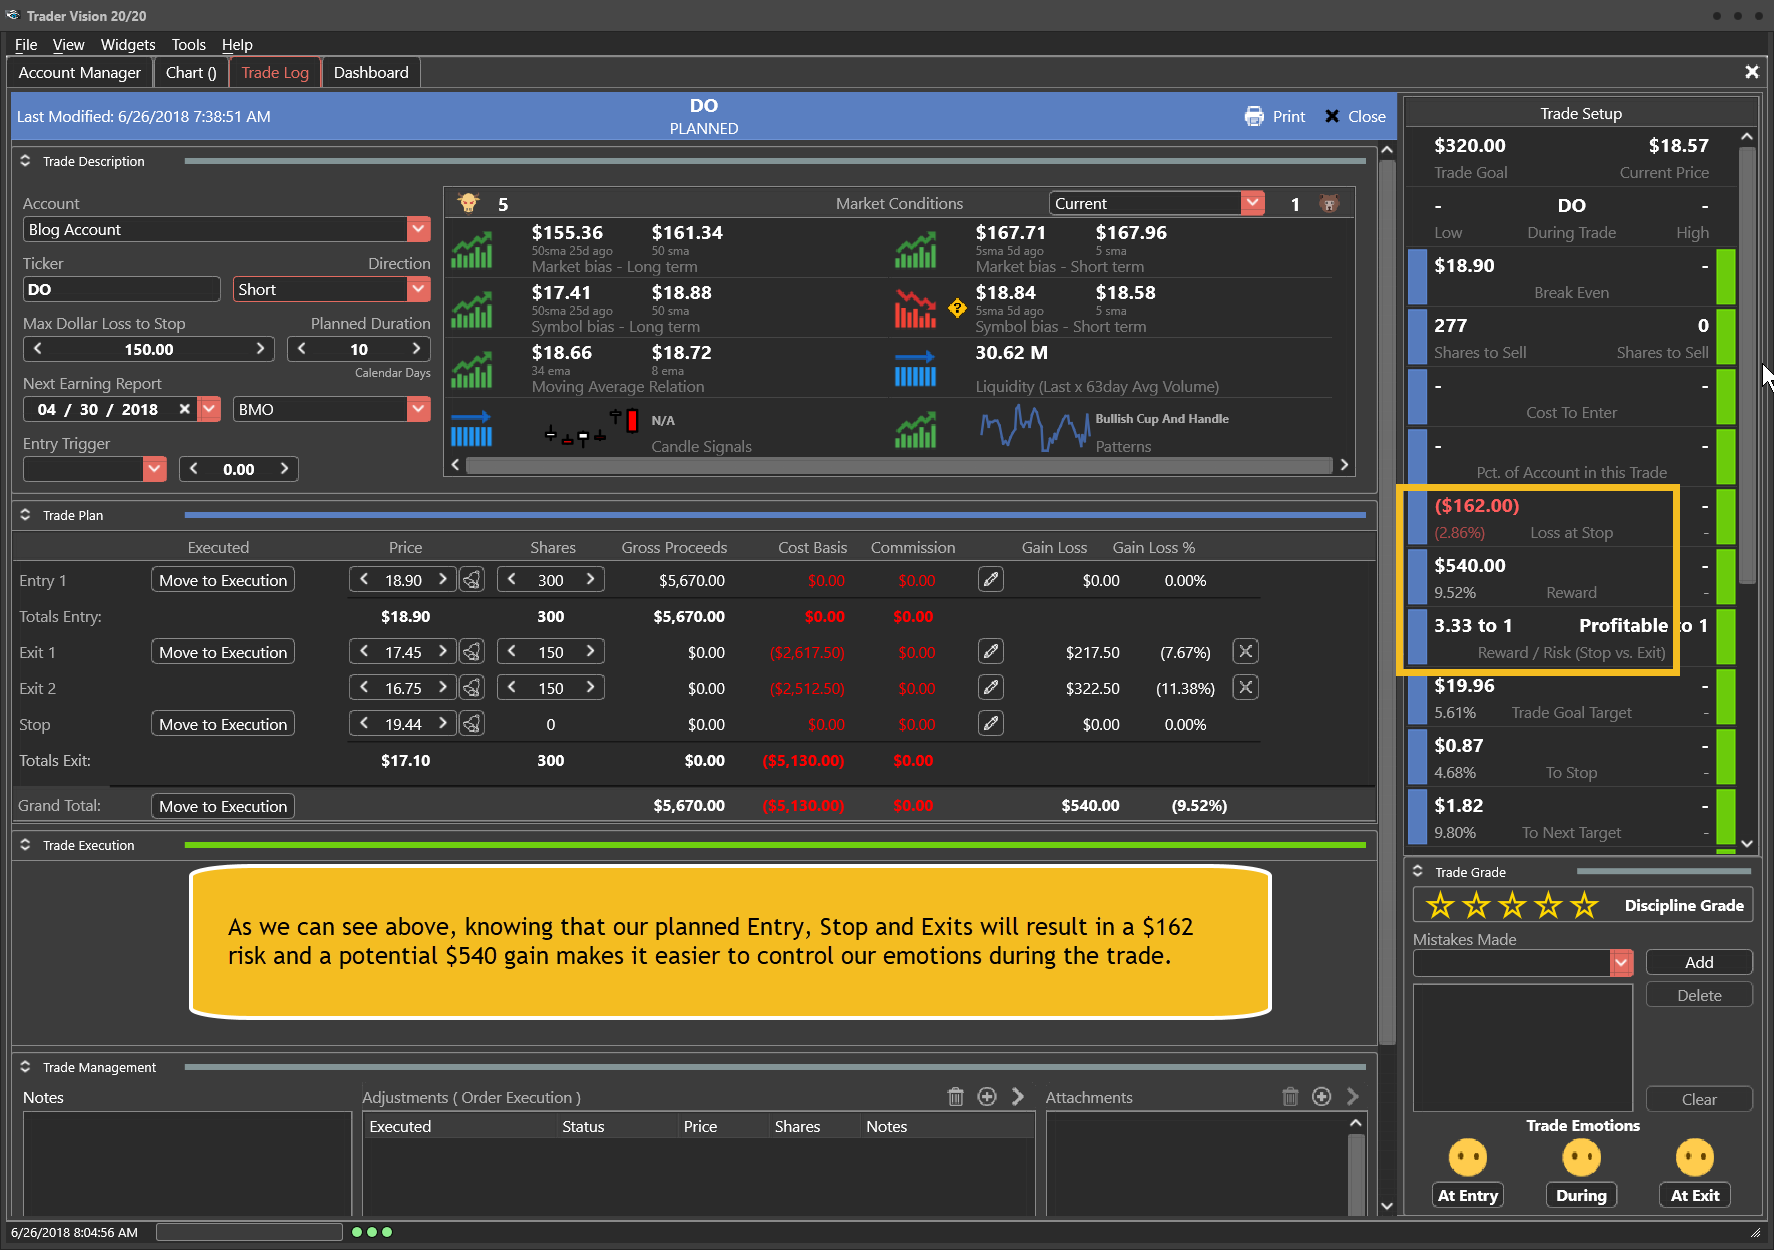
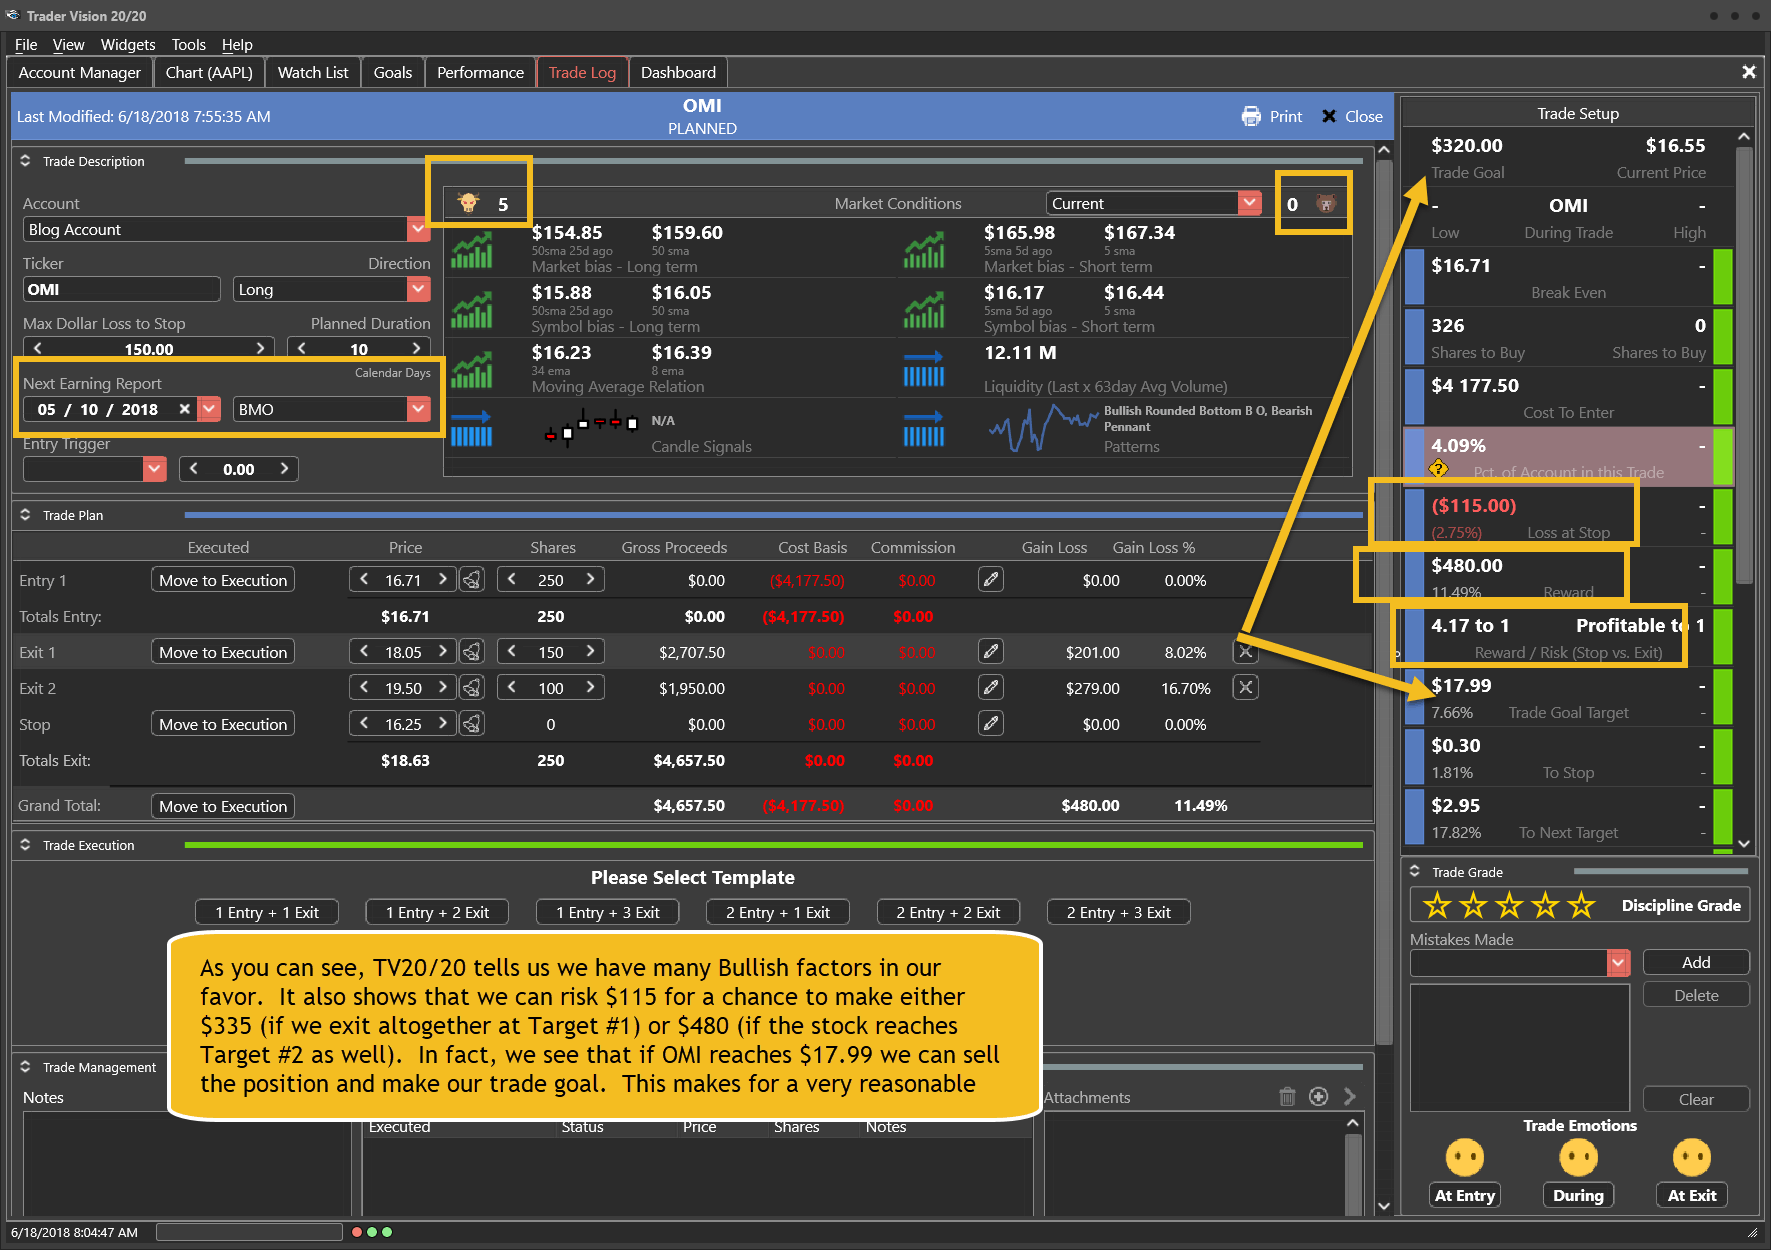
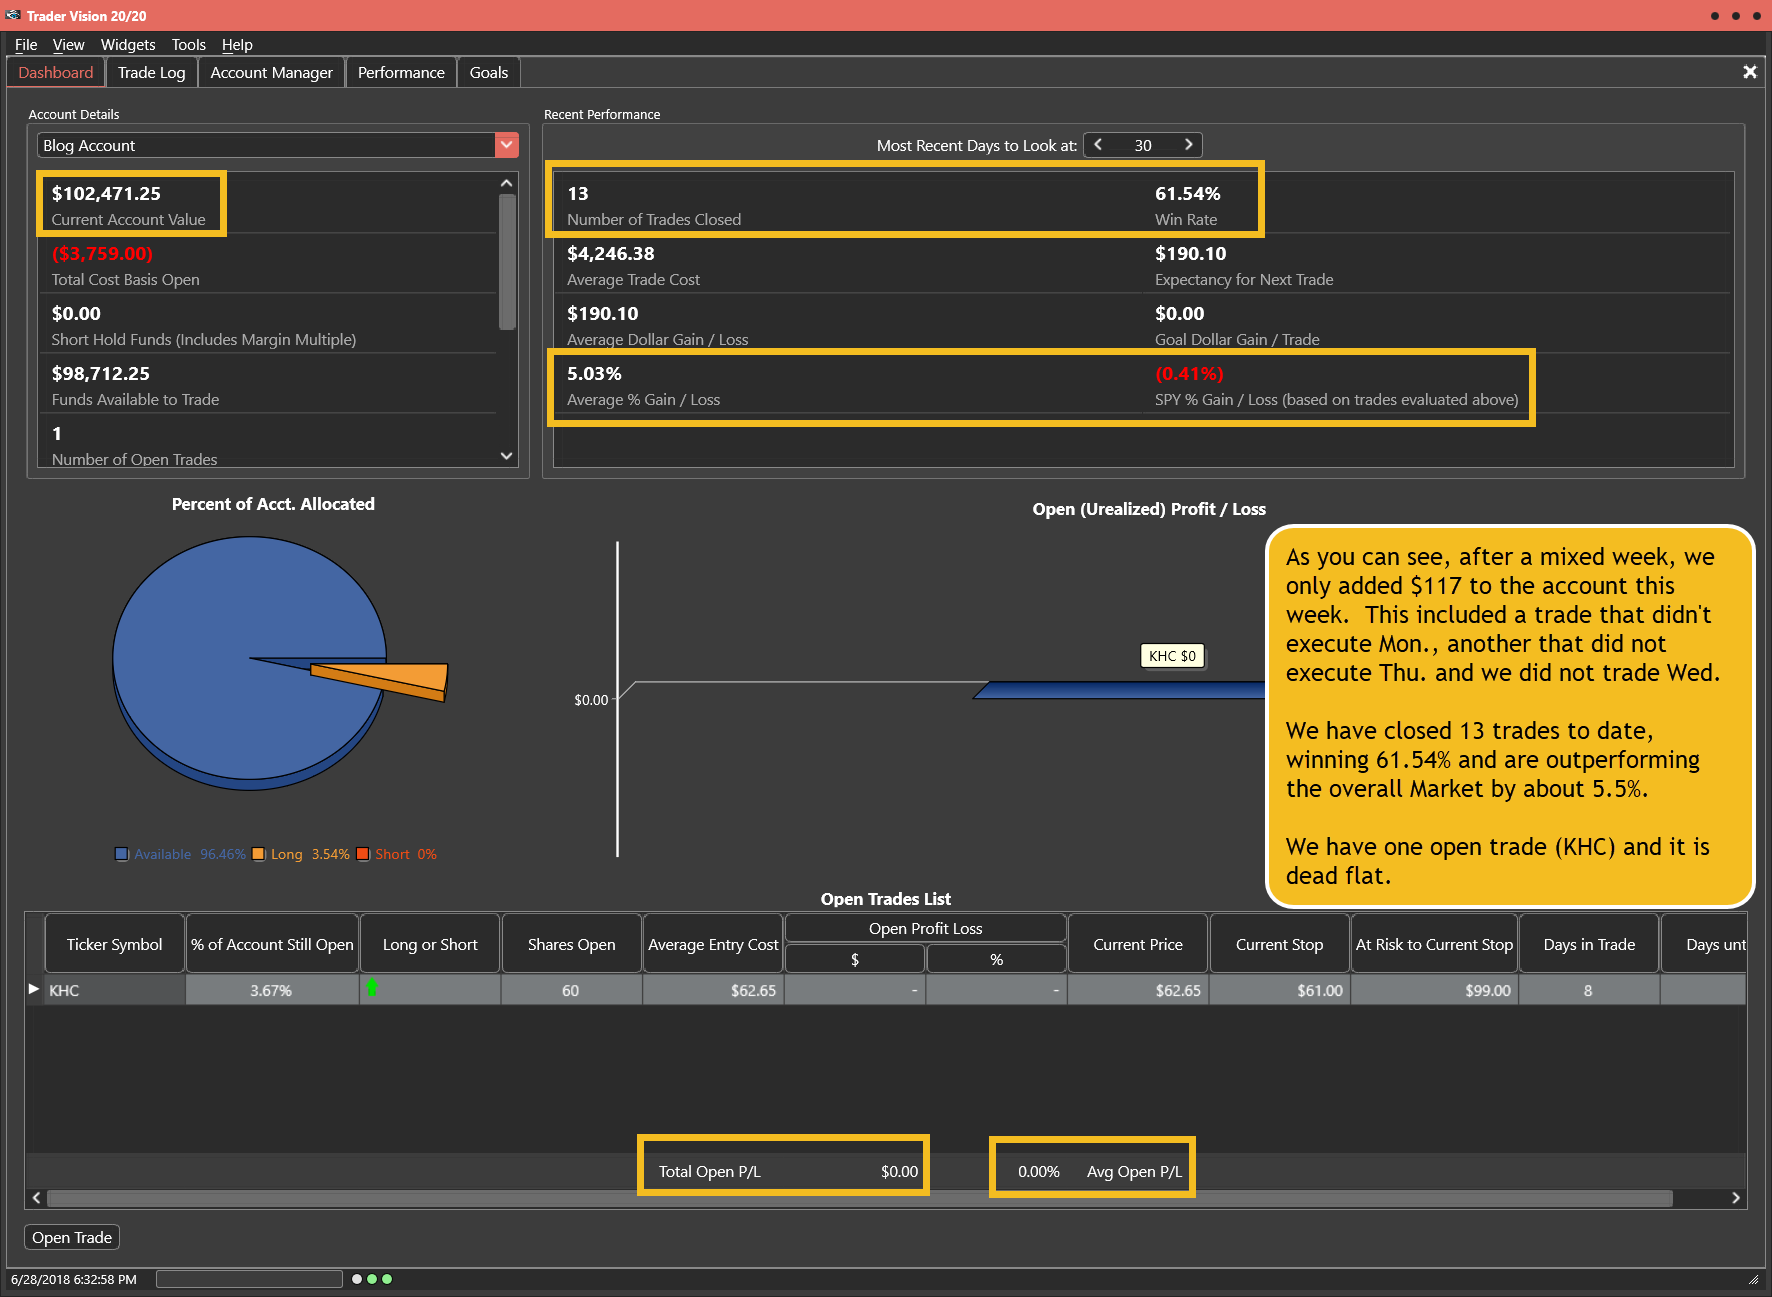
If you click the green button below, you’ll be able to watch a video where I review all closed and Open positions, as well as the unexecuted position that we may open on Friday, depending on the market. I discuss each trade and why I adjust my positions using Trader Vision 20/20 software.
With market action expected to be light on Friday, Monday and Tuesday (in front of the July 4th Holiday) we are opening up the trading room to the public. So, please be our guest and jooin us for some free education. The planned schedule is below and you’ll find our community has a good time while accomplishing a lot. Here is a direct ling to the trading room.
**** Trading Rooms Open House****
Join Us – No Password Required
Date: Friday – June 29, 2018
Date: Monday – July 2, 2018
Date: Tuesday – July 3, 2018
Featured Trade Idea Plan Performance
(As of 6-28-18 Close)
+$2,471.25 over 4 weeks
61.54% Win Rate for $617.81/week profit
-or-
almost 0.6%/week profit on the Account (32% Annual without compounding)
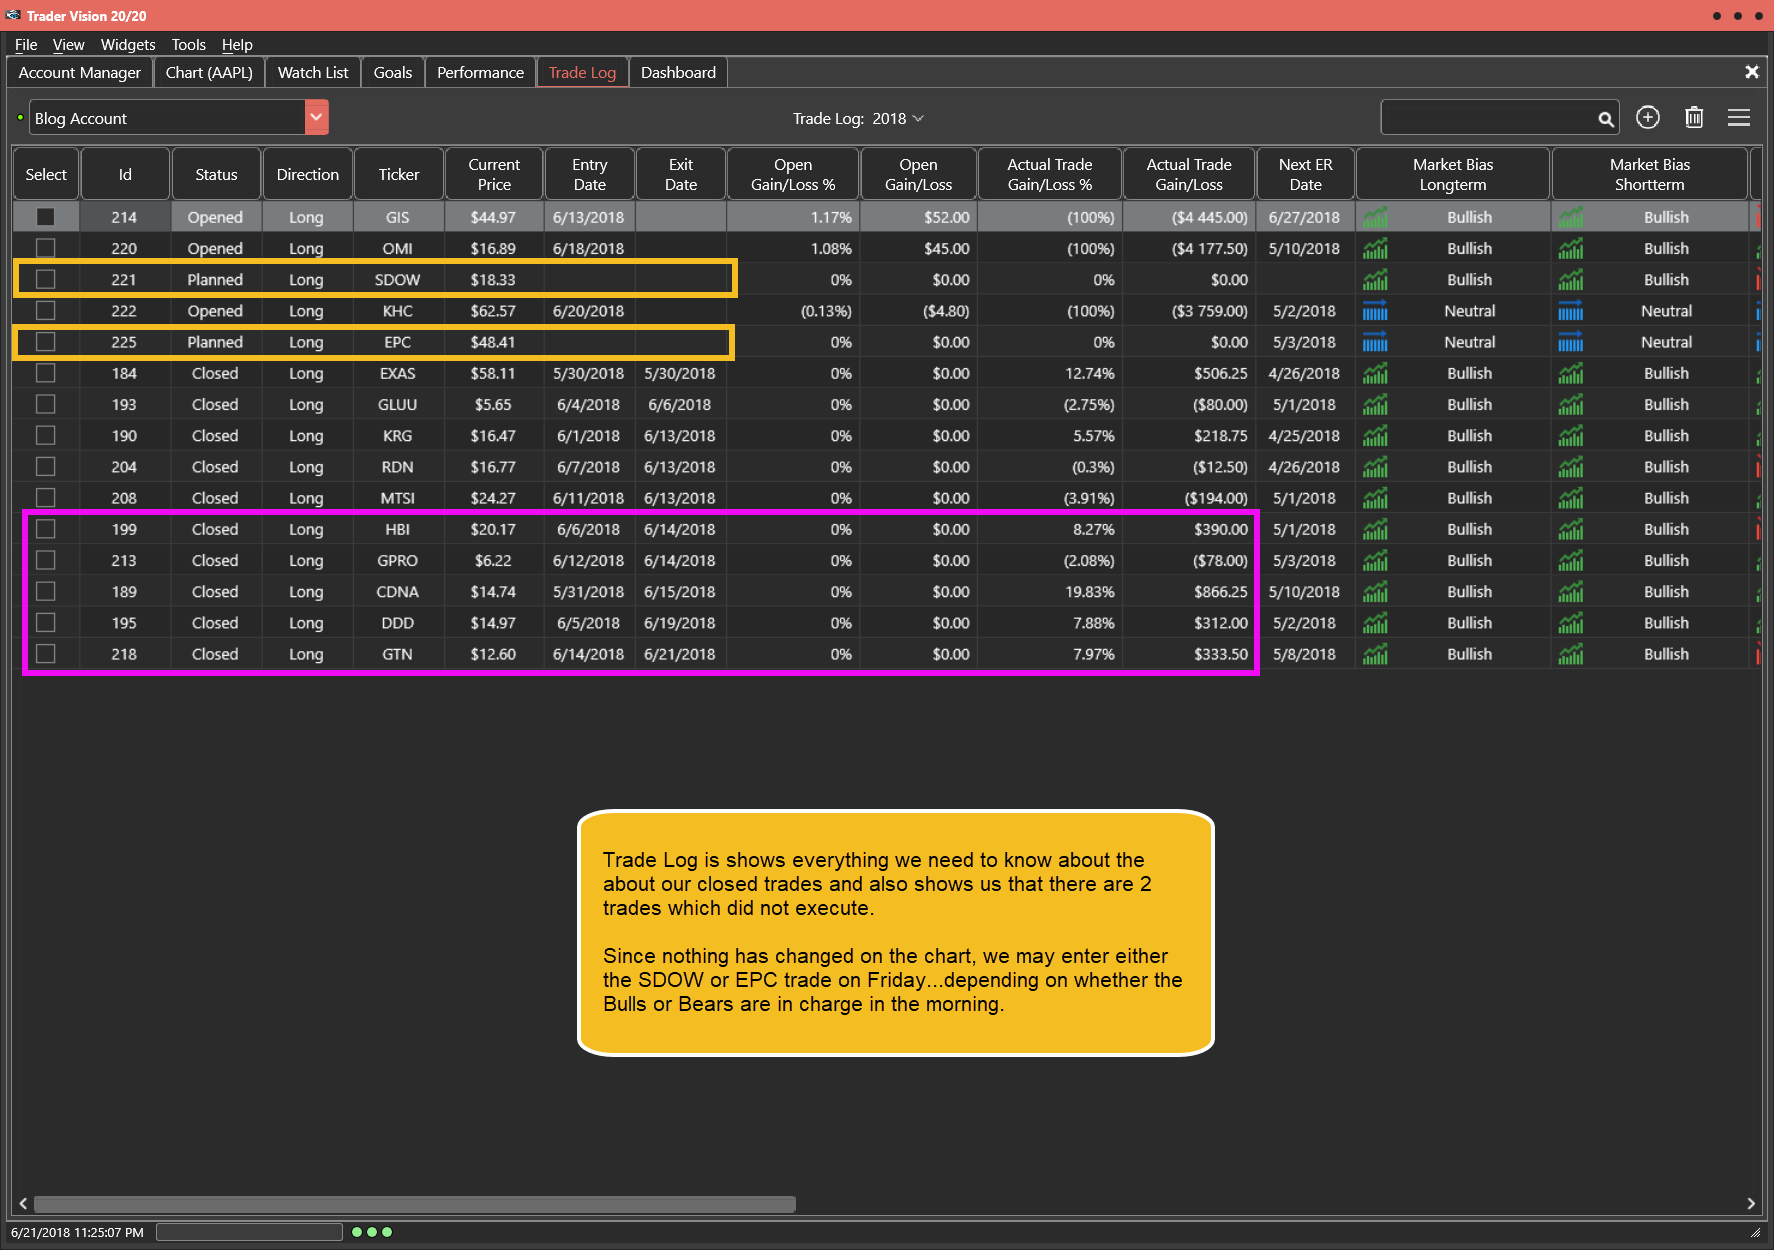
Blog Trade Log as of 6-28-18 Close
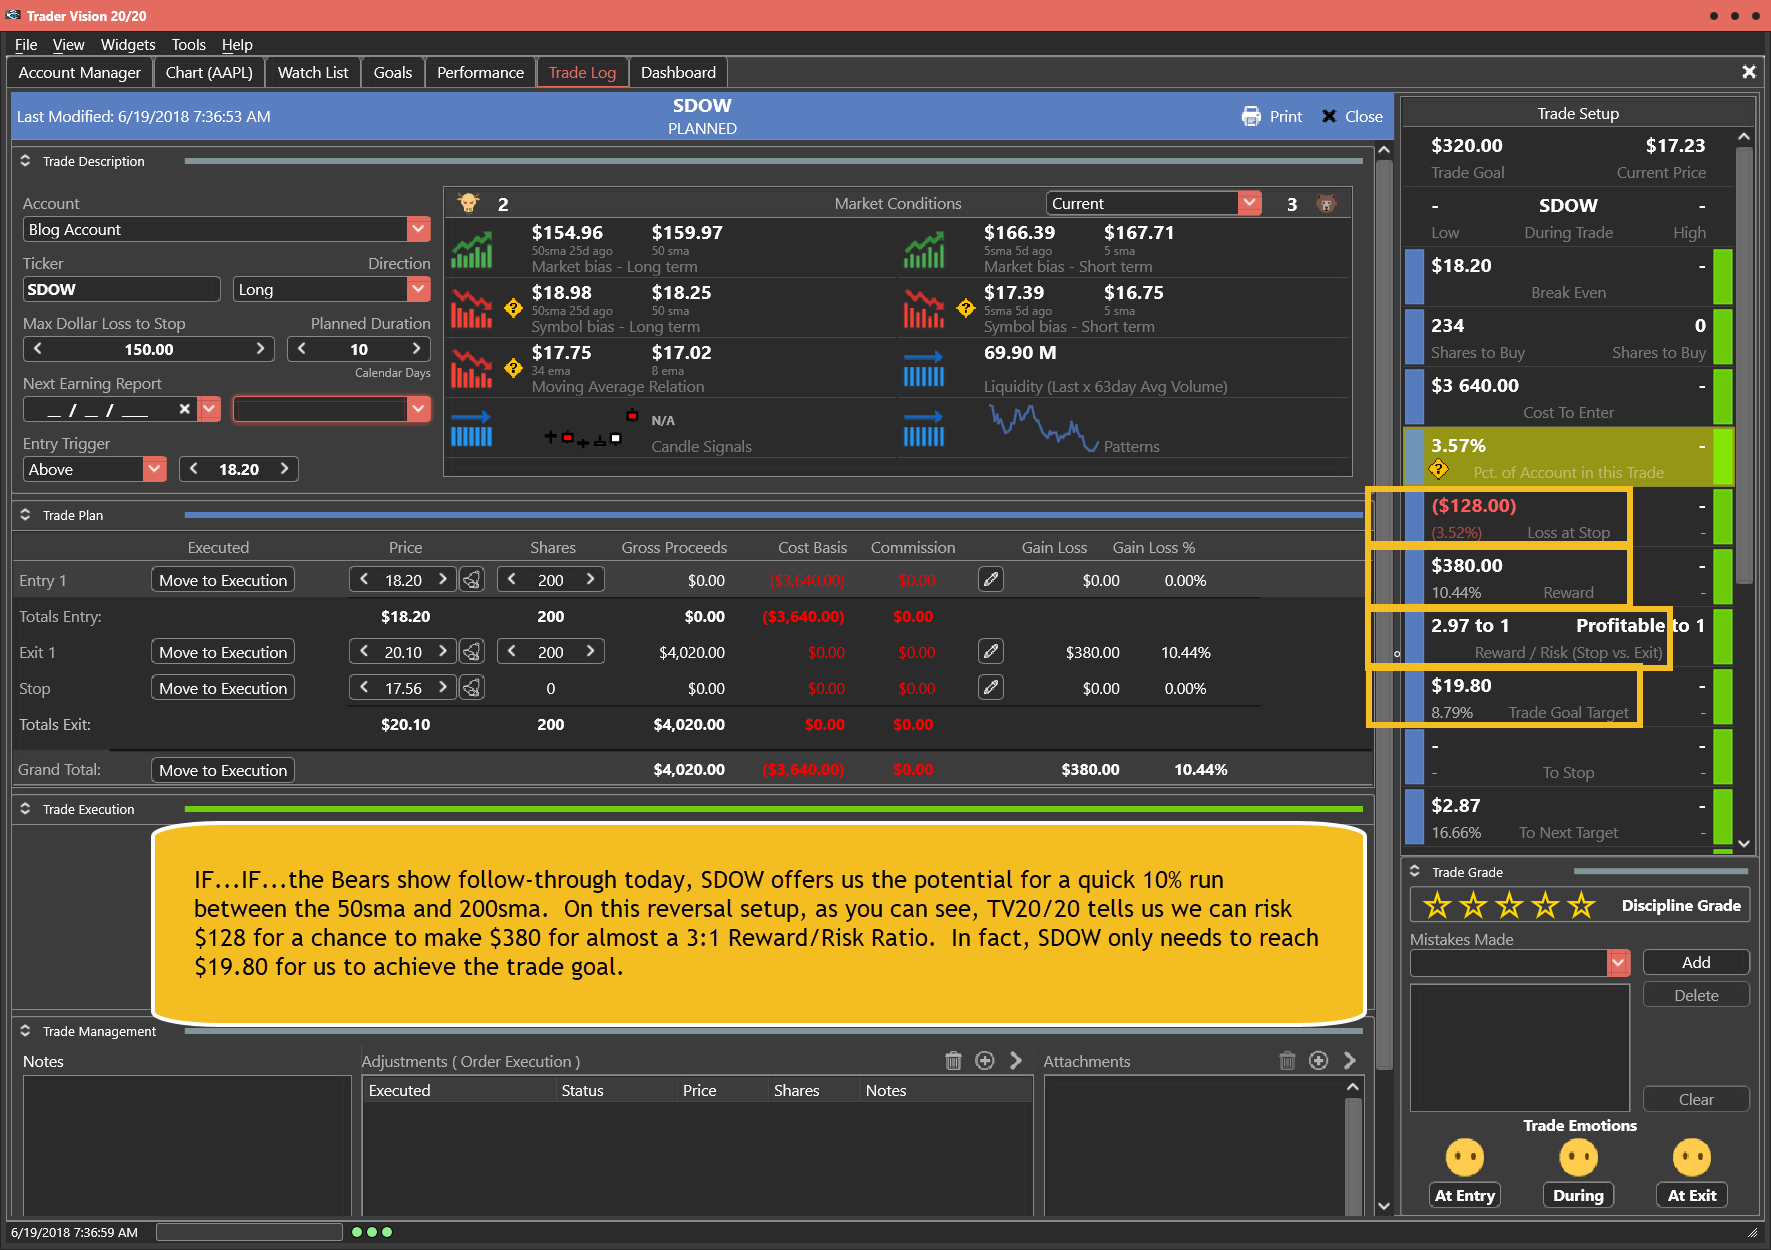
Note how Trader Vision 20/20 does so much of the work for you. All of your trades are logged, in incredible detail. This will allow you to analyze patterns in your trading, identifying problems and improving your performance. You’ll also be able to get back inside your own head even if you revisit the trade years later. Having all this information give you the ability to keep improving and reducing the emotional roller coaster that the amateurs face every day!
[button_2 color=”light-green” align=”center” href=”https://youtu.be/_YgjaA_9lNg” new_window=”Y”]Trade Review Video[/button_2]
If you’re interested in putting the power to Trader Vision 20/20 to work for you, click below.
[button_2 color=”orange” align=”center” href=”https://hitandruncandlesticks.com/product/trader-vision-20-20-monthly-subscription2/” new_window=”Y”]TV20/20 Software[/button_2]
***************************************************************************************************
Investing and Trading involve significant financial risk and are not suitable for everyone. Ed Carter is not a licensed financial adviser nor does he offer trade recommendations or investment advice to anyone. No communication from Hit and Run Candlesticks Inc. is to be considered financial or trading advice. All information is intended for Educational Purposes Only. Terms of Service.
***************************************************************************************************