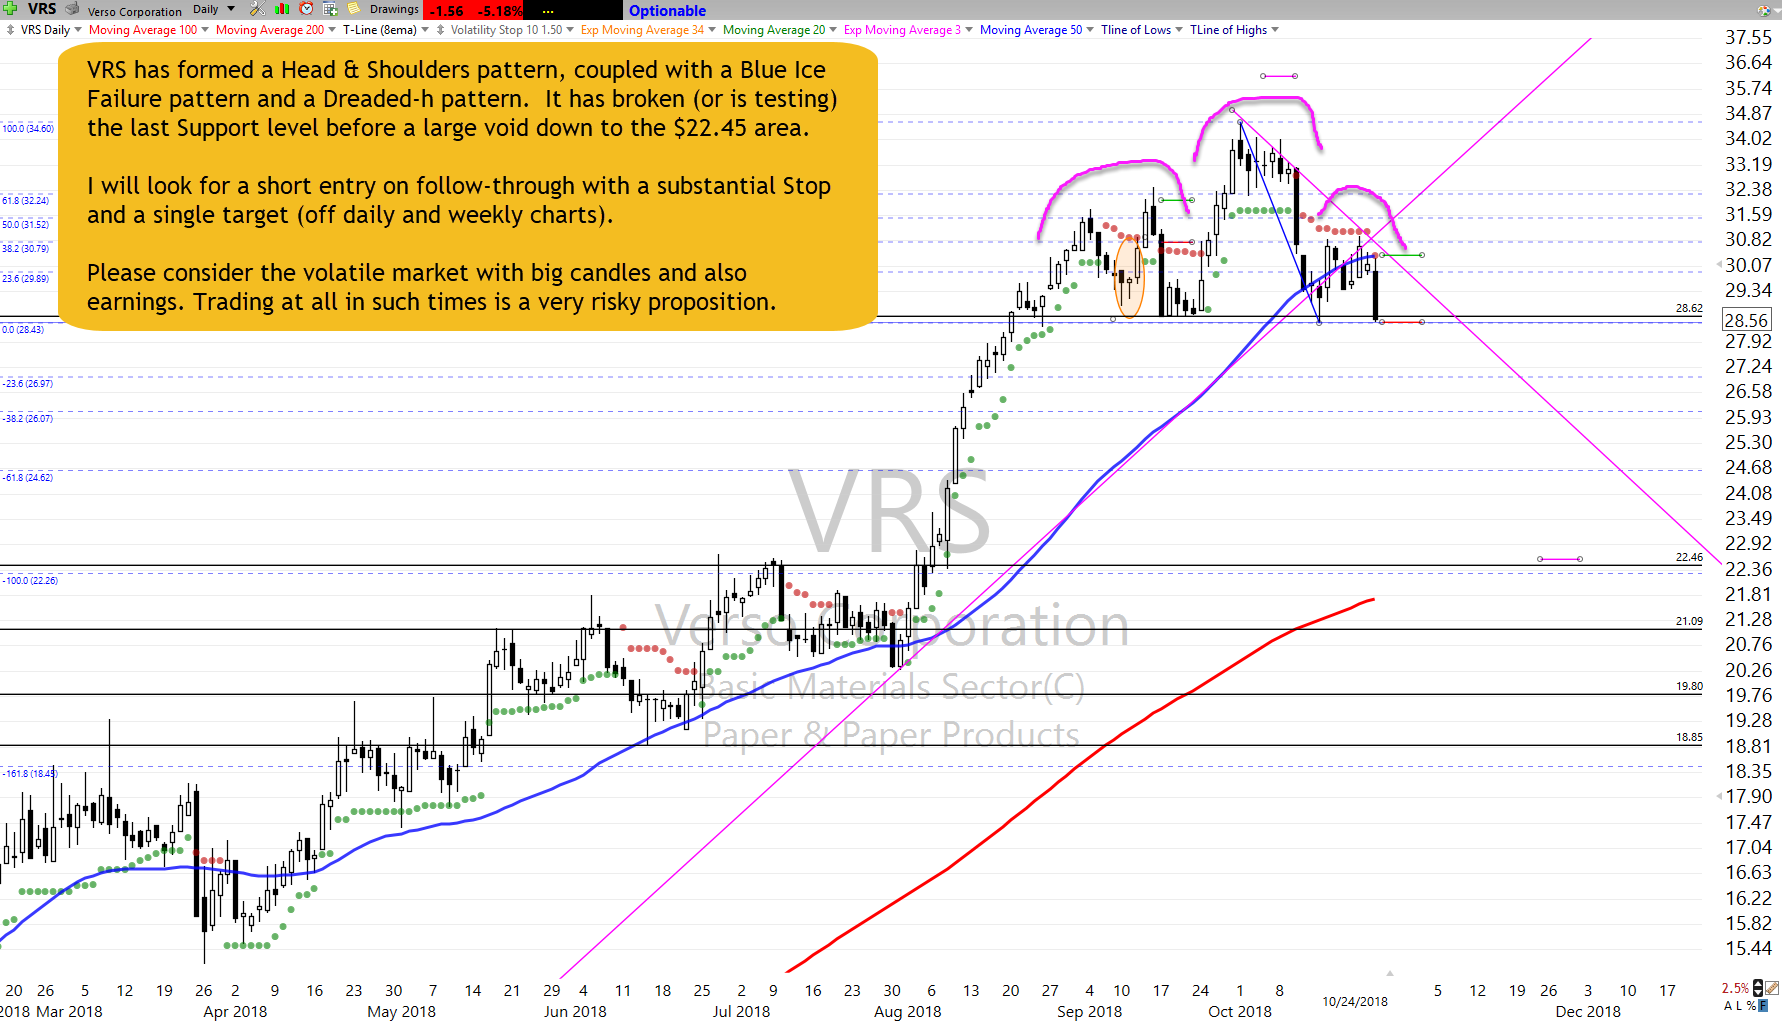
QNST Setup and Trade Plan

Today’s Featured Trade Idea is QNST.

Members can join us in Trading Room #1 as Rick reviews this setup and other Trade-Ideas at 9:10am Eastern.  For now, here are my own analysis and a potential trade plan made using our Trader Vision 20/20 software.

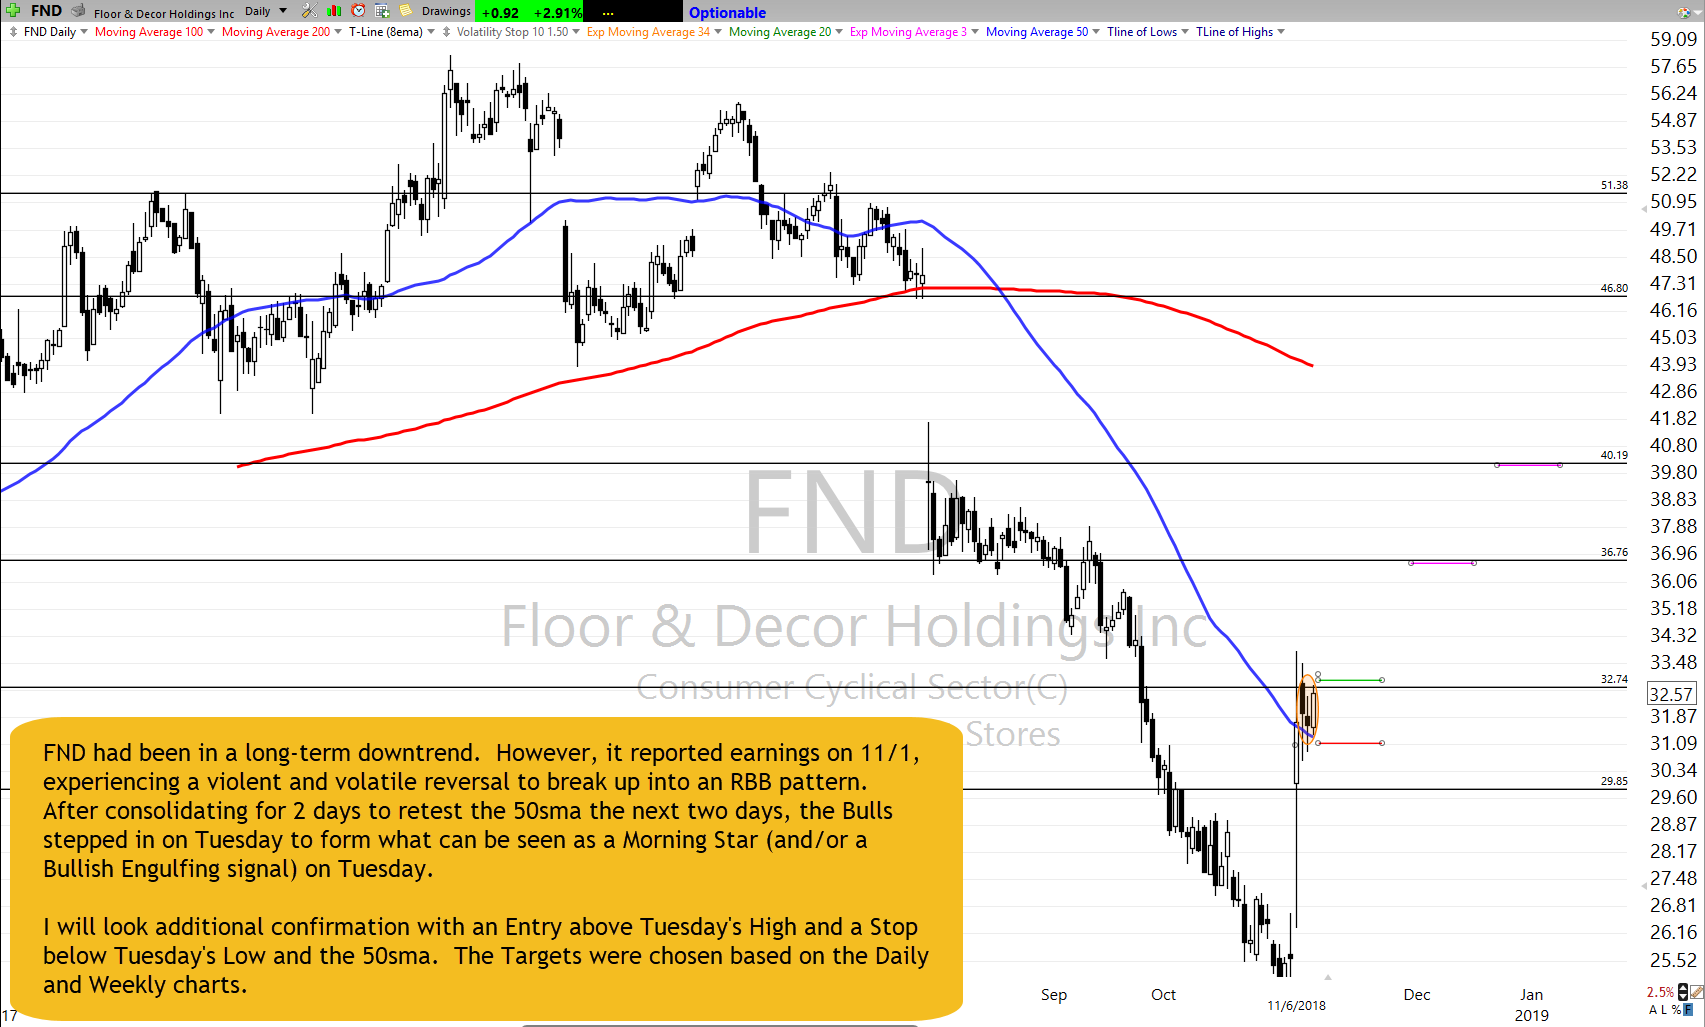
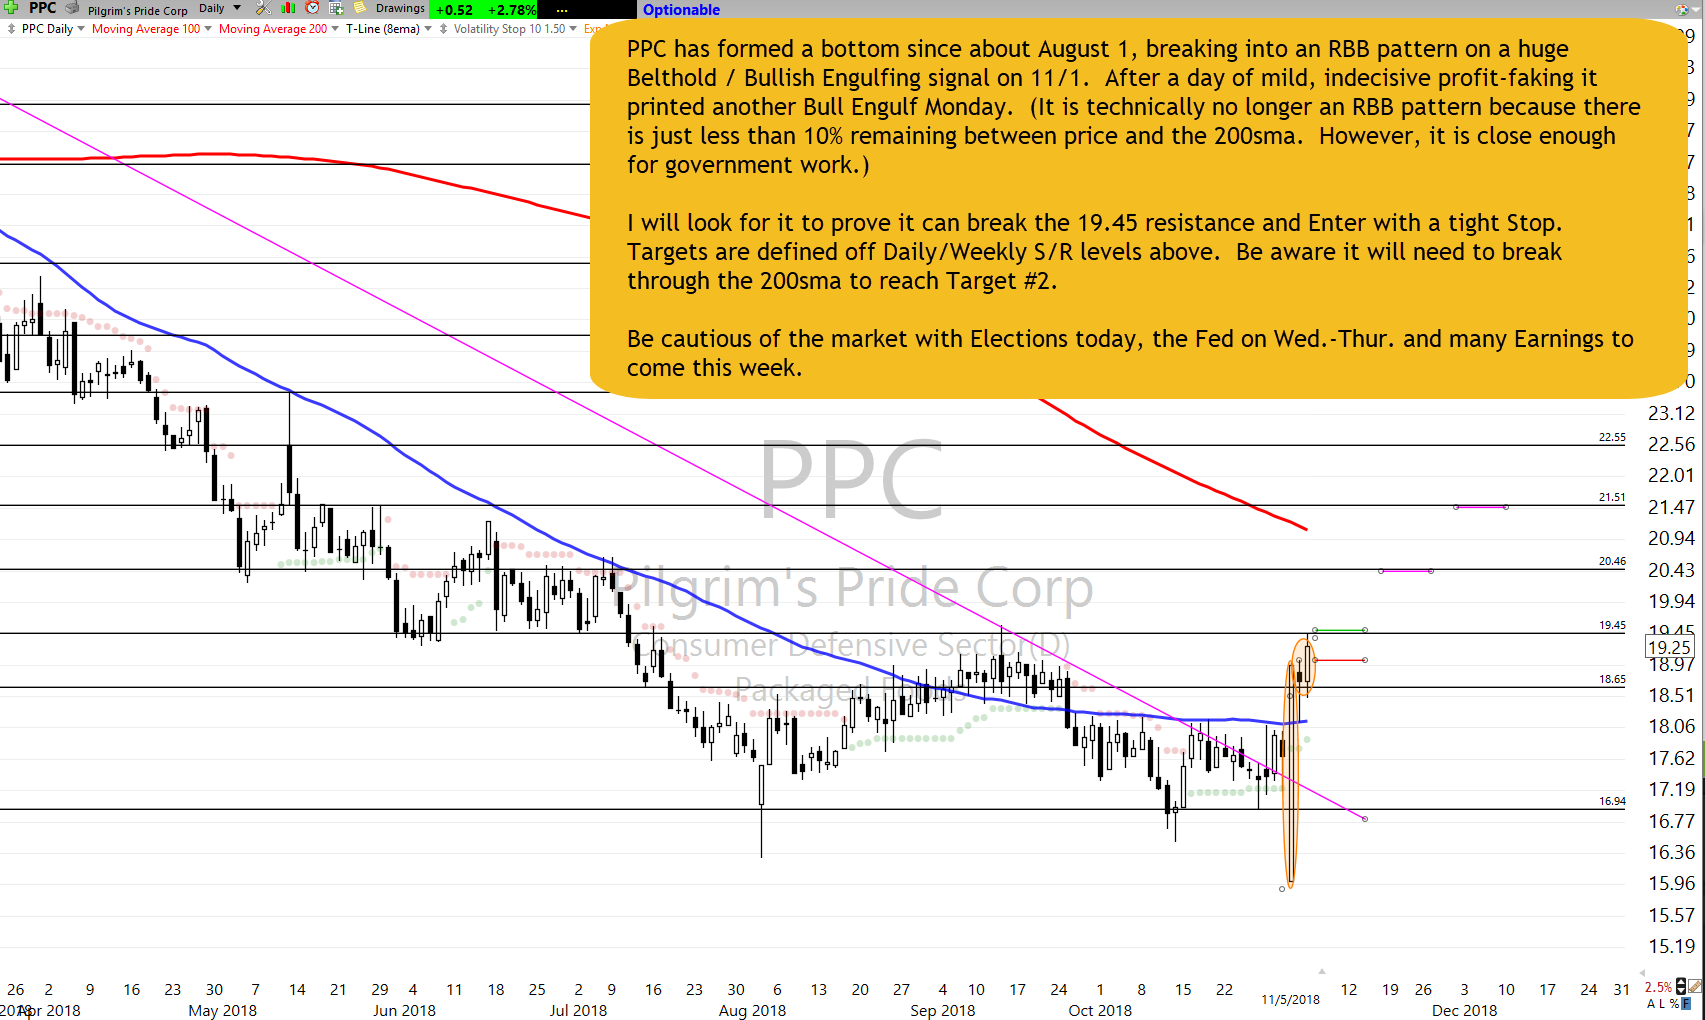
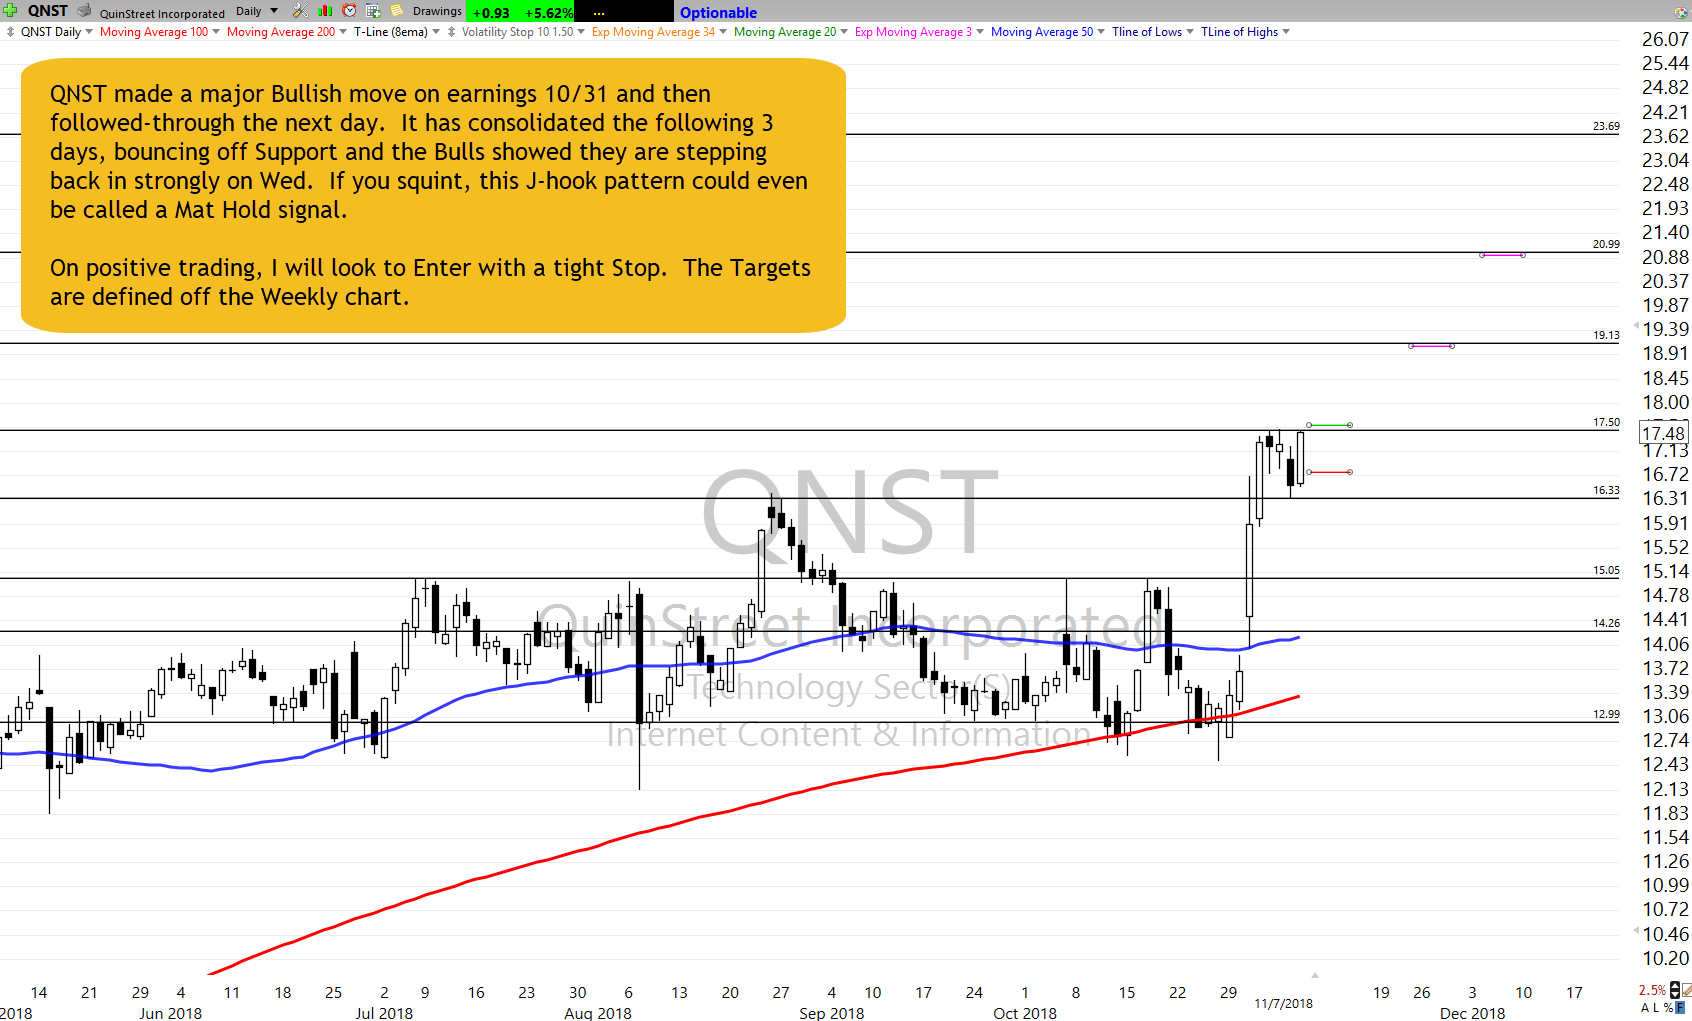
QNST made a major Bullish move on earnings 10/31 and then followed-through the next day. It has consolidated the following 3 days, bouncing off Support and the Bulls showed they are stepping back in strongly on Wed. If you squint, this J-hook pattern could even be called a Mat Hold signal.

On positive trading, I will look to Enter with a tight Stop. The Targets are defined off the Weekly chart.

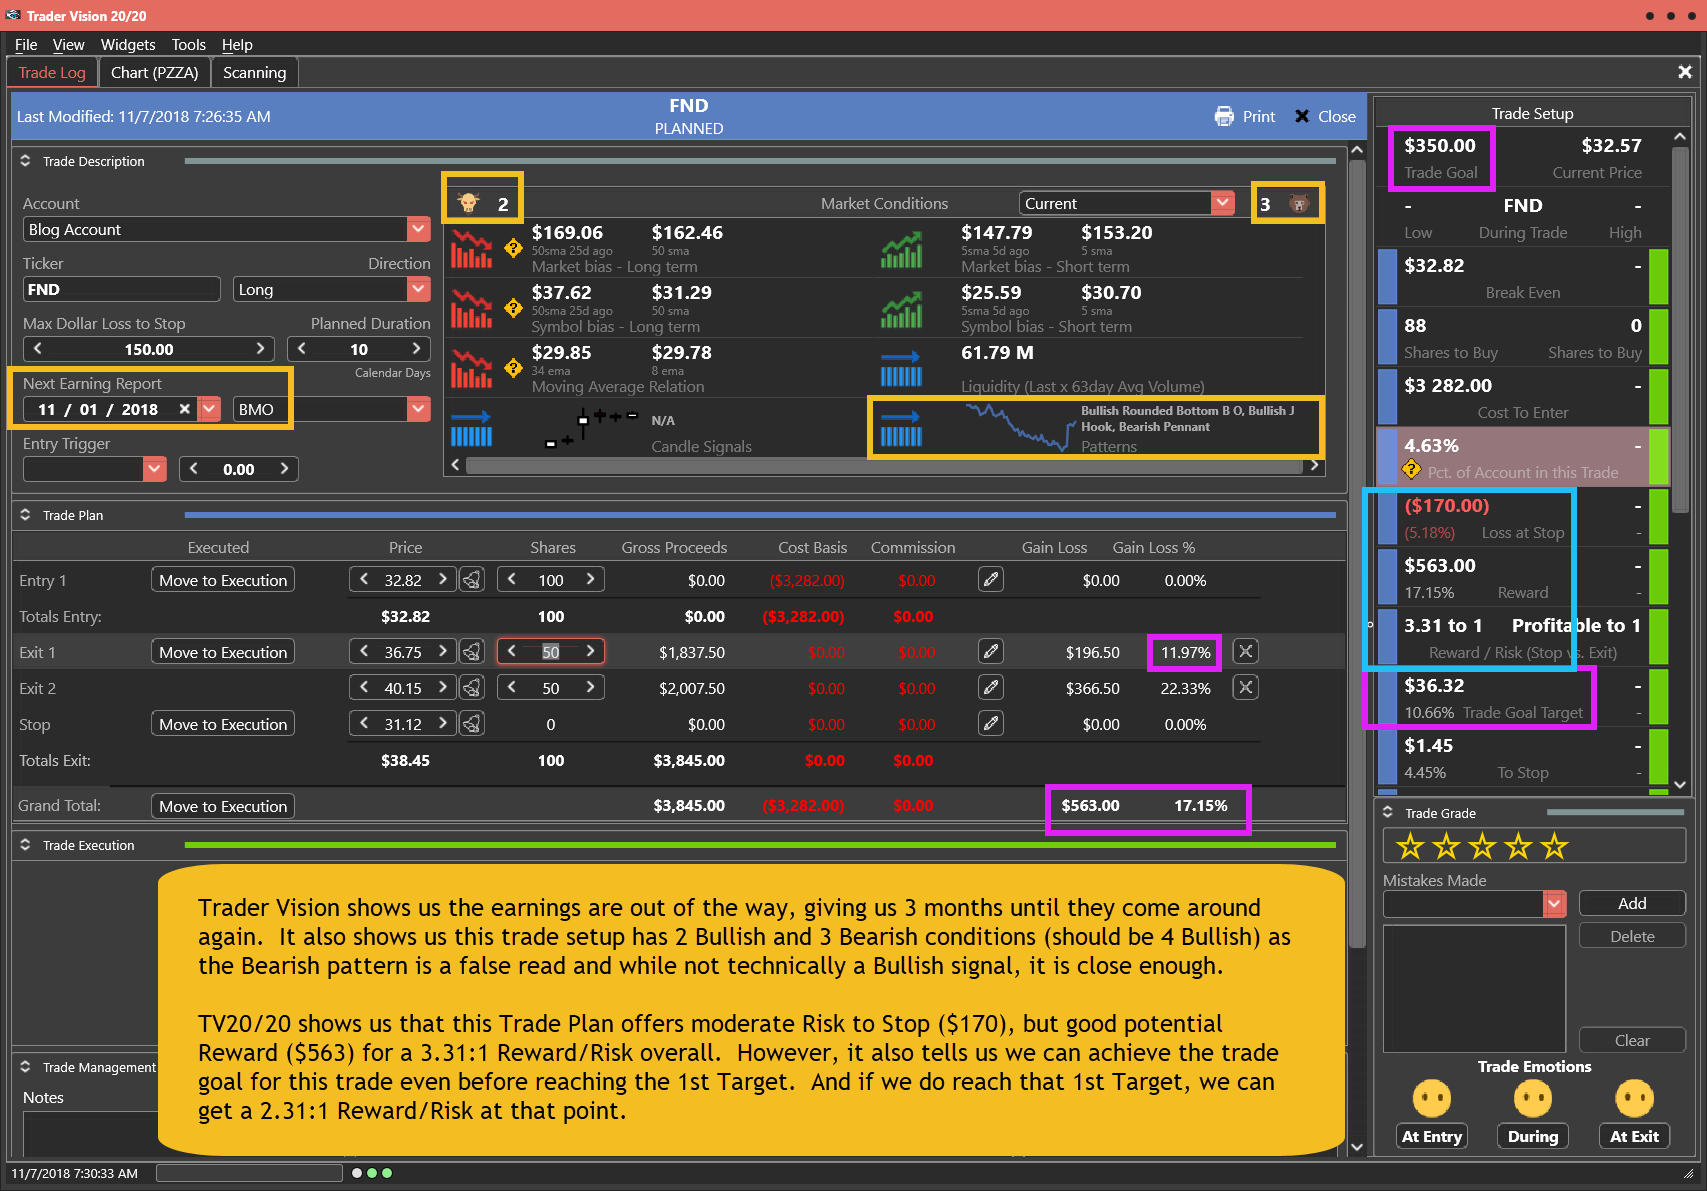
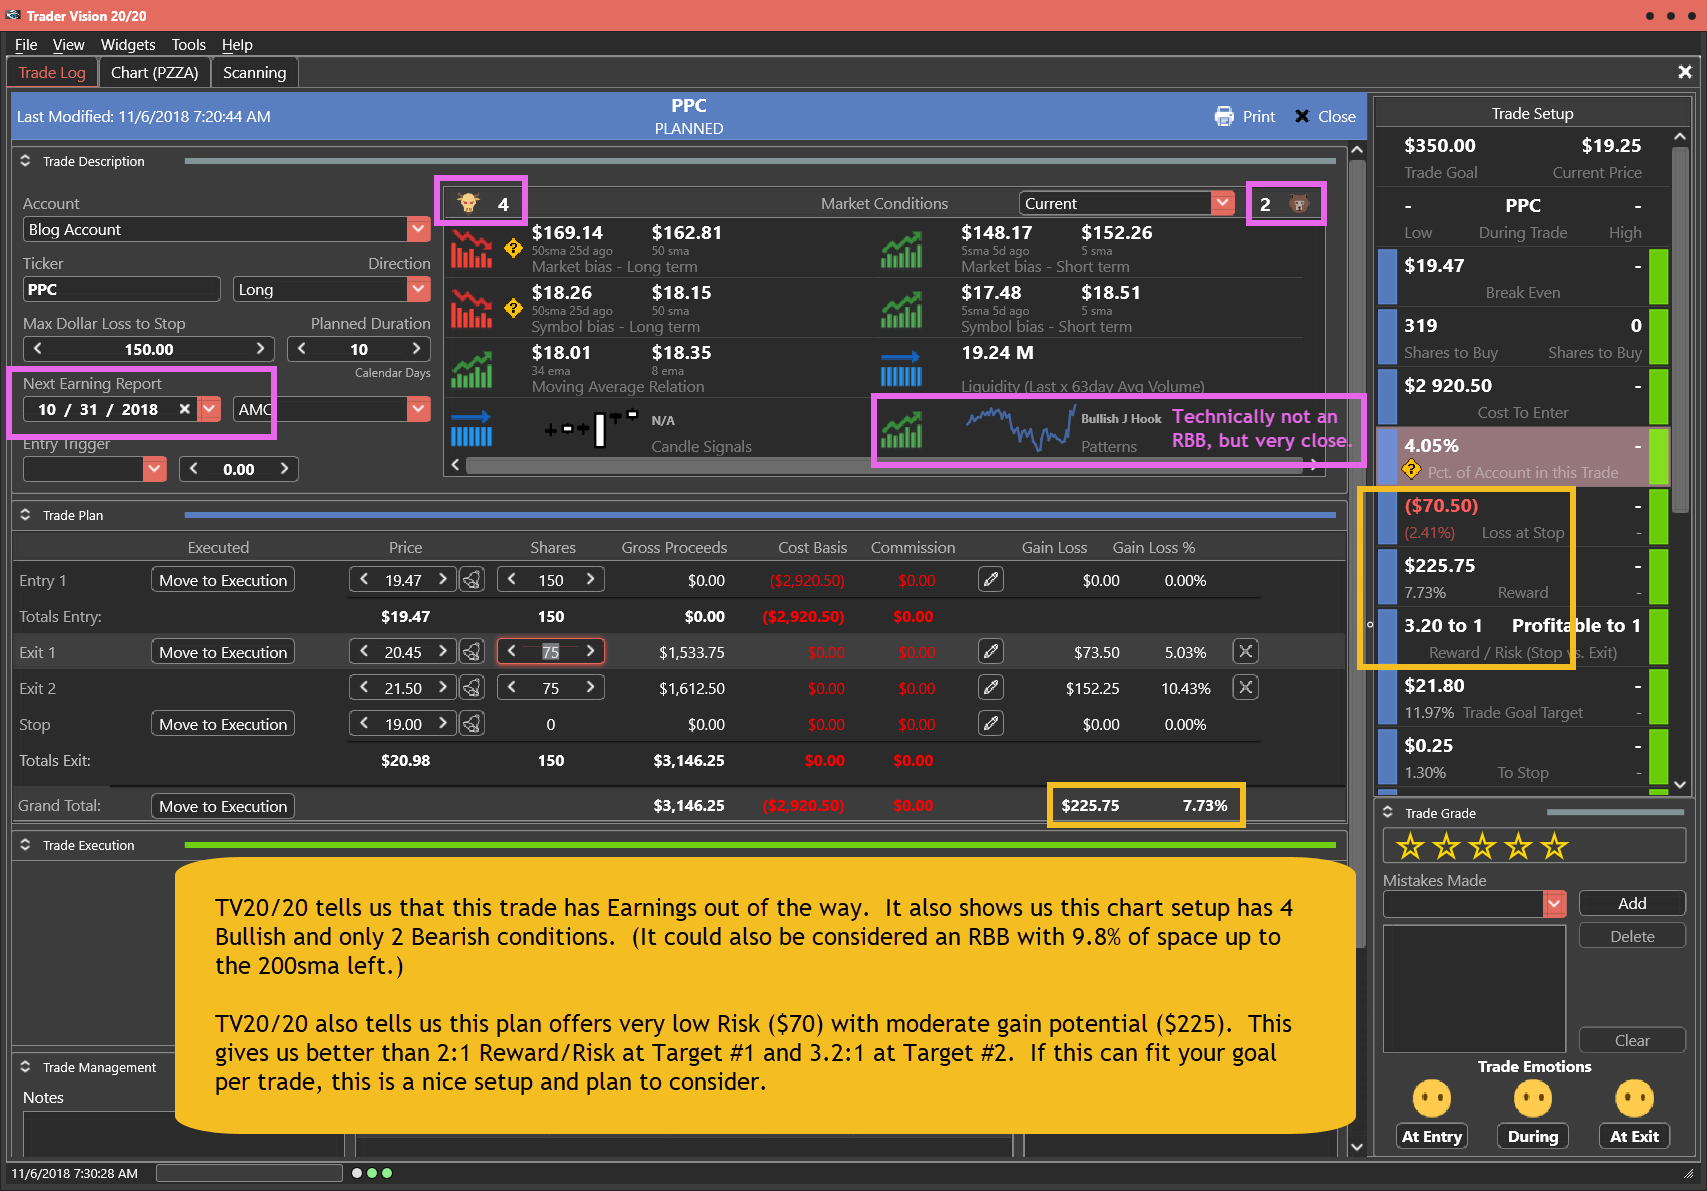
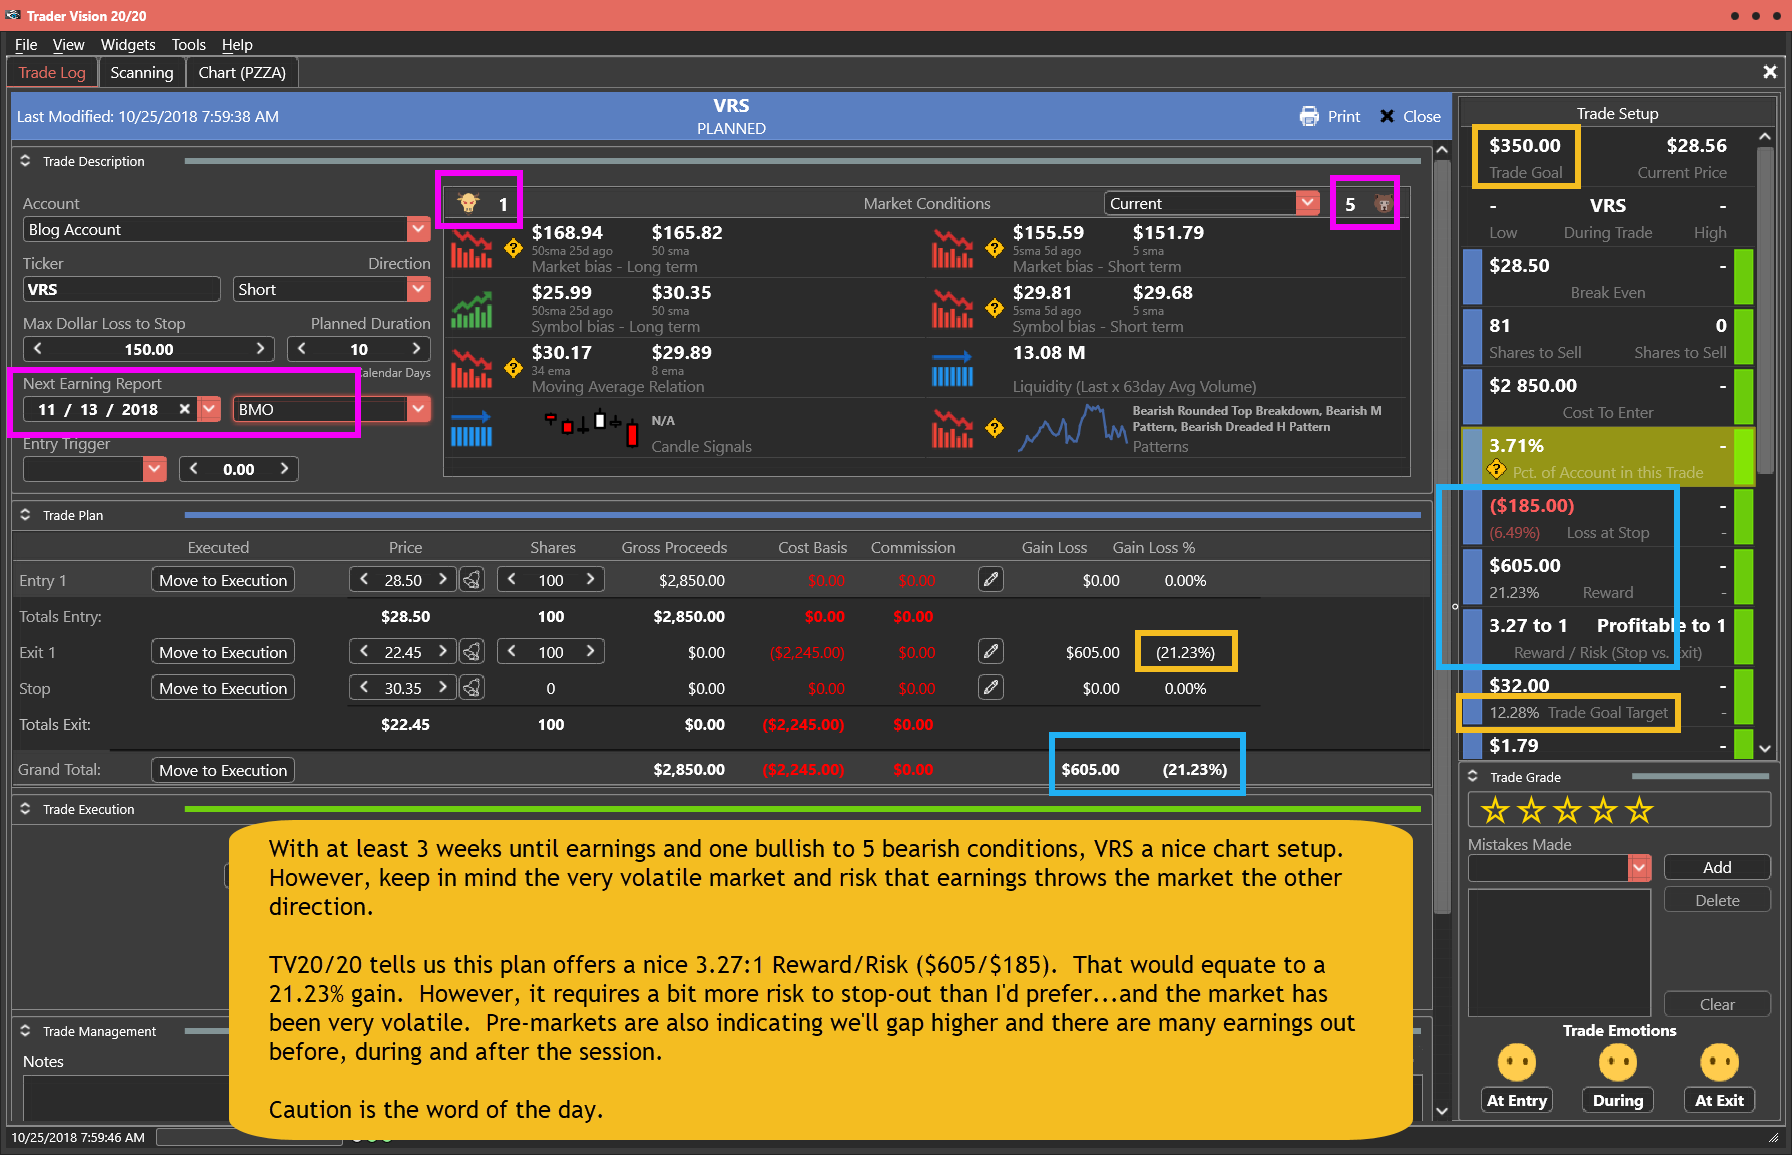
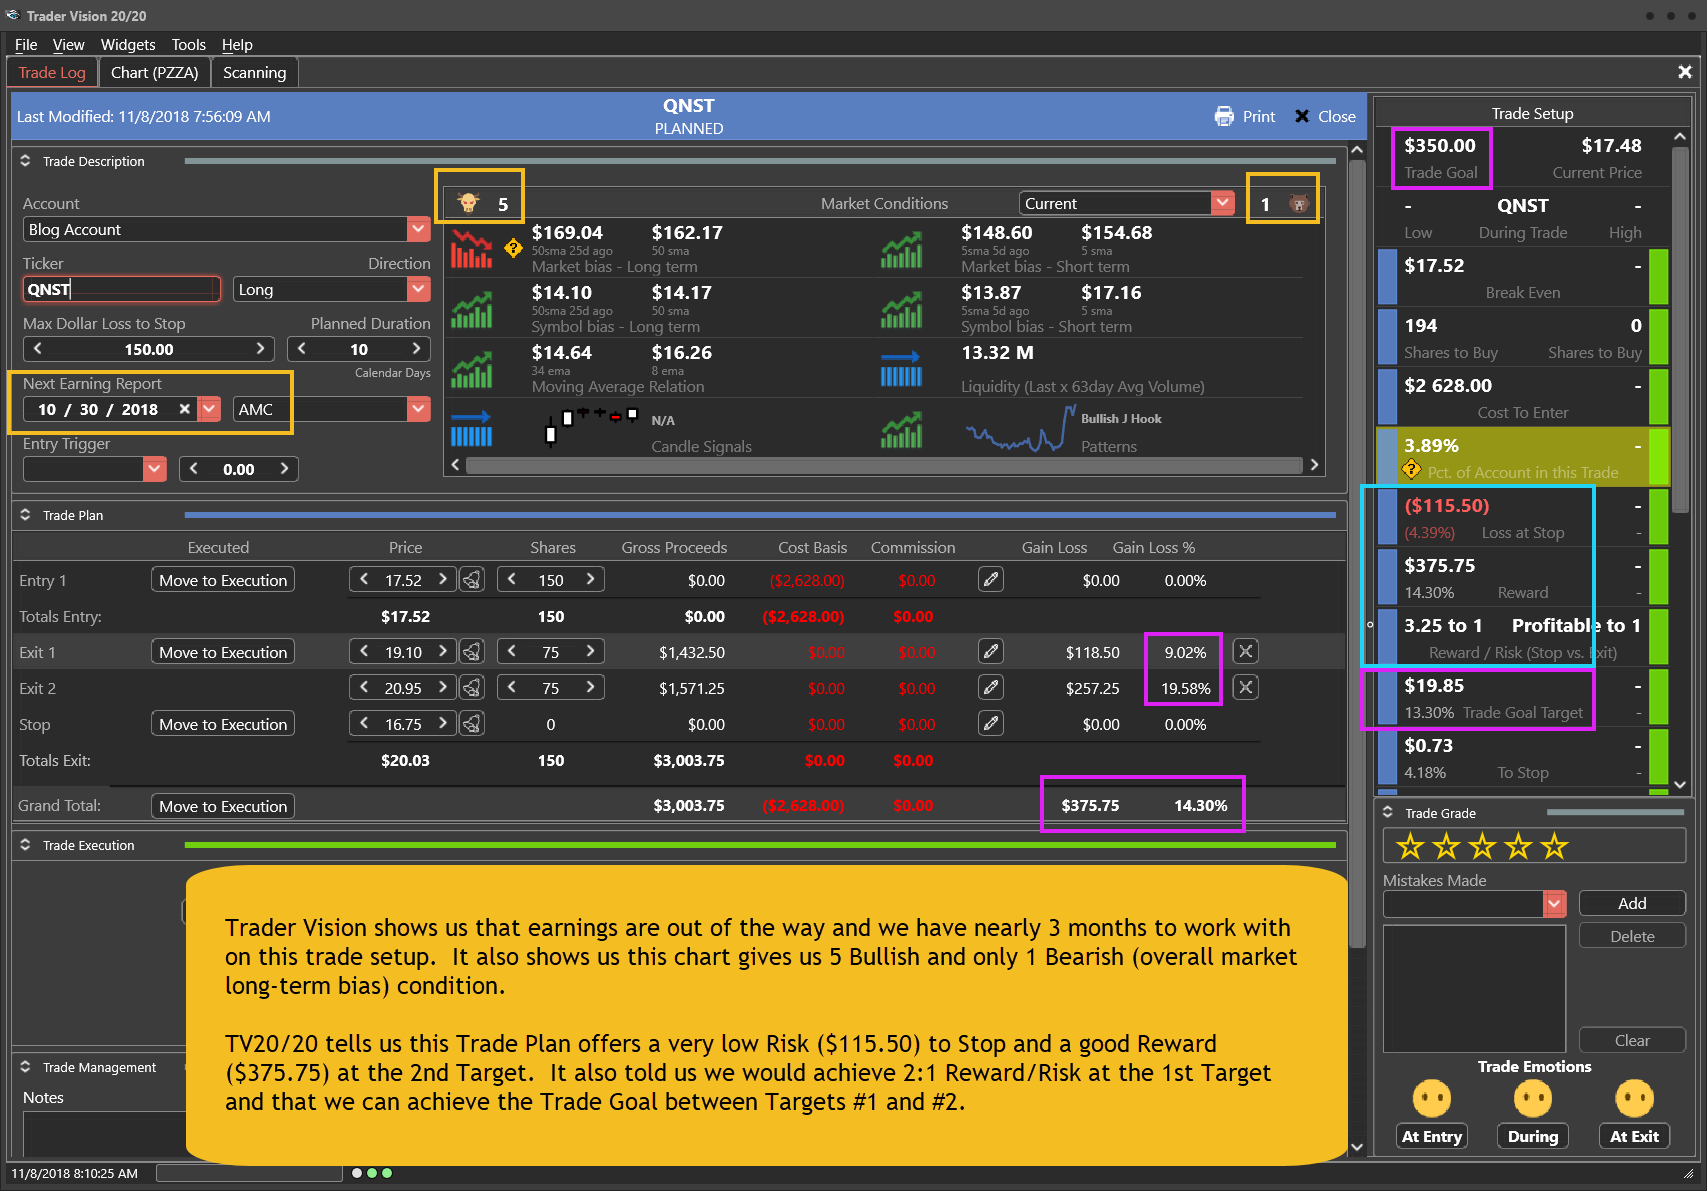
Trader Vision shows us that earnings are out of the way and we have nearly 3 months to work with on this trade setup. It also shows us this chart gives us 5 Bullish and only 1 Bearish (overall market long-term bias) condition.

TV20/20 tells us this Trade Plan offers a very low Risk ($115.50) to Stop and a good Reward ($375.75) at the 2nd Target. It also told us we would achieve 2:1 Reward/Risk at the 1st Target and that we can achieve the Trade Goal between Targets #1 and #2.

Having this knowledge before a trade is even entered makes it much easier to control emotions and maintain discipline.

Below is my markup of the chart and the trade plan as laid out by Trader Vision 20/20.  As a bonus, if you click the green button below, you’ll be able to watch a video of the chart markup and trade planning process.

The QNST Trade Setup – As of 11-7-18

QNST Chart Setup as of 11-7-18

The Trade Plan

QNST Trade Plan for 11-8-18

Note how Trader Vision 20/20 does so much of the work for you.  Knowing the ratio of Bullish Conditions to Bearish ones as well as the overall risk of the position size, the risk to Stop out and the Reward possible at each Target price can help a great deal with controlling our emotions.  Knowing the dollar impact of every scenario ahead of time, allows us to make calm decisions during the trade.  It really takes the pressure off.  No guesswork.  No surprises.  No emotional roller coaster.

To see a short video of this trade’s chart markup and trade planning, click the button below.


Put the power to Trader Vision 20/20 to work for you…


Testimonial

Trader Vision immediately simplified the process…immediately it provided that information and guidance to me. I knew what I would risk for how much reward, I began taking trades off at the 1st target, 2nd target, I was no longer holding all my trades for the homerun. I also began implementing the stop losses if and when they were reached, not just hoping the stock would recover.  It then became easier to see what patterns were working for me and which were not.  It provided a much more relaxed and stress-free environment. –Joan G


***************************************************************************************************

Investing and Trading involve significant financial risk and are not suitable for everyone. Ed Carter is not a licensed financial adviser nor does he offer trade recommendations or investment advice to anyone. No communication from Hit and Run Candlesticks Inc. is to be considered financial or trading advice. All information is intended for Educational Purposes Only. Terms of Service.

***************************************************************************************************

FND Setup and Trade Plan

Today’s Featured Trade Idea is FND.

Be Careful: With the Fed Meeting on Wed-Thu and a lot of earnings the next couple days…markets will likely be volatile.  Just remember the trend is still Bearish until we have a higher low and higher high.

Members can join us in Trading Room #1 as Rick reviews this setup and other Trade-Ideas at 9:10am Eastern.  For now, here are my own analysis and a potential trade plan made using our Trader Vision 20/20 software.

FND had been in a long-term downtrend. However, it reported earnings on 11/1, experiencing a violent and volatile reversal to break up into an RBB pattern. After consolidating for 2 days to retest the 50sma the next two days, the Bulls stepped in on Tuesday to form what can be seen as a Morning Star (and/or a Bullish Engulfing signal) on Tuesday.

I will look additional confirmation with an Entry above Tuesday’s High and a Stop below Tuesday’s Low and the 50sma. The Targets were chosen based on the Daily and Weekly charts.

Trader Vision shows us the earnings are out of the way, giving us 3 months until they come around again. It also shows us this trade setup has 2 Bullish and 3 Bearish conditions (should be 4 Bullish) as the Bearish pattern is a false read and while not technically a Bullish signal, it is close enough.

TV20/20 shows us that this Trade Plan offers moderate Risk to Stop ($170), but good potential Reward ($563) for a 3.31:1 Reward/Risk overall. However, it also tells us we can achieve the trade goal for this trade even before reaching the 1st Target. And if we do reach that 1st Target, we can get a 2.31:1 Reward/Risk at that point.

Having this knowledge before a trade is even entered makes it much easier to control emotions and maintain discipline.

Below is my markup of the chart and the trade plan as laid out by Trader Vision 20/20.  As a bonus, if you click the green button below, you’ll be able to watch a video of the chart markup and trade planning process.

The FND Trade Setup – As of 11-6-18

FND Chart Setup as of 11-6-18

The Trade Plan

FND Trade Plan for 11-7-18

Note how Trader Vision 20/20 does so much of the work for you.  Knowing the ratio of Bullish Conditions to Bearish ones as well as the overall risk of the position size, the risk to Stop out and the Reward possible at each Target price can help a great deal with controlling our emotions.  Knowing the dollar impact of every scenario ahead of time, allows us to make calm decisions during the trade.  It really takes the pressure off.  No guesswork.  No surprises.  No emotional roller coaster.

To see a short video of this trade’s chart markup and trade planning, click the button below.


Put the power to Trader Vision 20/20 to work for you…


Testimonial

Trader Vision immediately simplified the process…immediately it provided that information and guidance to me. I knew what I would risk for how much reward, I began taking trades off at the 1st target, 2nd target, I was no longer holding all my trades for the homerun. I also began implementing the stop losses if and when they were reached, not just hoping the stock would recover.  It then became easier to see what patterns were working for me and which were not.  It provided a much more relaxed and stress-free environment. –Joan G


***************************************************************************************************

Investing and Trading involve significant financial risk and are not suitable for everyone. Ed Carter is not a licensed financial adviser nor does he offer trade recommendations or investment advice to anyone. No communication from Hit and Run Candlesticks Inc. is to be considered financial or trading advice. All information is intended for Educational Purposes Only. Terms of Service.

***************************************************************************************************

PPC Setup and Trade Plan

Today’s Featured Trade Idea is PPC.

Be Careful: With elections today, Fed Meeting on Wed-Thu and a lot of earnings the next couple days…markets will likely be volatile.  Just remember the trend is still Bearish until we have a higher low and higher high.

Members can join us in Trading Room #1 as Rick reviews this setup and other Trade-Ideas at 9:10am Eastern.  For now, here are my own analysis and a potential trade plan made using our Trader Vision 20/20 software.

PPC has formed a bottom since about August 1, breaking into an RBB pattern on a huge Belthold / Bullish Engulfing signal on 11/1. After a day of mild, indecisive profit-faking it printed another Bull Engulf Monday. (It is technically no longer an RBB pattern because there is just less than 10% remaining between price and the 200sma. However, it is close enough for government work.)

I will look for it to prove it can break the 19.45 resistance and Enter with a tight Stop. Targets are defined off Daily/Weekly S/R levels above. Be aware it will need to break through the 200sma to reach Target #2.

Be cautious of the market with Elections today, the Fed on Wed.-Thur. and many Earnings to come this week.

TV20/20 tells us that this trade has Earnings out of the way. It also shows us this chart setup has 4 Bullish and only 2 Bearish conditions. (It could also be considered an RBB with 9.8% of space up to the 200sma left.)

TV20/20 also tells us this plan offers very low Risk ($70) with moderate gain potential ($225). This gives us better than 2:1 Reward/Risk at Target #1 and 3.2:1 at Target #2. If this can fit your goal per trade, this is a nice setup and plan to consider.

Having this knowledge before a trade is even entered makes it much easier to control emotions and maintain discipline.

Below is my markup of the chart and the trade plan as laid out by Trader Vision 20/20.  As a bonus, if you click the green button below, you’ll be able to watch a video of the chart markup and trade planning process.

The PPC Trade Setup – As of 11-5-18

PPC Chart Setup as of  11-5-18

The Trade Plan

PPC Trade Plan for 11-6-18

Note how Trader Vision 20/20 does so much of the work for you.  Knowing the ratio of Bullish Conditions to Bearish ones as well as the overall risk of the position size, the risk to Stop out and the Reward possible at each Target price can help a great deal with controlling our emotions.  Knowing the dollar impact of every scenario ahead of time, allows us to make calm decisions during the trade.  It really takes the pressure off.  No guesswork.  No surprises.  No emotional roller coaster.

To see a short video of this trade’s chart markup and trade planning, click the button below.


Put the power to Trader Vision 20/20 to work for you…


Testimonial

Trader Vision immediately simplified the process…immediately it provided that information and guidance to me. I knew what I would risk for how much reward, I began taking trades off at the 1st target, 2nd target, I was no longer holding all my trades for the homerun. I also began implementing the stop losses if and when they were reached, not just hoping the stock would recover.  It then became easier to see what patterns were working for me and which were not.  It provided a much more relaxed and stress-free environment. –Joan G


***************************************************************************************************

Investing and Trading involve significant financial risk and are not suitable for everyone. Ed Carter is not a licensed financial adviser nor does he offer trade recommendations or investment advice to anyone. No communication from Hit and Run Candlesticks Inc. is to be considered financial or trading advice. All information is intended for Educational Purposes Only. Terms of Service.

***************************************************************************************************

FEYE Setup and Trade Plan

Today’s Featured Trade Idea is FEYE.

Be Careful: Markets gapped higher Wednesday and had a decent run, but all of them closed leaving high wicks.  The DIA failed a test of its 200sma and even on a +1-2% day, it did not seem like the Bulls were in control.  Just remember the trend is still Bearish until we have a higher low and higher high.

Members can join us in Trading Room #1 as Rick reviews this setup and other Trade-Ideas at 9:10am Eastern.  For now, here are my own analysis and a potential trade plan made using our Trader Vision 20/20 software.

FEYE is coming off a nice gap-up day (on earnings) and continues to put in higher- highs and higher lows recently. However, it did pull back from resistance Wed.

I will wait on it to prove $19 is no longer resistance with a Stop protected by the $19 and $18.25 S/R levels. Targets were defined of the Weekly chart.

Just be cautious as this still has resistance above and the overall market is still in a Bearish trend (despite nice gap-ups yesterday).

TV20/20 tells us we have 3mo. until the next earnings report. It also shows that we have 3 Bullish and 3 Bearish conditions (2 of the bearish being overall market trends long and short-term).

Trader Vision also shows us that this plan (waiting 3.5% for FEYE to prove it can break out) gives us a good Reward/Risk of 2.29/1 at the 1st Target. However, if we can sell half there (to lock in profits) and hold the remainder until the 2nd Target we can achieve 3.82/1 ($487.5 / $127.50) overall.

FEYE must reach just above Target #1 ($21.38) in order to achieve the Trade Goal for this account.

Having this knowledge before a trade is even entered makes it much easier to control emotions and maintain discipline.

Below is my markup of the chart and the trade plan as laid out by Trader Vision 20/20.  As a bonus, if you click the green button below, you’ll be able to watch a video of the chart markup and trade planning process.

The  Trade Setup – As of 10-31-18

FEYE Chart Setup as of 10-31-18

The Trade Plan

FEYE Trade Plan for 11-1-18

Note how Trader Vision 20/20 does so much of the work for you.  Knowing the ratio of Bullish Conditions to Bearish ones as well as the overall risk of the position size, the risk to Stop out and the Reward possible at each Target price can help a great deal with controlling our emotions.  Knowing the dollar impact of every scenario ahead of time, allows us to make calm decisions during the trade.  It really takes the pressure off.  No guesswork.  No surprises.  No emotional roller coaster.

To see a short video of this trade’s chart markup and trade planning, click the button below.


Put the power to Trader Vision 20/20 to work for you…


Testimonial

Trader Vision immediately simplified the process…immediately it provided that information and guidance to me. I knew what I would risk for how much reward, I began taking trades off at the 1st target, 2nd target, I was no longer holding all my trades for the homerun. I also began implementing the stop losses if and when they were reached, not just hoping the stock would recover.  It then became easier to see what patterns were working for me and which were not.  It provided a much more relaxed and stress-free environment. –Joan G


***************************************************************************************************

Investing and Trading involve significant financial risk and are not suitable for everyone. Ed Carter is not a licensed financial adviser nor does he offer trade recommendations or investment advice to anyone. No communication from Hit and Run Candlesticks Inc. is to be considered financial or trading advice. All information is intended for Educational Purposes Only. Terms of Service.

***************************************************************************************************

10-30-18 eLearning

Working with Candlesticks

In this video, Rick Saddler talks about candlestick signals and how those often translate into patterns in other timeframes.  He also explains the 4 Questions a Trader should about the Candlestick signals they see.

  1. Why don’t candlestick signals work every time?
  2. What is follow through?
  3. What is positive trading?
  4. How do patterns in one timeframe relate to signals in another timeframe?

(1 hour 26 minutes)


Candlesticks • Price Action • T-Line • T-Line Bands • Support • Resistance • Trend • Trendlines • Chart Patterns • Buy Box • Volatility Stops • Profit Zones • Entry Zones • Protective Stops • RBB Rounded Bottom Breakout Strategy • Pop Out of The Box Strategy • Pinball Strategy • Trade Planning, Fibonacci, Stoch/RSI


Investing and Trading involve significant financial risk and are not suitable for everyone. No communication from Hit and Run Candlesticks or it’s associates should be considered as financial or trading advice. All information is intended for Educational Purposes Only. Terms of Service

AGX 2Day Setup and Plan Beware this market!

Today’s Featured Trade Idea is AGX  (This is planned/analyzed off a 2Day chart…not normal practice for me.)

Members can join us in Trading Room #1 as Rick reviews this setup and other Trade-Ideas at 9:10am Eastern.  For now, here are my own analysis and a potential trade plan made using our Trader Vision 20/20 software.

Be extremely cautious trading this market! We are seeing 4-6% daily ranges in the indices and while the bears are in control of the trend, we may be seeing exhaustion selling (leading to a potential bounce).

WARNING: This is analyzed and planned off a 2-day chart as an exercise with my partner Rick Saddler. Not a normal practice.

AGX is both an RBB and J-hook b/o pattern. I will look for an Entry about where it closed Tuesday and a Stop below Support. The Targets are defined off 2day chart as well.

If executed as planned, it would yield a 3.65/1 Reward/Risk.

Having this knowledge before a trade is even entered makes it much easier to control emotions and maintain discipline.

Below is my markup of the chart and the trade plan as laid out by Trader Vision 20/20.  As a bonus, if you click the green button below, you’ll be able to watch a video of the chart markup and trade planning process.

The AGX Trade Setup (2-day chart) – As of 10-30-18

AGX 2day Chart as of 10-30-18

The Trade Plan

AGX 2Day Trade Plan for 10-31-18

Note how Trader Vision 20/20 does so much of the work for you.  Knowing the ratio of Bullish Conditions to Bearish ones as well as the overall risk of the position size, the risk to Stop out and the Reward possible at each Target price can help a great deal with controlling our emotions.  Knowing the dollar impact of every scenario ahead of time, allows us to make calm decisions during the trade.  It really takes the pressure off.  No guesswork.  No surprises.  No emotional roller coaster.

To see a short video of this trade’s chart markup and trade planning, click the button below.


Put the power to Trader Vision 20/20 to work for you…


Testimonial

Trader Vision immediately simplified the process…immediately it provided that information and guidance to me. I knew what I would risk for how much reward, I began taking trades off at the 1st target, 2nd target, I was no longer holding all my trades for the homerun. I also began implementing the stop losses if and when they were reached, not just hoping the stock would recover.  It then became easier to see what patterns were working for me and which were not.  It provided a much more relaxed and stress-free environment. –Joan G


***************************************************************************************************

Investing and Trading involve significant financial risk and are not suitable for everyone. Ed Carter is not a licensed financial adviser nor does he offer trade recommendations or investment advice to anyone. No communication from Hit and Run Candlesticks Inc. is to be considered financial or trading advice. All information is intended for Educational Purposes Only. Terms of Service.

***************************************************************************************************

DWT Setup and Trade Plan Be Careful - Volatile Markets now

Today’s Featured Trade Idea is DWT.

Members can join us in Trading Room #1 as Rick reviews this setup and other Trade-Ideas at 9:10am Eastern.  For now, here are my own analysis and a potential trade plan made using our Trader Vision 20/20 software.

Be extremely cautious trading this market! We are seeing 4-6% daily ranges in the indices and while the bears are in control of the trend, we may be seeing exhaustion selling (leading to a potential bounce).

DWT is a 3x Inverse ETN of Crude Oil. Being a Leveraged ETN it carries more risk to both re-balancing and leverage). However, it is showing a Rounded Bottom Breakout that has now consolidated for almost a week. It will also break its longer-term downtrend as of Entry for this trade idea.

Trader Vision shows us there are no earnings to worry about. In addition, since this is an inverse ETN the market conditions section incorrectly reads the Market bias long and short-term. (A bearish market should help this ETN.)

TV20/20 tells us this trade plan would get us a 2:1 Reward/Risk at the 1st Target. However, we need to get above the 1st Target to achieve the trade goal set for this account. If we can sell half at Target #1 and the rest at Target #2, we can reach our trade goal and achieve a 2.71:1 Reward/Risk ($380/$140).

On trading above Monday’s high, I will look for an Entry with a Stop protected by 2 potential Support levels and Targets defined by S/R levels above.

Having this knowledge before a trade is even entered makes it much easier to control emotions and maintain discipline.

Below is my markup of the chart and the trade plan as laid out by Trader Vision 20/20.  As a bonus, if you click the green button below, you’ll be able to watch a video of the chart markup and trade planning process.

The DWT Trade Setup – As of 10-29-18

DWT Chart Setup as of 10-29-18

The Trade Plan

DWT Trade Plan for 10-30-18

Note how Trader Vision 20/20 does so much of the work for you.  Knowing the ratio of Bullish Conditions to Bearish ones as well as the overall risk of the position size, the risk to Stop out and the Reward possible at each Target price can help a great deal with controlling our emotions.  Knowing the dollar impact of every scenario ahead of time, allows us to make calm decisions during the trade.  It really takes the pressure off.  No guesswork.  No surprises.  No emotional roller coaster.

To see a short video of this trade’s chart markup and trade planning, click the button below.


Put the power to Trader Vision 20/20 to work for you…


Testimonial

Trader Vision immediately simplified the process…immediately it provided that information and guidance to me. I knew what I would risk for how much reward, I began taking trades off at the 1st target, 2nd target, I was no longer holding all my trades for the homerun. I also began implementing the stop losses if and when they were reached, not just hoping the stock would recover.  It then became easier to see what patterns were working for me and which were not.  It provided a much more relaxed and stress-free environment. –Joan G


***************************************************************************************************

Investing and Trading involve significant financial risk and are not suitable for everyone. Ed Carter is not a licensed financial adviser nor does he offer trade recommendations or investment advice to anyone. No communication from Hit and Run Candlesticks Inc. is to be considered financial or trading advice. All information is intended for Educational Purposes Only. Terms of Service.

***************************************************************************************************

SCHN Setup and Trade Plan Caution Advised!

Today’s Featured Trade Idea is SCHN.

That said, this is a very whippy and volatile market, which also has a ton of earnings coming today and this week.  Personally, I will sit on my hands.  However, if you take this trade be very watchful and fast to take or preserve profits.

Members can join us in Trading Room #1 as Rick reviews this setup and other Trade-Ideas at 9:10am Eastern.  For now, here are my own analysis and a potential trade plan made using our Trader Vision 20/20 software.

Be very careful if you take this trade.  This is a week to sit on your hands given market volatility (whiplash) and heavy earnings reports.

SCHN has formed a bottom and broke into an RBB pattern. It printed a strong candle Thursday on earnings and a very volatile (long-legged) Doji on Friday. This potentially sets up a Doji Continuation pattern (sandwich) for Monday.

If I took this, it would be with an Entry long just above current resistance (making it potential support) and with target defined by weekly chart S/R levels.

As we can see TV20/20 is telling us this is a risky trade, without a great Reward/Risk. It does show that earnings are out of the way. However, only 1 Bullish condition in the face of 4 Bearish ones must give us pause.

The trade plan itself is also marginal, but could be acceptable. We had to use very tight Entry and Targets (relative to Support/Resistance. However, with htose tight parameters, the trade could at least get us 2.82:1 Reward/Risk at the 2nd Target…albeit without making the trade goal for this trade/account.

So use caution. This could simply be a pass…especially given the very volatile market we have right now and all hte earnings coming this week.

Having this knowledge before a trade is even entered makes it much easier to control emotions and maintain discipline.

Below is my markup of the chart and the trade plan as laid out by Trader Vision 20/20.  As a bonus, if you click the green button below, you’ll be able to watch a video of the chart markup and trade planning process.

The SCHN Trade Setup – As of 10-26-18

SCHN Chart Setup as of 10-26-18

The Trade Plan

SCHN Trade Plan for 10-29-18

Note how Trader Vision 20/20 does so much of the work for you.  Knowing the ratio of Bullish Conditions to Bearish ones as well as the overall risk of the position size, the risk to Stop out and the Reward possible at each Target price can help a great deal with controlling our emotions.  Knowing the dollar impact of every scenario ahead of time, allows us to make calm decisions during the trade.  It really takes the pressure off.  No guesswork.  No surprises.  No emotional roller coaster.

To see a short video of this trade’s chart markup and trade planning, click the button below.


Put the power to Trader Vision 20/20 to work for you…


Testimonial

Trader Vision immediately simplified the process…immediately it provided that information and guidance to me. I knew what I would risk for how much reward, I began taking trades off at the 1st target, 2nd target, I was no longer holding all my trades for the homerun. I also began implementing the stop losses if and when they were reached, not just hoping the stock would recover.  It then became easier to see what patterns were working for me and which were not.  It provided a much more relaxed and stress-free environment. –Joan G


***************************************************************************************************

Investing and Trading involve significant financial risk and are not suitable for everyone. Ed Carter is not a licensed financial adviser nor does he offer trade recommendations or investment advice to anyone. No communication from Hit and Run Candlesticks Inc. is to be considered financial or trading advice. All information is intended for Educational Purposes Only. Terms of Service.

***************************************************************************************************

VRS Setup and Trade Plan

Today’s Featured Trade Idea is VRS short.

Members can join us in Trading Room #1 as Rick reviews this setup and other Trade-Ideas at 9:10am Eastern.  For now, here are my own analysis and a potential trade plan made using our Trader Vision 20/20 software.

VRS has formed a Head & Shoulders pattern, coupled with a Blue Ice Failure pattern and a Dreaded-h pattern. It has broken (or is testing) the last Support level before a large void down to the $22.45 area.

I will look for a short entry on follow-through with a substantial Stop and a single target (off daily and weekly charts).

Please consider the volatile market with big candles and also earnings.  Trading at all at such times is a very risky proposition.

With at least 3 weeks until earnings and one bullish to 5 bearish conditions, VRS a nice chart setup. However, keep in mind the very volatile market and the risk that earnings throws the market the other direction.

TV20/20 tells us this plan offers a nice 3.27:1 Reward/Risk ($605/$185). That would equate to a 21.23% gain. However, it requires a bit more risk to stop-out than I’d prefer…and the market has been very volatile. Pre-markets are also indicating we’ll gap higher and there are many earnings out before, during and after the session.  Caution is the word of the day.

Having this knowledge before a trade is even entered makes it much easier to control emotions and maintain discipline.

Below is my markup of the chart and the trade plan as laid out by Trader Vision 20/20.  As a bonus, if you click the green button below, you’ll be able to watch a video of the chart markup and trade planning process.

The VRS Trade Setup – As of 10-24-18

VRS Chart Setup as of 10-24-18

The Trade Plan

VRS Trade Plan for 10-25-18

Note how Trader Vision 20/20 does so much of the work for you.  Knowing the ratio of Bullish Conditions to Bearish ones as well as the overall risk of the position size, the risk to Stop out and the Reward possible at each Target price can help a great deal with controlling our emotions.  Knowing the dollar impact of every scenario ahead of time, allows us to make calm decisions during the trade.  It really takes the pressure off.  No guesswork.  No surprises.  No emotional roller coaster.

To see a short video of this trade’s chart markup and trade planning, click the button below.


Put the power to Trader Vision 20/20 to work for you…


Testimonial

Trader Vision immediately simplified the process…immediately it provided that information and guidance to me. I knew what I would risk for how much reward, I began taking trades off at the 1st target, 2nd target, I was no longer holding all my trades for the homerun. I also began implementing the stop losses if and when they were reached, not just hoping the stock would recover.  It then became easier to see what patterns were working for me and which were not.  It provided a much more relaxed and stress-free environment. –Joan G


***************************************************************************************************

Investing and Trading involve significant financial risk and are not suitable for everyone. Ed Carter is not a licensed financial adviser nor does he offer trade recommendations or investment advice to anyone. No communication from Hit and Run Candlesticks Inc. is to be considered financial or trading advice. All information is intended for Educational Purposes Only. Terms of Service.

***************************************************************************************************

OKTA Setup and Trade Plan

Today’s Featured Trade Idea is OKTA.

Members can join us in Trading Room #1 as Rick reviews this setup and other Trade-Ideas at 9:10am Eastern.  For now, here are my own analysis and a potential trade plan made using our Trader Vision 20/20 software.

OKTA has been in a bearish trend for a month and a half. It broke the 50sma on a strong down move rallied back and failed the 50sma again on an Evening Star signal. This is a classic “Ice Hole” or “Blue Ice Failure.” The next expected target would be the 200sma below. It is also forming a “Dreaded-h” pattern that is near b/o.

I will look to Enter Short just below the next Support level and use a Stop protected by a couple resistance levels. The targets are defined by S/R levels from the Weekly chart.

Trader Vision shows us that we have plenty of time until the next earnings report. It also shows us the setup has 2 bullish and 4 Bearish conditions (and that Evening Star signal on Thursday).

TV20/20 tells us this plan offers 2:1 Reward/Risk at the 1st Target and that we do not even need to reach Target #1 to achieve our Trade Goal. That said, it requires a very large position size for this account to do so. If we can sell half at Target #1 and the rest at the 2nd Target, we’d make a tidy 10.6% for almost a 2:1 Reward/Risk ($585/$235).

Having this knowledge before a trade is even entered makes it much easier to control emotions and maintain discipline.

Below is my markup of the chart and the trade plan as laid out by Trader Vision 20/20.  As a bonus, if you click the green button below, you’ll be able to watch a video of the chart markup and trade planning process.

The OKTA Trade Setup – As of 10-19-18

OKTA Chart Setup as of 10-19-18

The Trade Plan

OKTA Trade Plan for 10-22-18

Note how Trader Vision 20/20 does so much of the work for you.  Knowing the ratio of Bullish Conditions to Bearish ones as well as the overall risk of the position size, the risk to Stop out and the Reward possible at each Target price can help a great deal with controlling our emotions.  Knowing the dollar impact of every scenario ahead of time, allows us to make calm decisions during the trade.  It really takes the pressure off.  No guesswork.  No surprises.  No emotional roller coaster.

To see a short video of this trade’s chart markup and trade planning, click the button below.


Put the power to Trader Vision 20/20 to work for you…


Testimonial

Trader Vision immediately simplified the process…immediately it provided that information and guidance to me. I knew what I would risk for how much reward, I began taking trades off at the 1st target, 2nd target, I was no longer holding all my trades for the homerun. I also began implementing the stop losses if and when they were reached, not just hoping the stock would recover.  It then became easier to see what patterns were working for me and which were not.  It provided a much more relaxed and stress-free environment. –Joan G


***************************************************************************************************

Investing and Trading involve significant financial risk and are not suitable for everyone. Ed Carter is not a licensed financial adviser nor does he offer trade recommendations or investment advice to anyone. No communication from Hit and Run Candlesticks Inc. is to be considered financial or trading advice. All information is intended for Educational Purposes Only. Terms of Service.

***************************************************************************************************