Friday Performance Update for 6-15-18
As you know, Hit and Run Candlesticks does not issue Featured Trade Ideas on Fridays. So, instead of planning a new trade, we’ll use Friday’s to check the performance of our trades to date, check on our open trades and adjust and positions as needed.
Bear in mind that this update covers the period up through 6-14-18 (only 2.5 weeks of trade ideas).
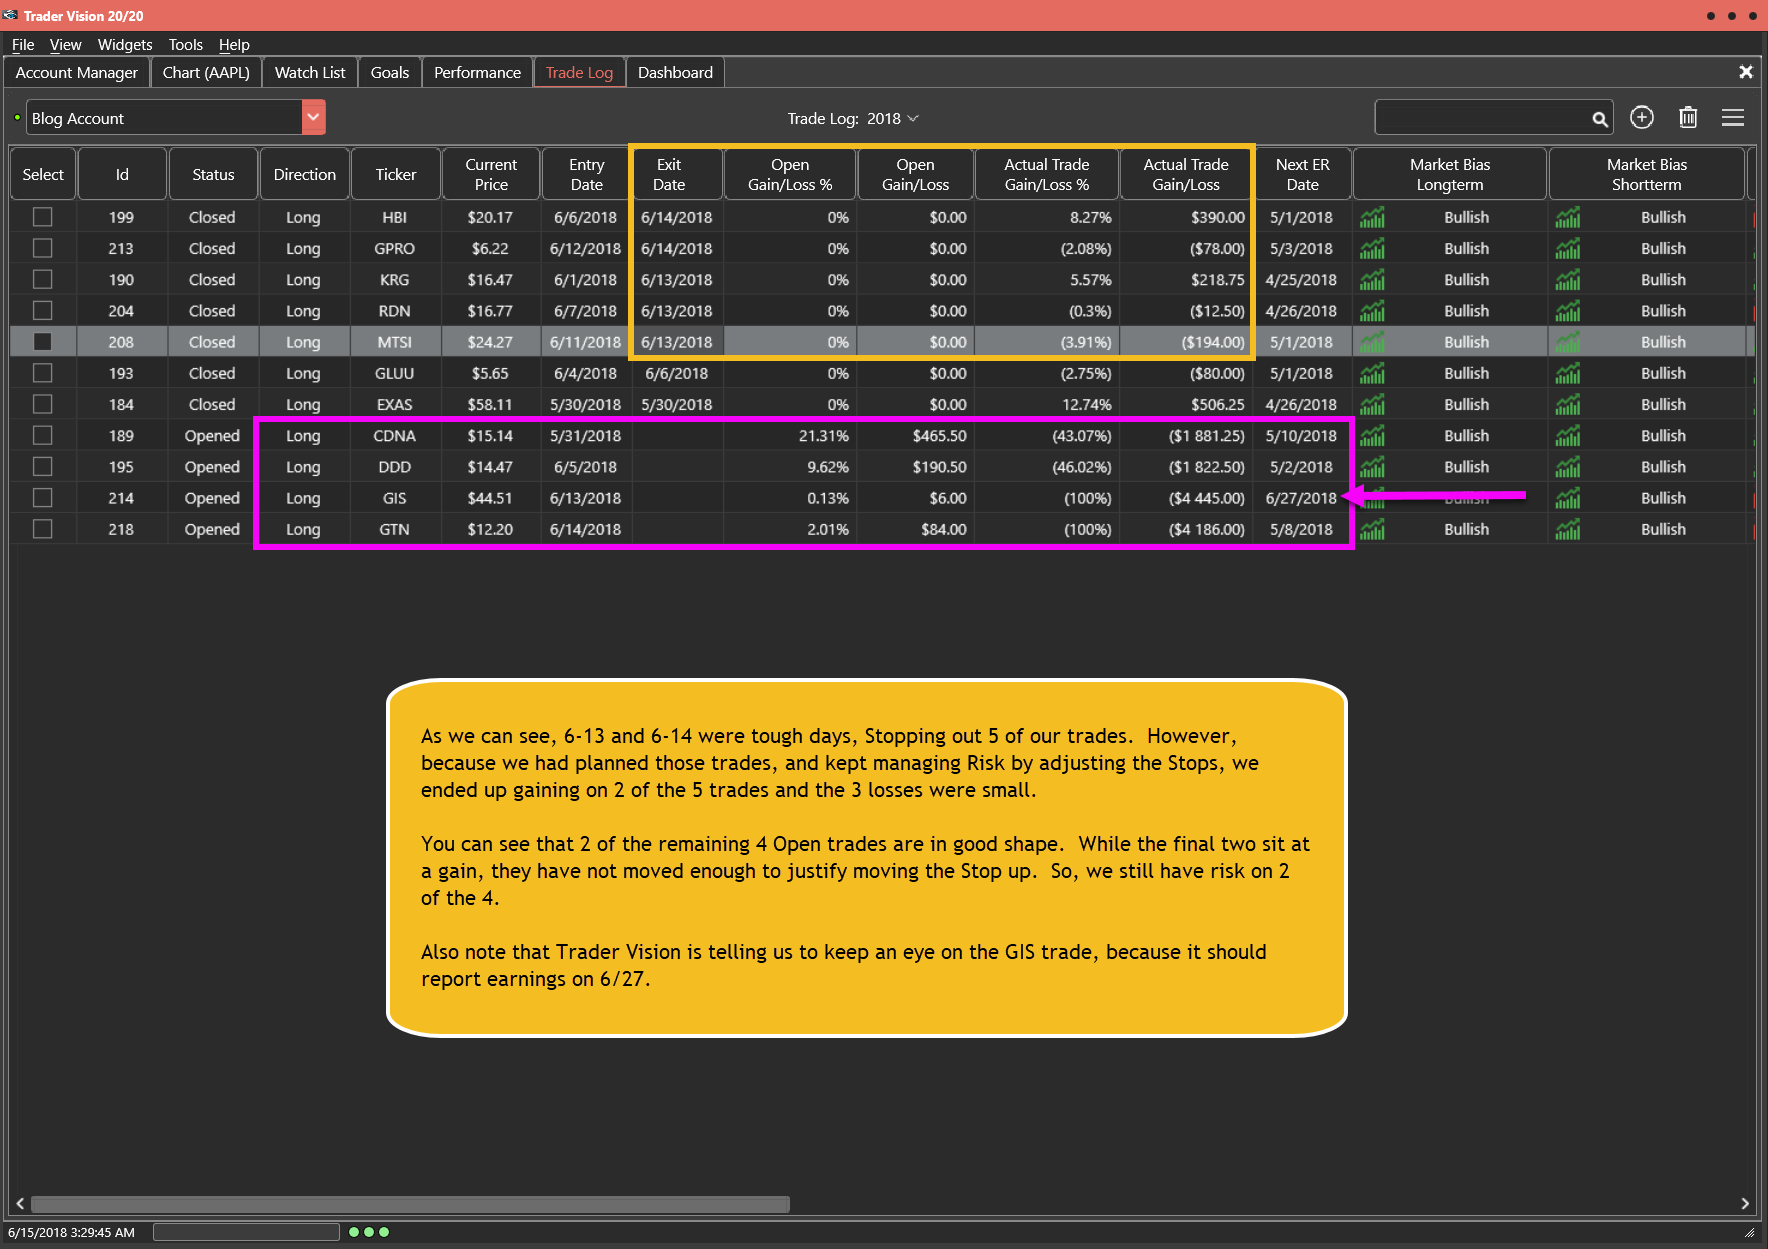
As you can see below, we had a couple rough days that Stopped us out of 5 trades. However, by using Trader Vision 20/20 to plan and manage our trade risk, we still managed to post a profit over those trades and we continue to outperform the broader market. You can see that we have 4 Open trades remaining and all are profitable as of Thursday’s close. On two of those four, we’ve already taken some profits and moved our Stops up. So, by focusing on the managing Reward/Risk and taking profit, those two trades are basically safe. The other 2 are profitable as of Thursday’s close, but have not moved enough yet to justify taking profit or moving Stop.
As a bonus, if you click the green button below, you’ll be able to watch a video where I review these trades and discuss how and why I adjust my positions using Trader Vision 20/20 software.
Of course, members can listen to Rick’s analysis of the overall market and his open position in the trading room at 9:10am Eastern.
Featured Trade Idea Plan Performance
(As of 6-14-18 Close)
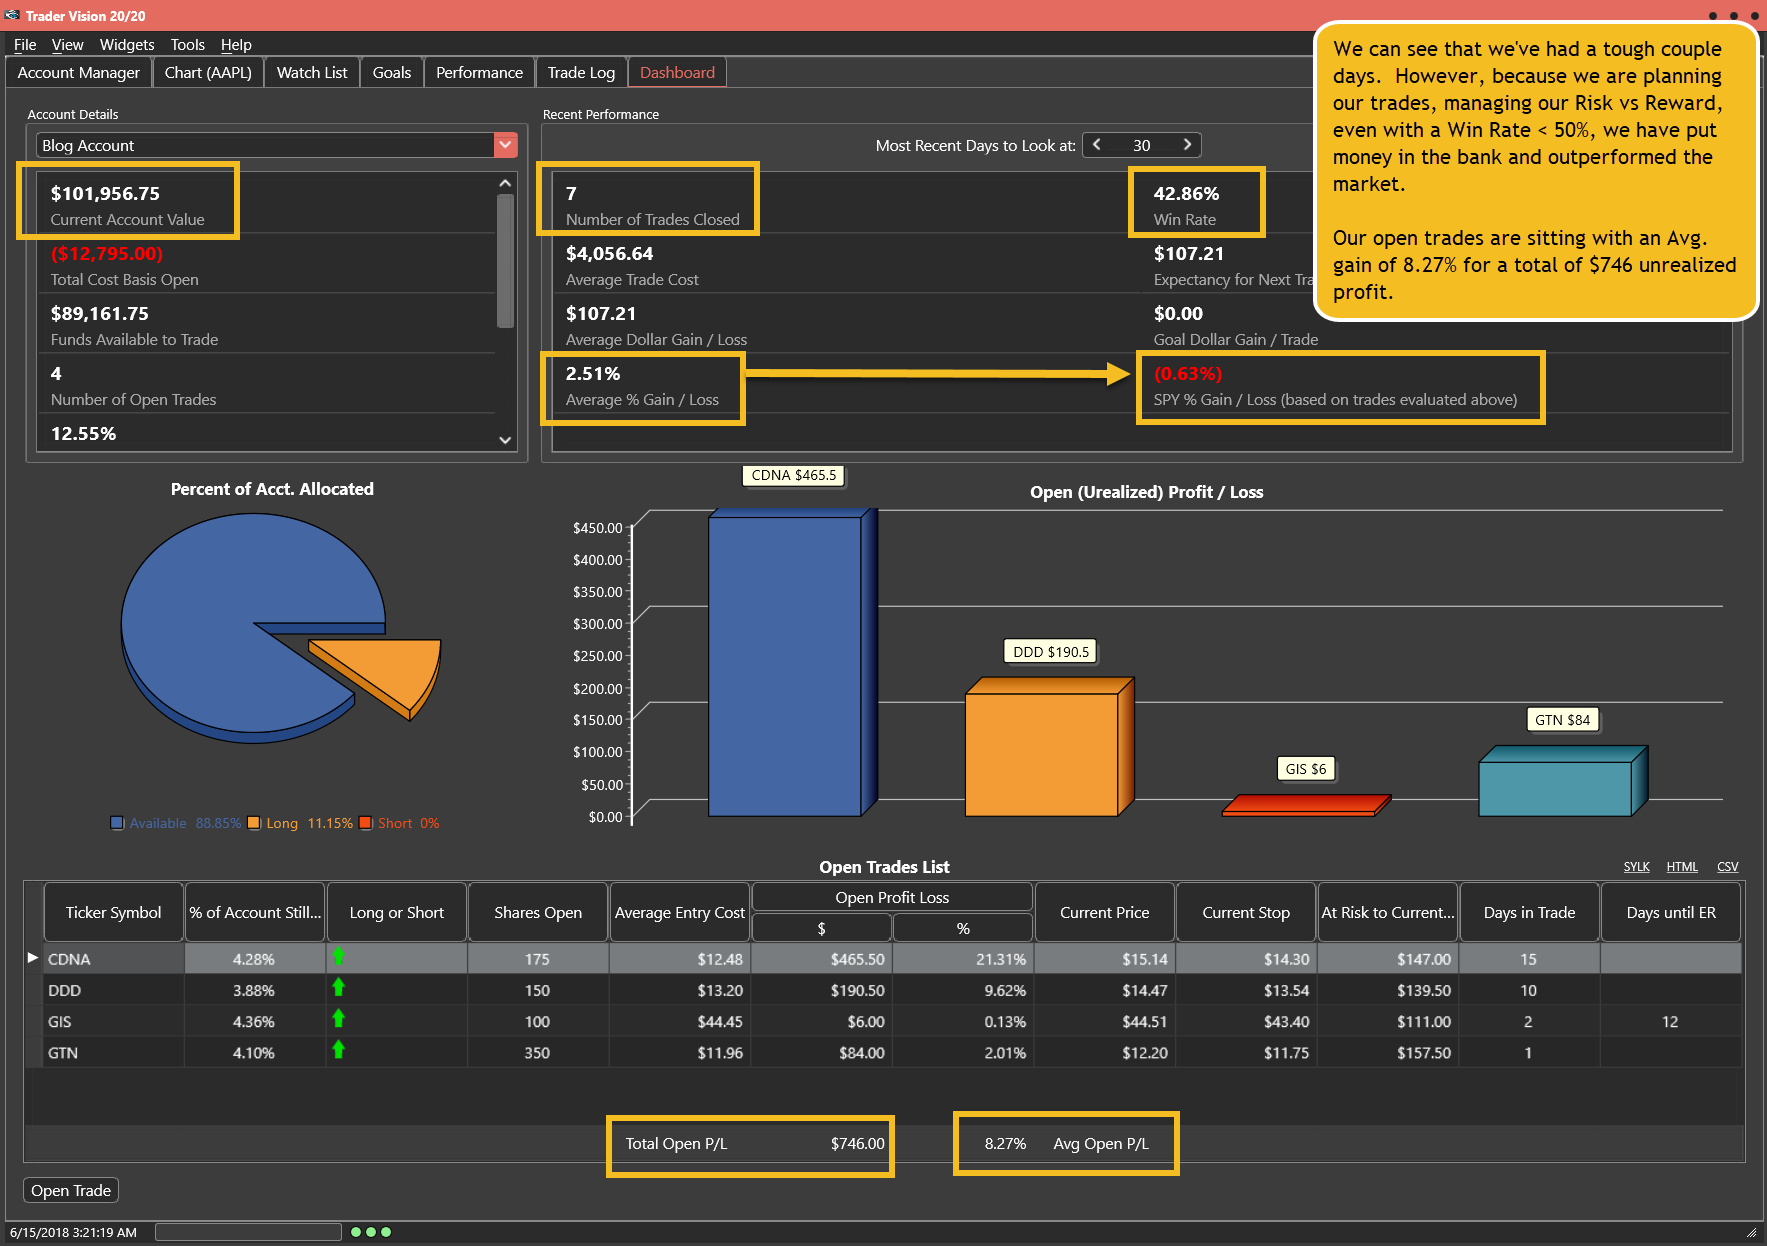
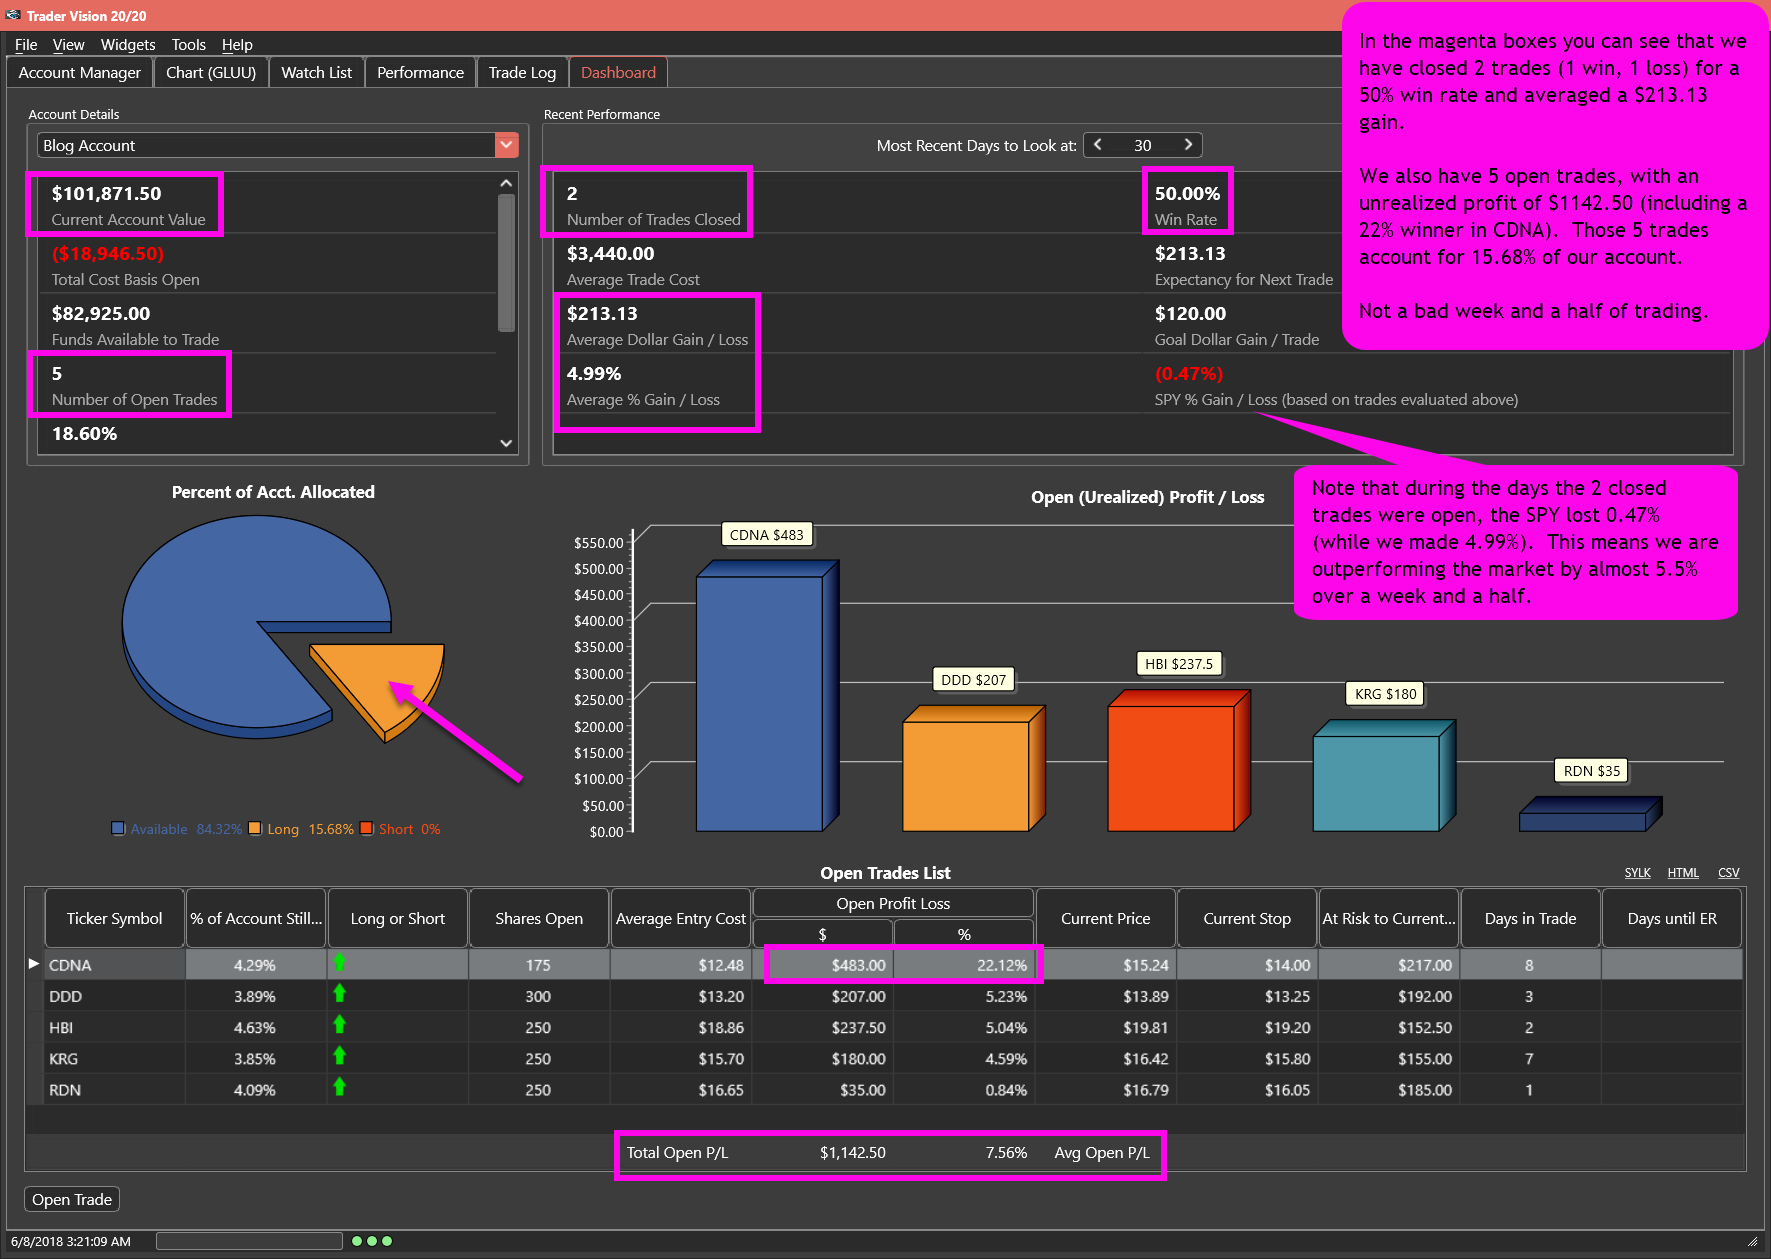
+$1,956.75 over 2.5 weeks
$782.70/week profit -or-
almost 0.8%/week profit on the Account
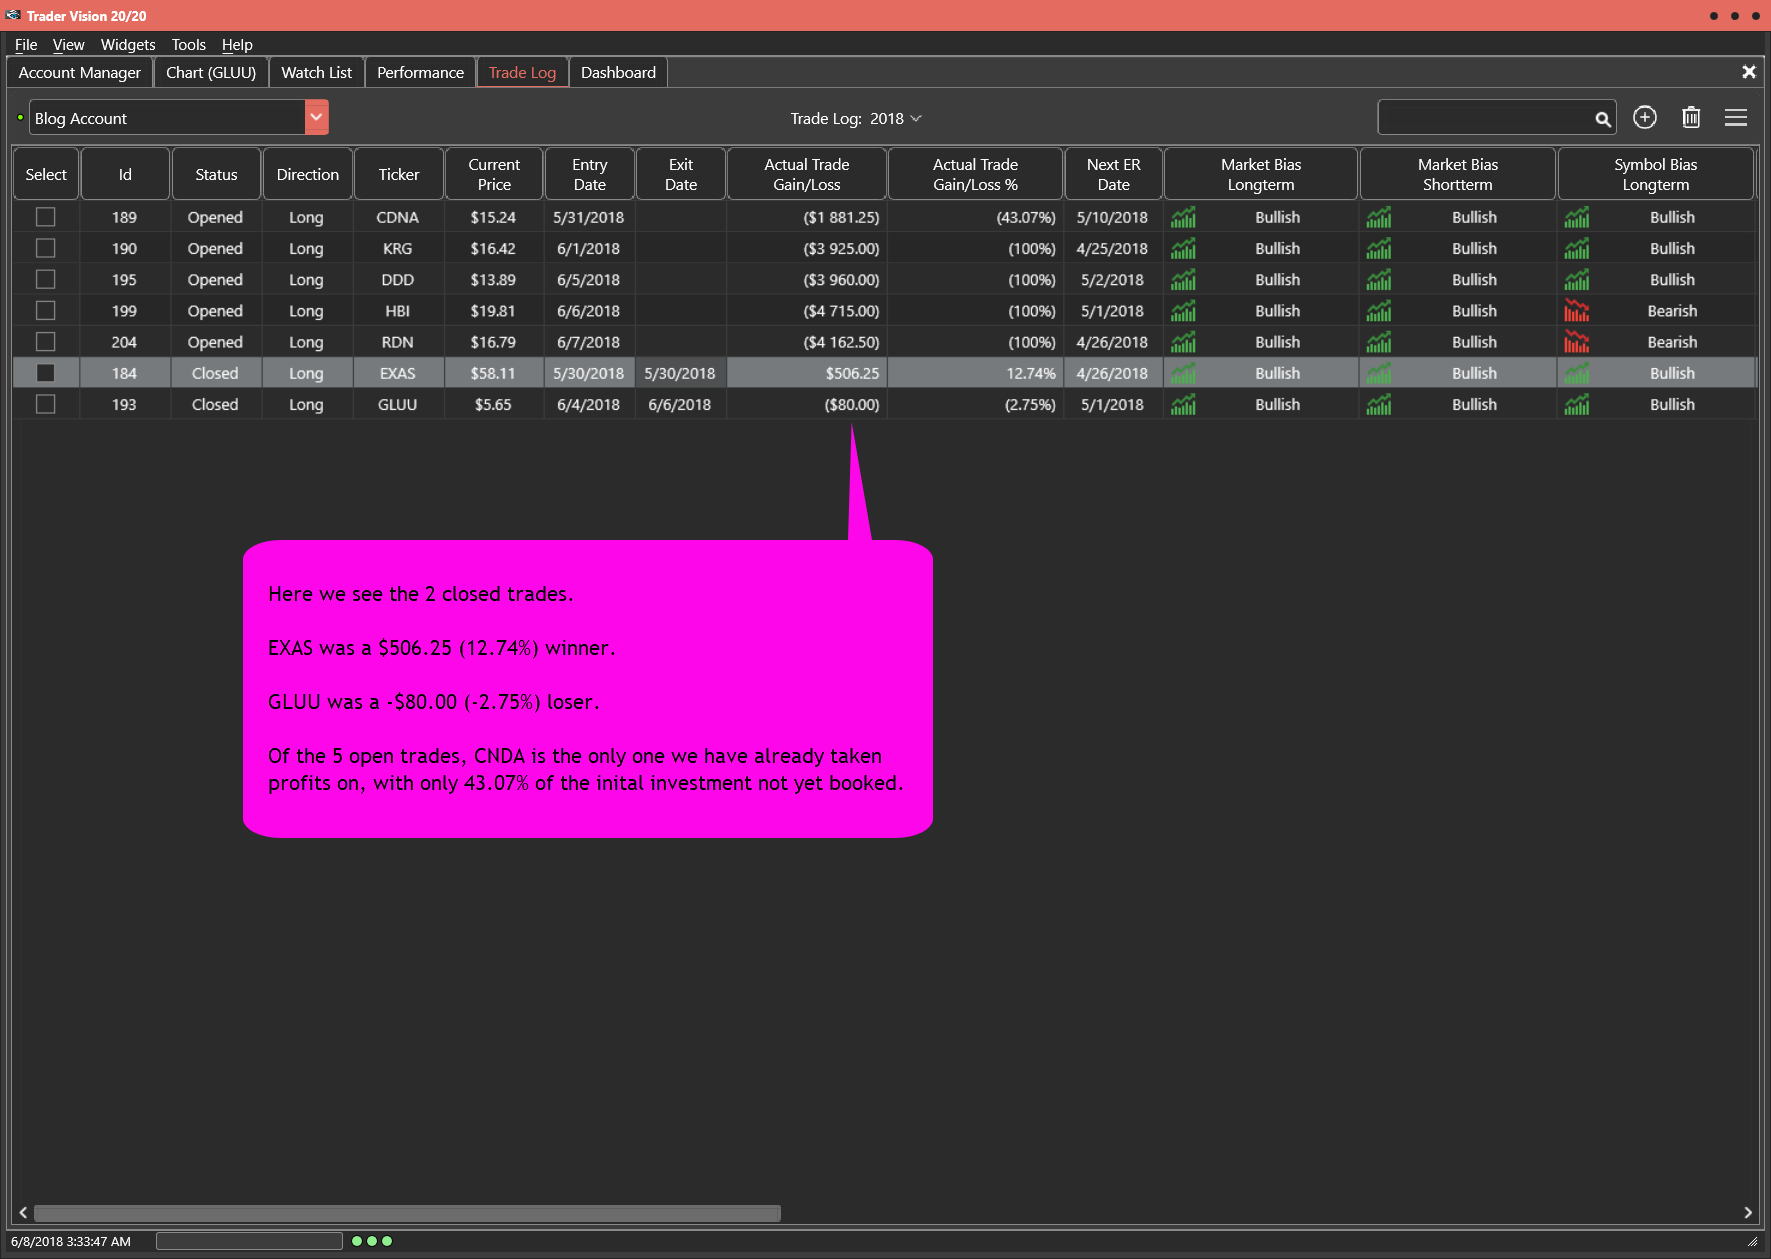
Blog Account Trade Log as of 6-7-18 Close
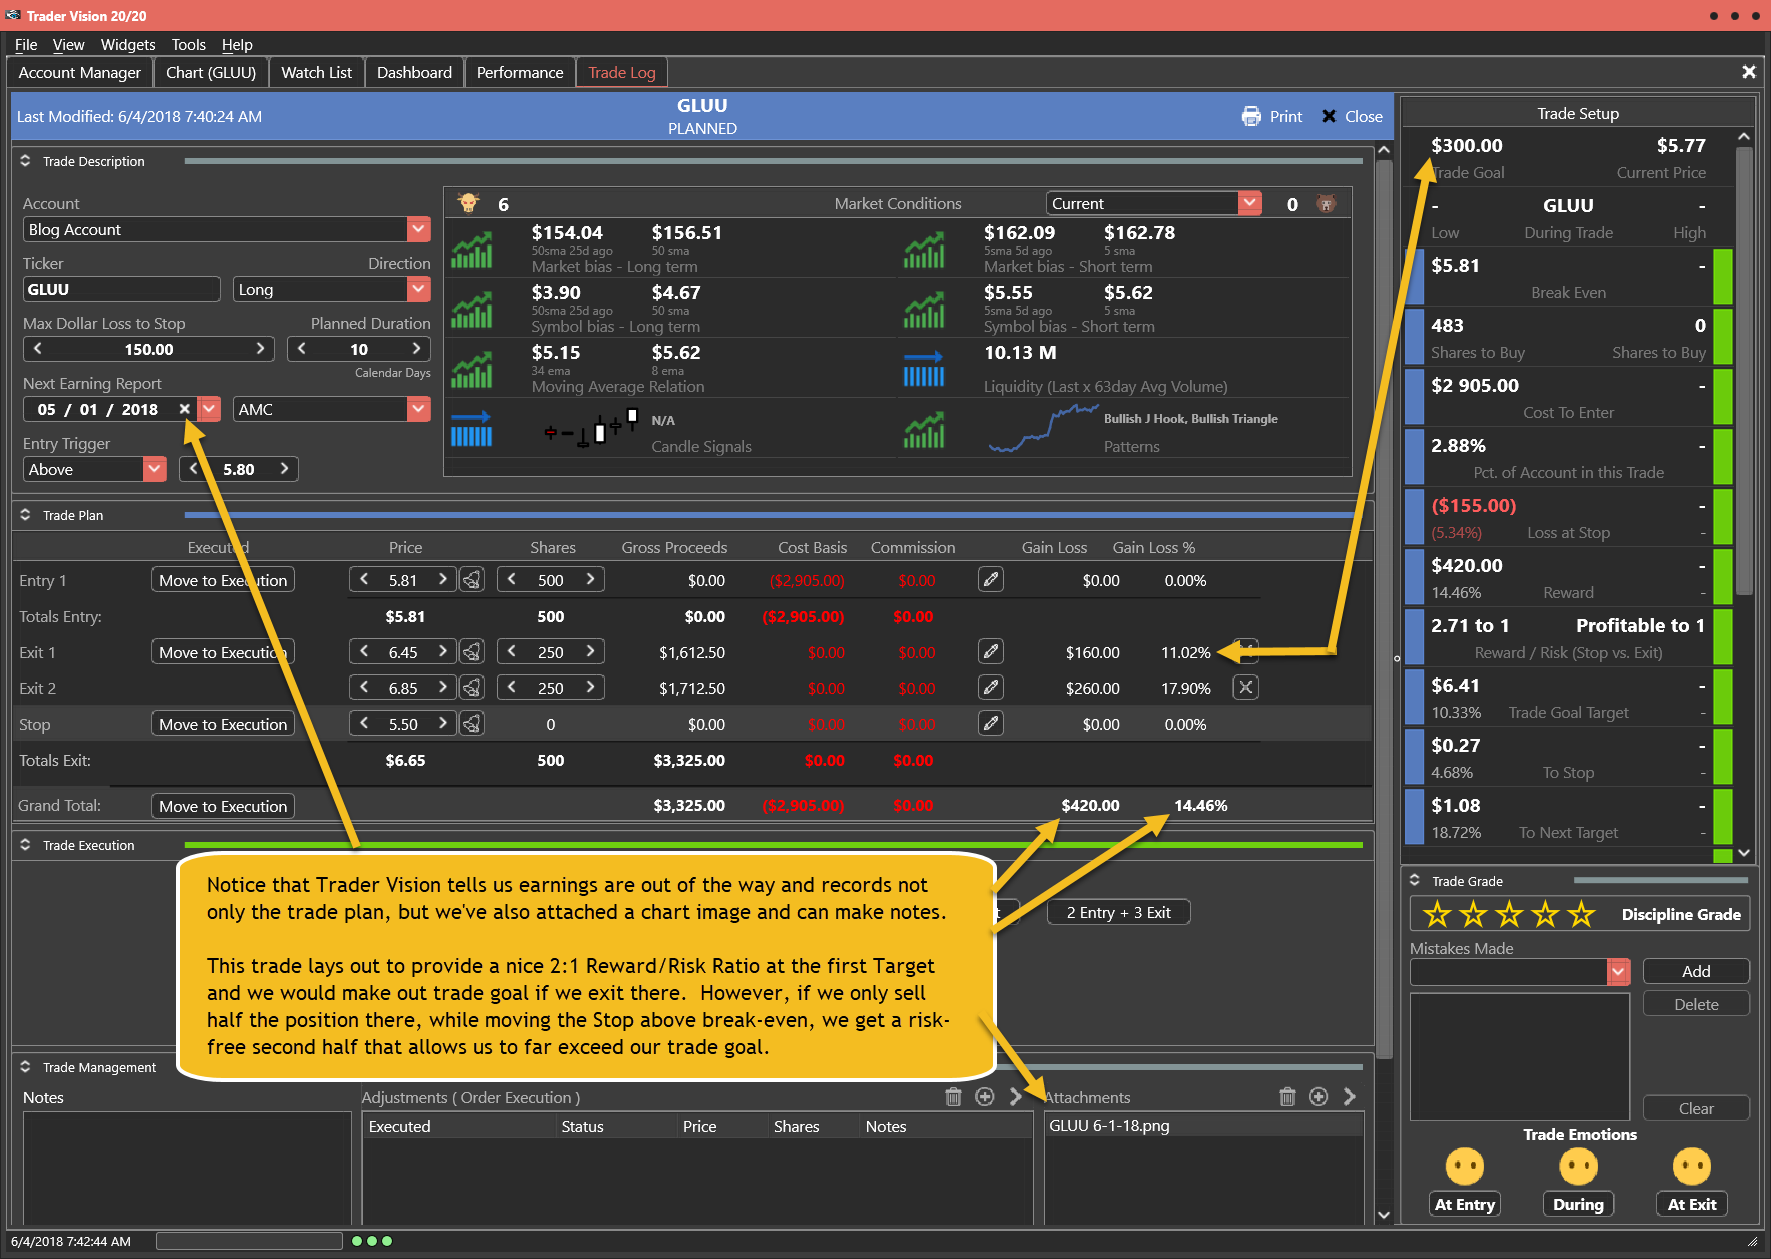
Note how Trader Vision 20/20 does so much of the work for you. All of your trades are logged, in incredible detail. This will allow you to analyze patterns in your trading, identifying problems and improving your performance. You’ll also be able to get back inside your own head even if you revisit the trade years later. Having all this information give you the ability to keep improving and reducing the emotional roller coaster that the amateurs face every day!
[button_2 color=”light-green” align=”center” href=”https://youtu.be/hypnDjo2x3A” new_window=”Y”]Trade Review Video[/button_2]
If you’re interested in putting the power to Trader Vision 20/20 to work for you, click below.
[button_2 color=”orange” align=”center” href=”https://hitandruncandlesticks.com/product/trader-vision-20-20-monthly-subscription2/” new_window=”Y”]TV20/20 Software[/button_2]
***************************************************************************************************
Investing and Trading involve significant financial risk and are not suitable for everyone. Ed Carter is not a licensed financial adviser nor does he offer trade recommendations or investment advice to anyone. No communication from Hit and Run Candlesticks Inc. is to be considered financial or trading advice. All information is intended for Educational Purposes Only. Terms of Service.
***************************************************************************************************