WETF Setup and Trade Plan

Today’s Featured Trade Idea is WETF.

Members can join us in Trading Room #1 as Rick reviews the WETF setup and other Trade-Ideas at 9:10am Eastern.  For now, here are my own analysis and a potential trade plan made using our Trader Vision 20/20 software.

Trader Vision told us that we have just less than a month prior to the next earnings.  So, while the chart itself might call for a 3-Target trade, we may not have time to achieve this prior to earnings.  As a result, I have planned this trade two different ways.  Fortunately, TV20/20 makes it easy to do various scenario plans.

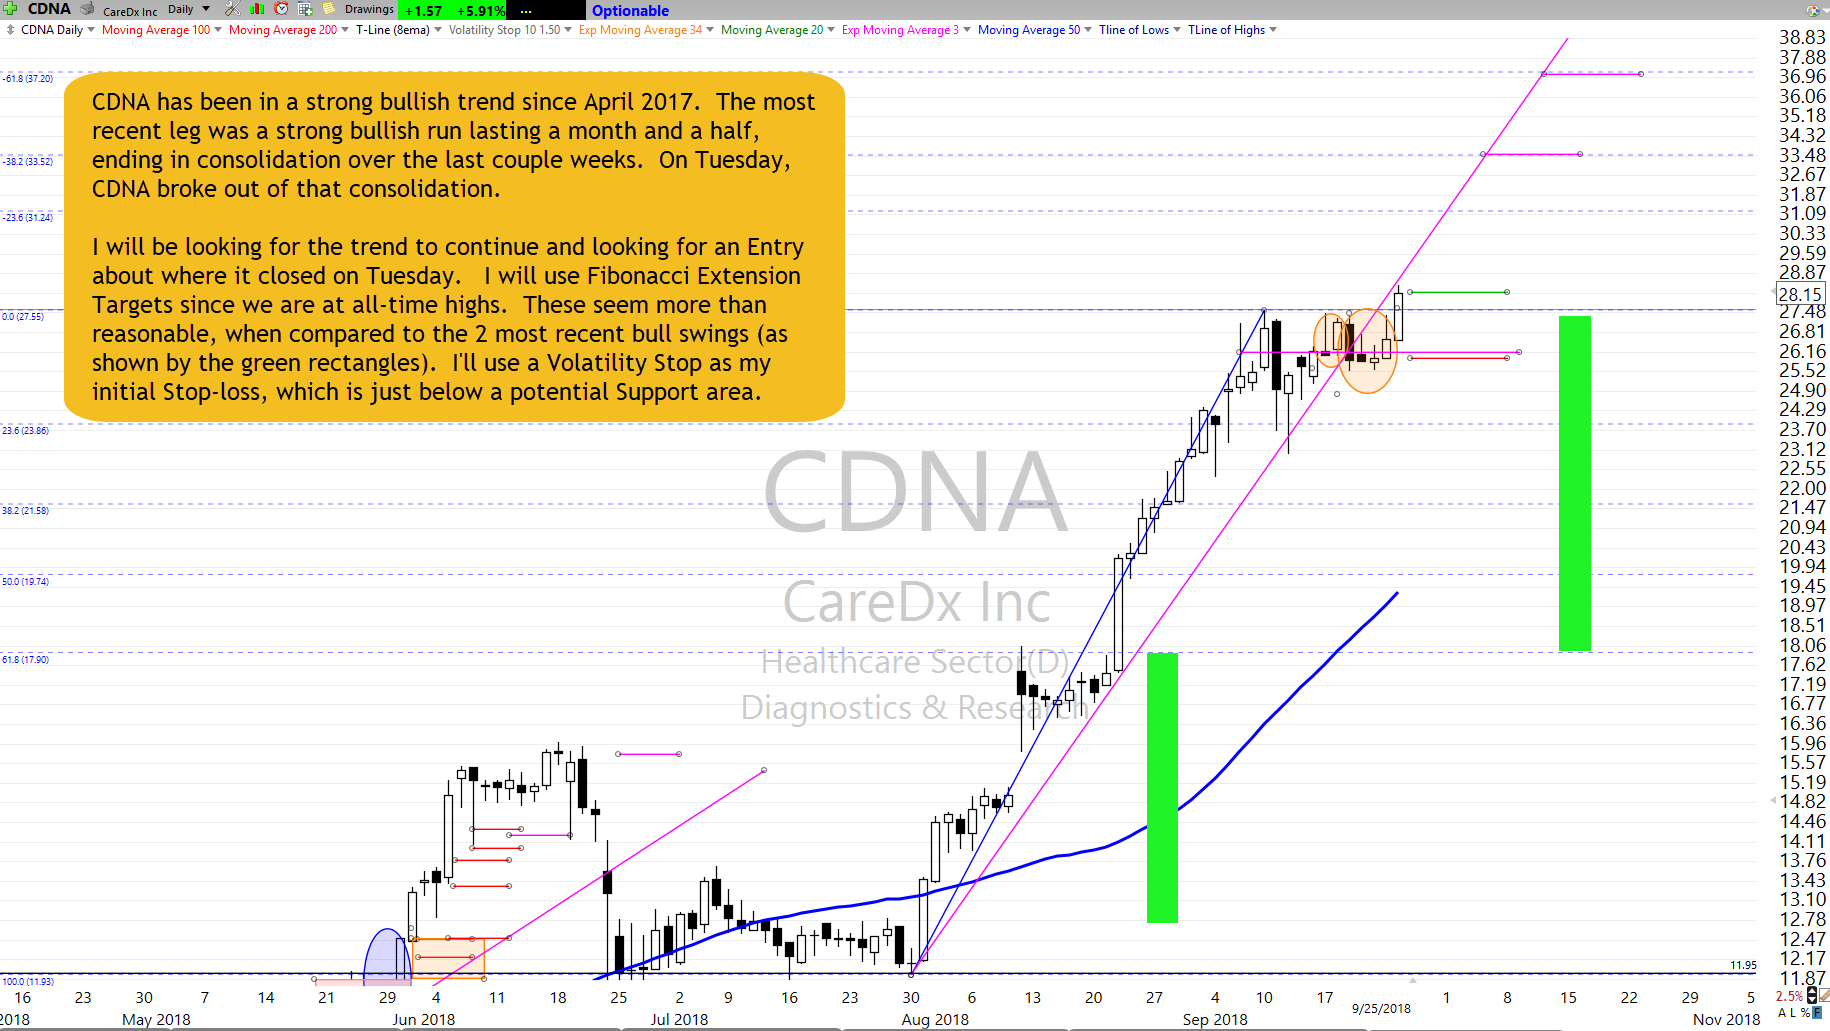
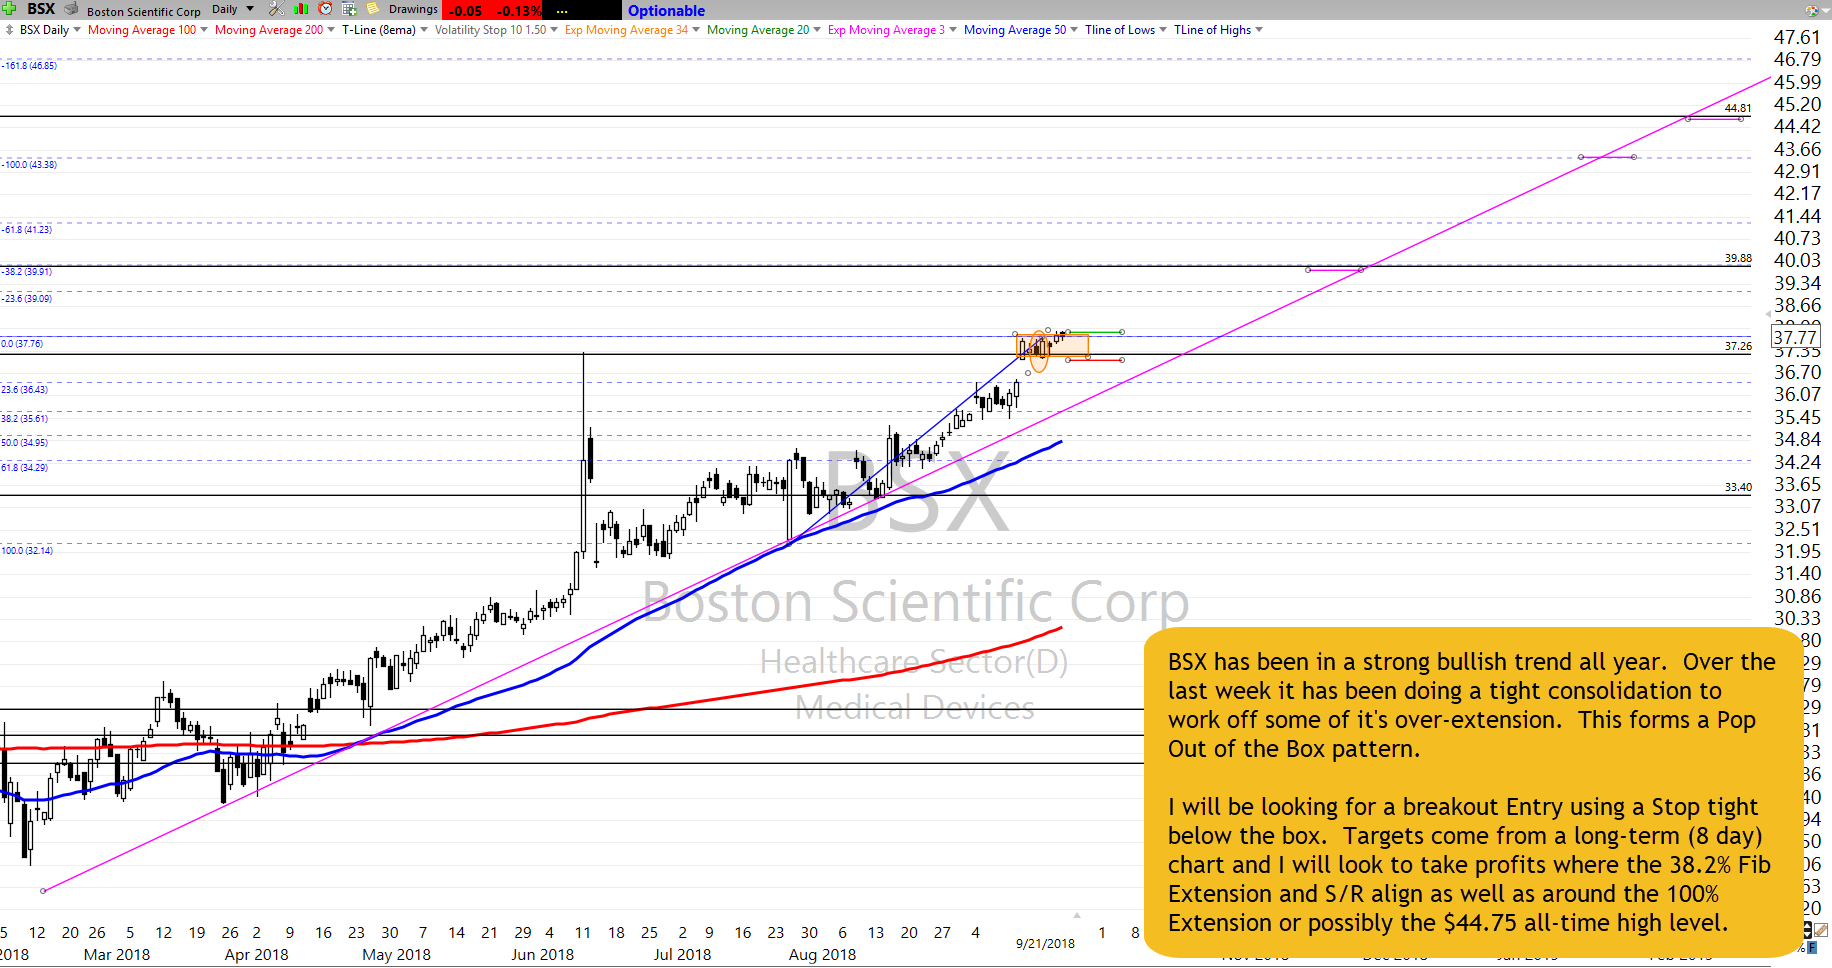
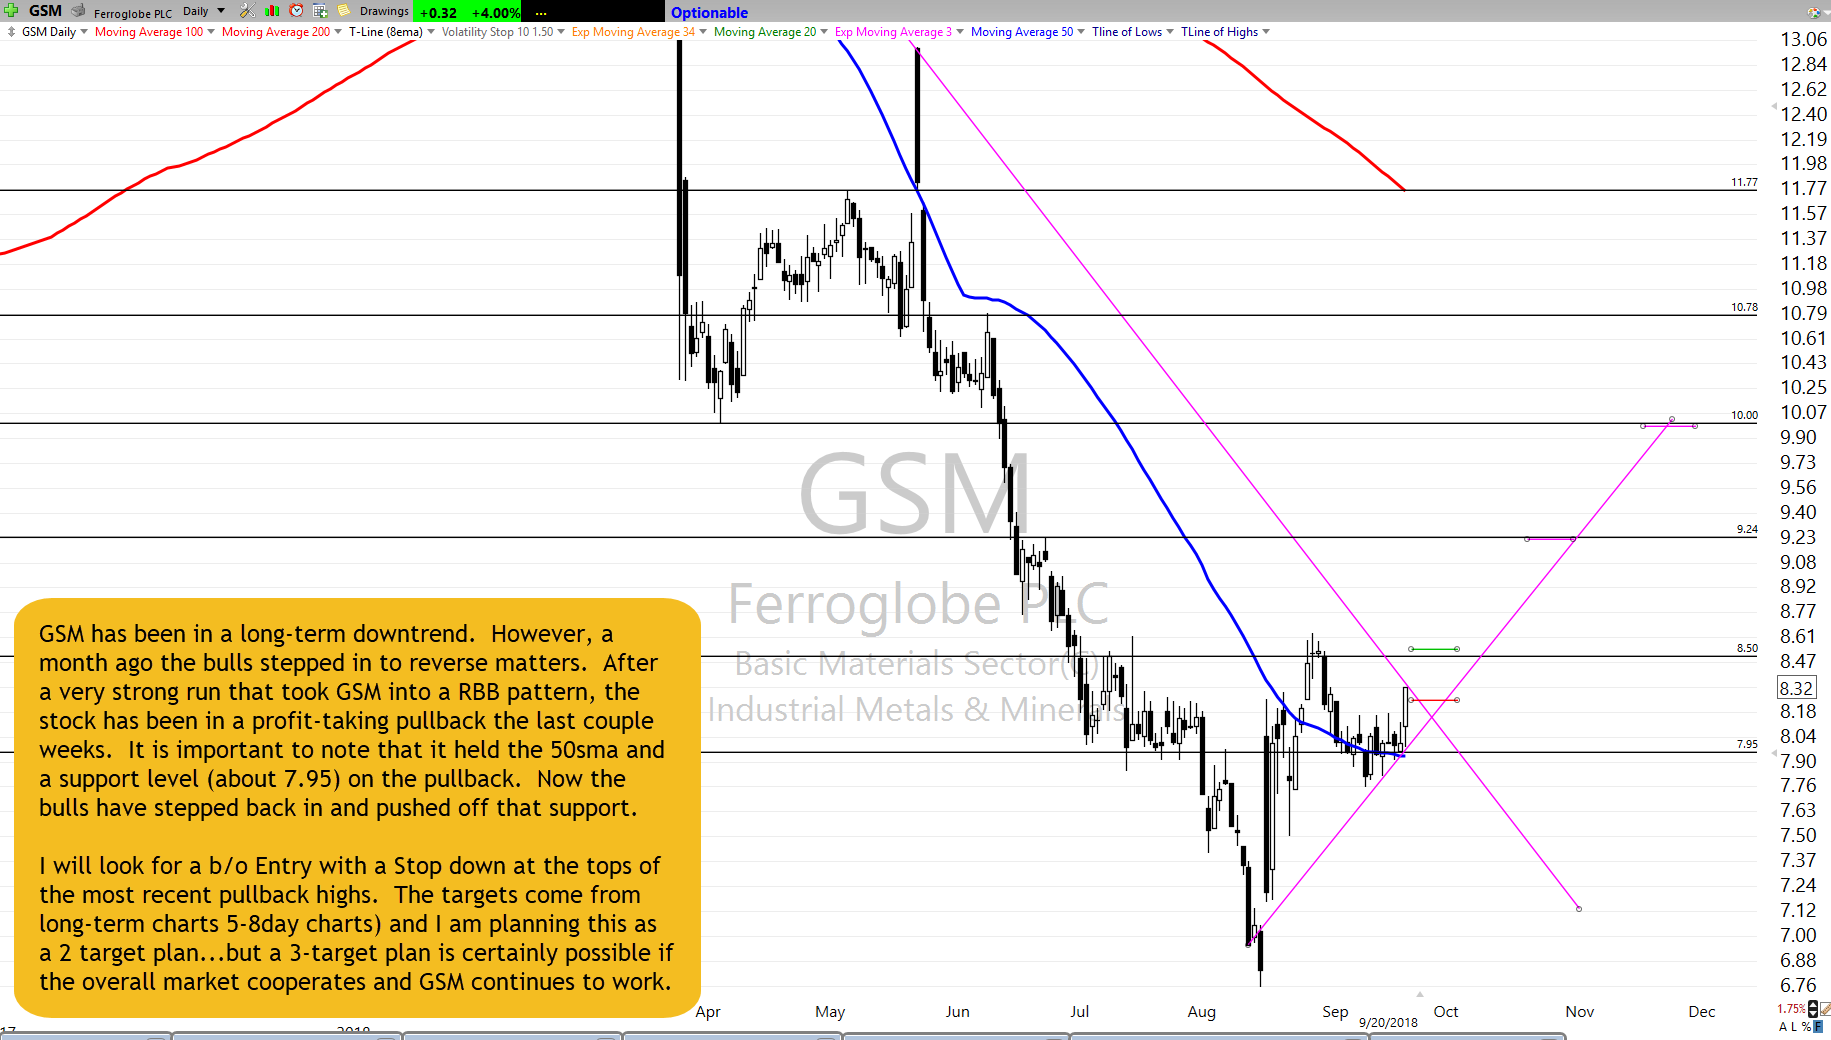
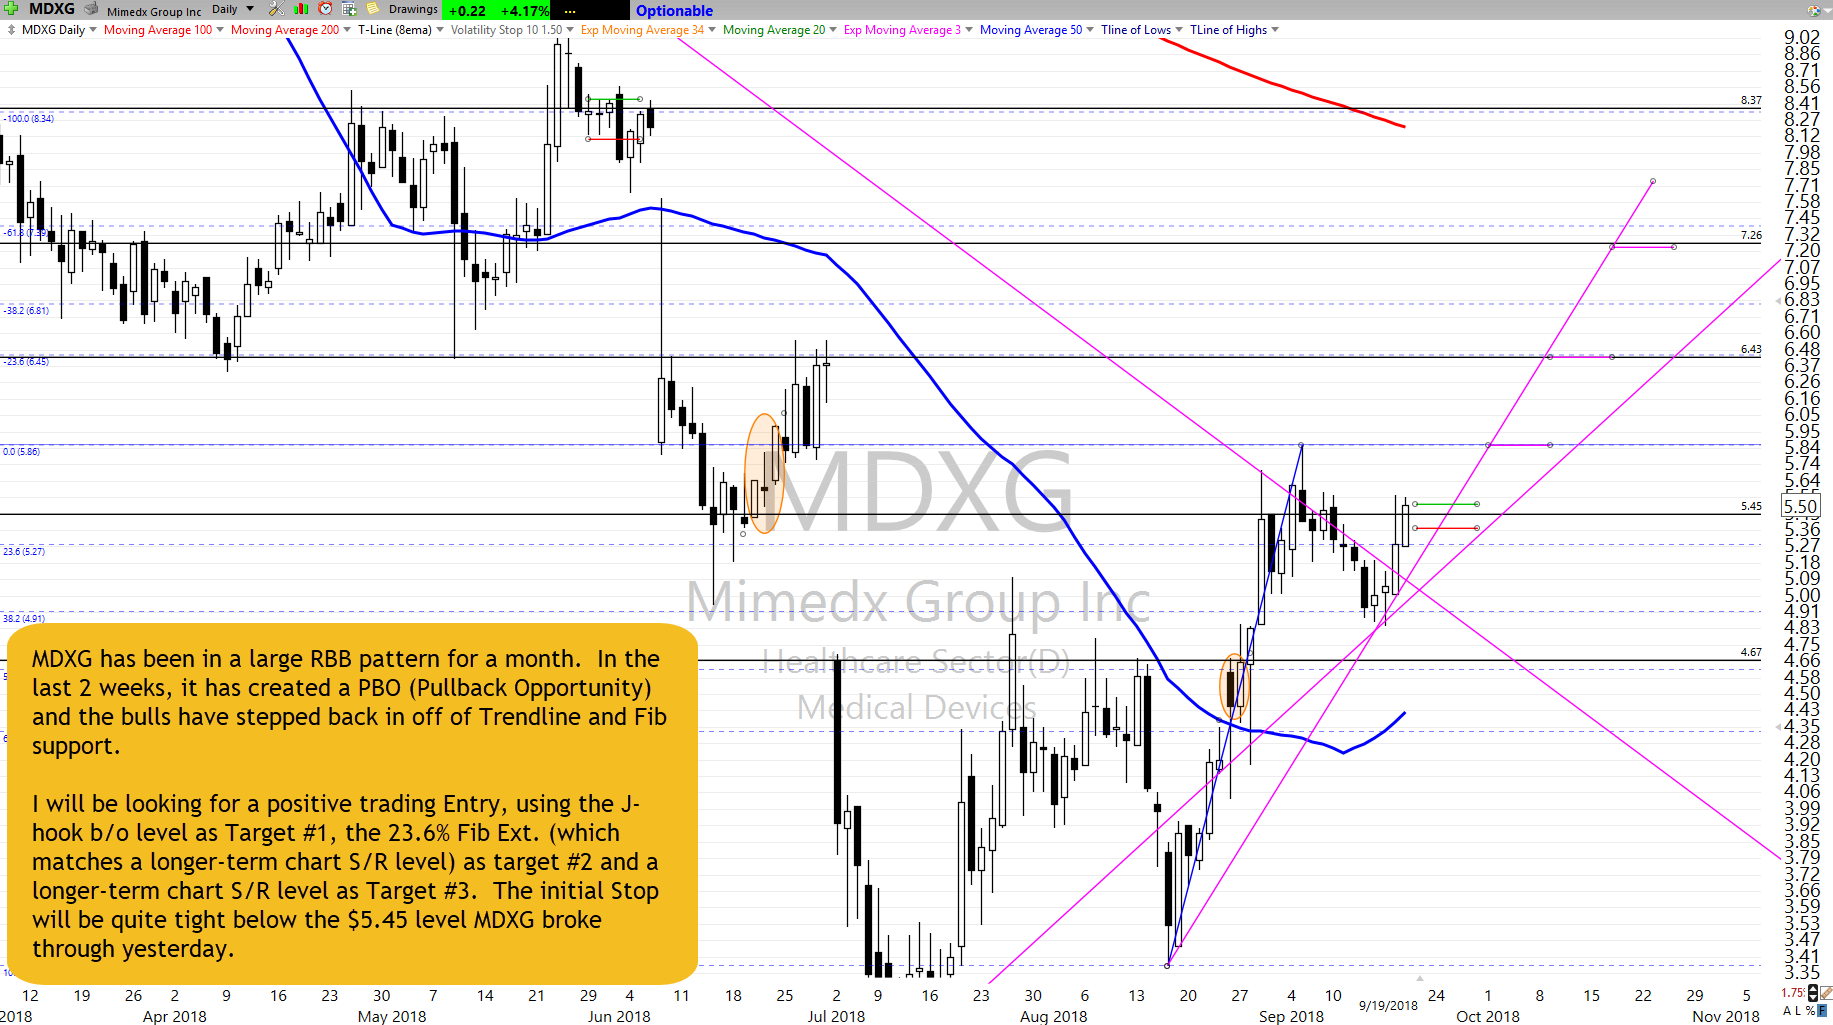
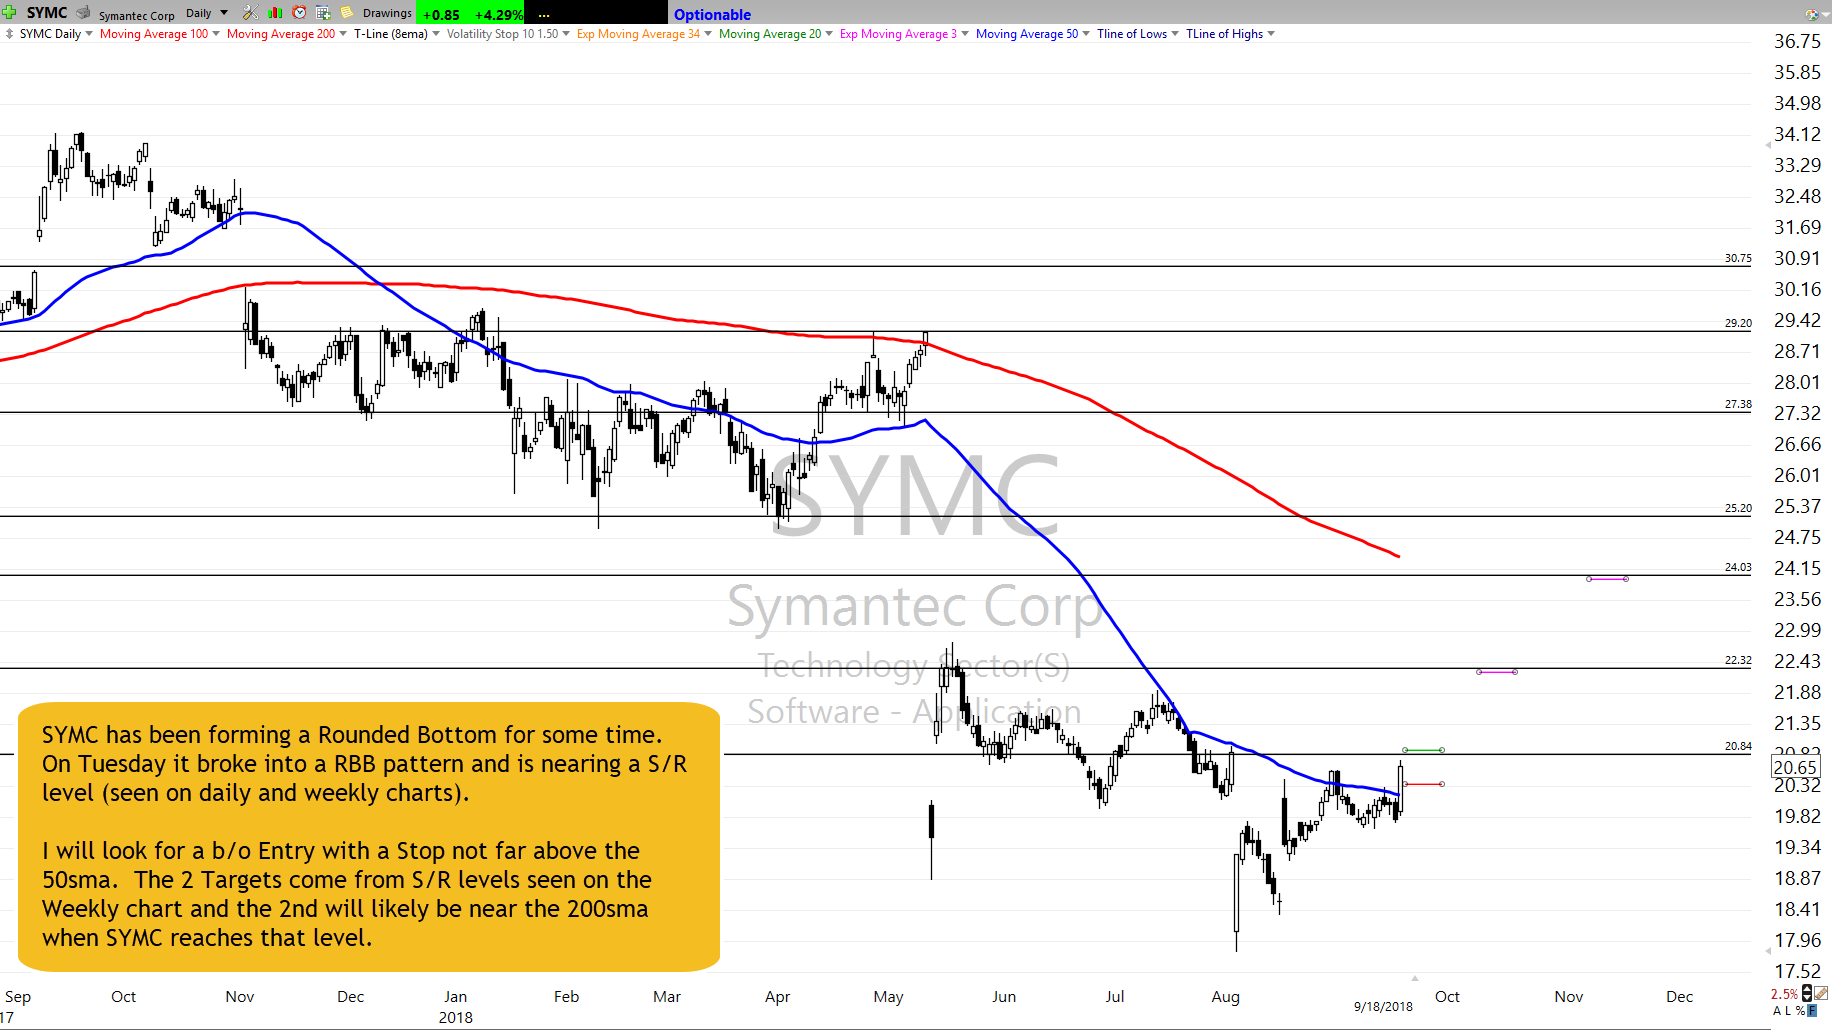
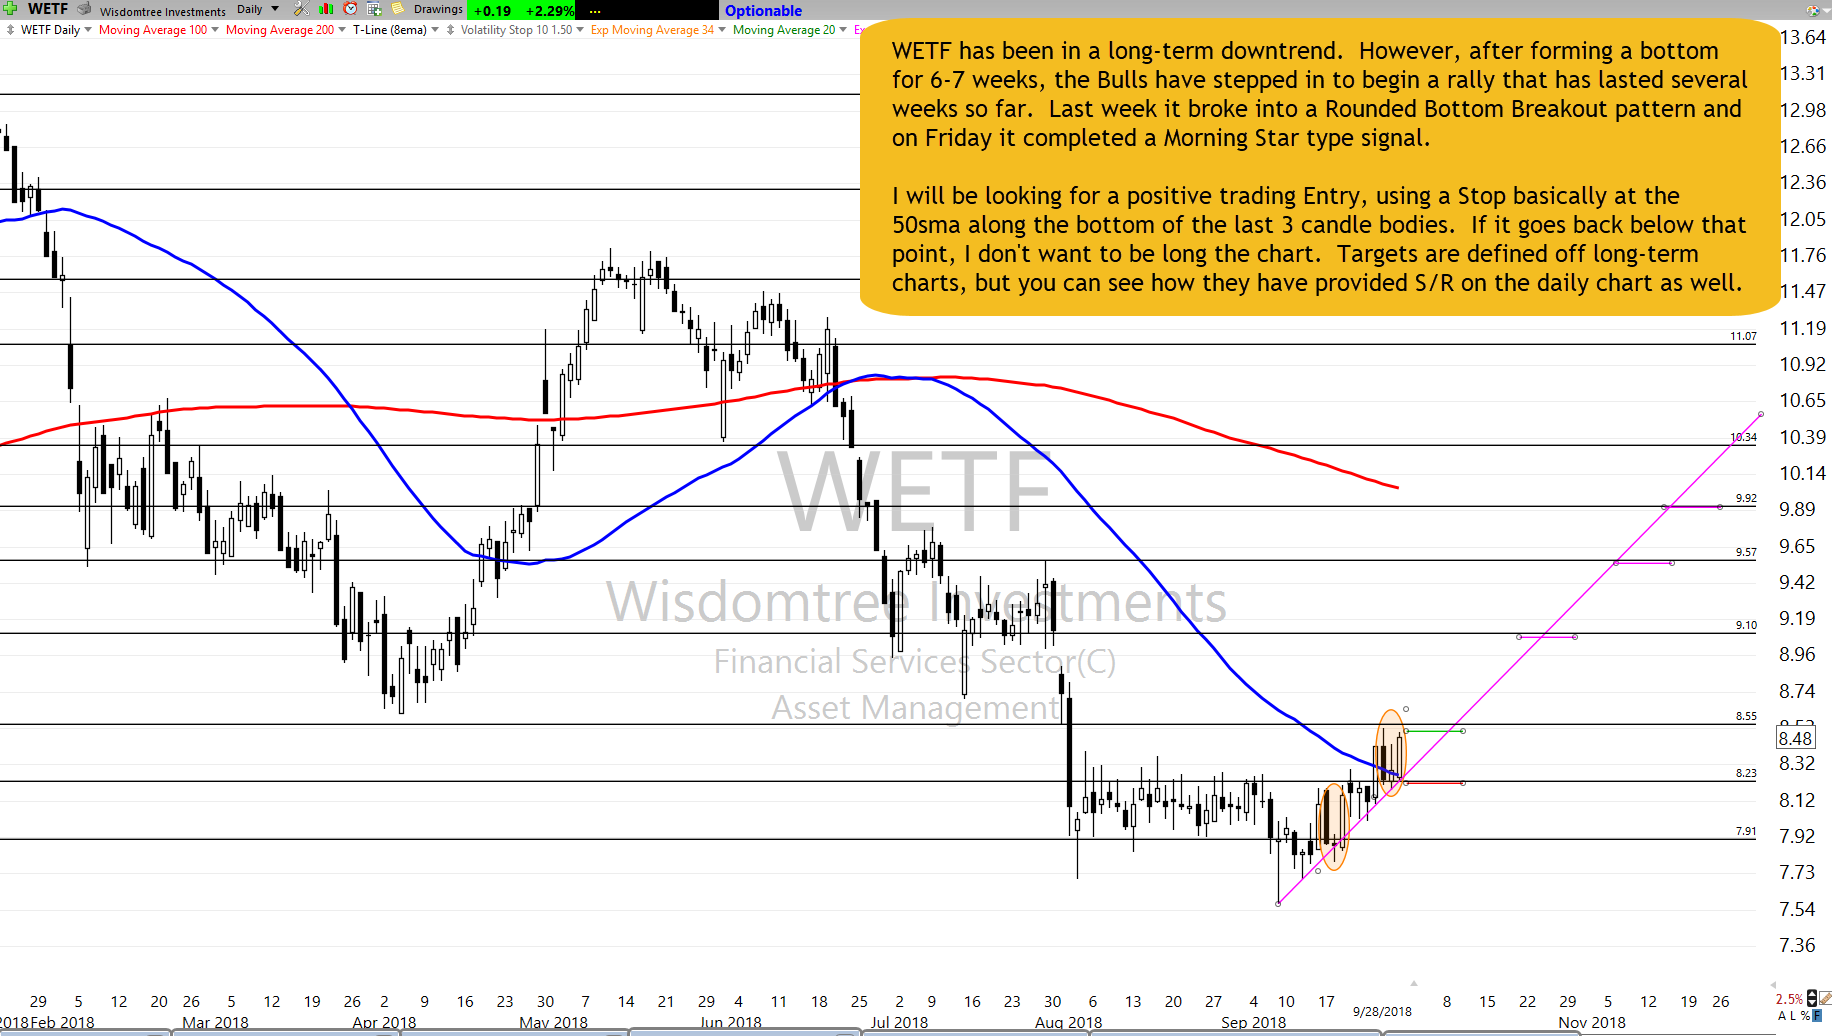
WETF has been in a long-term downtrend. However, after forming a bottom for 6-7 weeks, the Bulls have stepped in to begin a rally that has lasted several weeks so far. Last week it broke into a Rounded Bottom Breakout pattern and on Friday it completed a Morning Star type signal.

I will be looking for a positive trading Entry, using a Stop basically at the 50sma along the bottom of the last 3 candle bodies. If it goes back below that point, I don’t want to be long this chart. Targets are defined off long-term charts, but you can see how they have provided S/R on the daily chart as well.

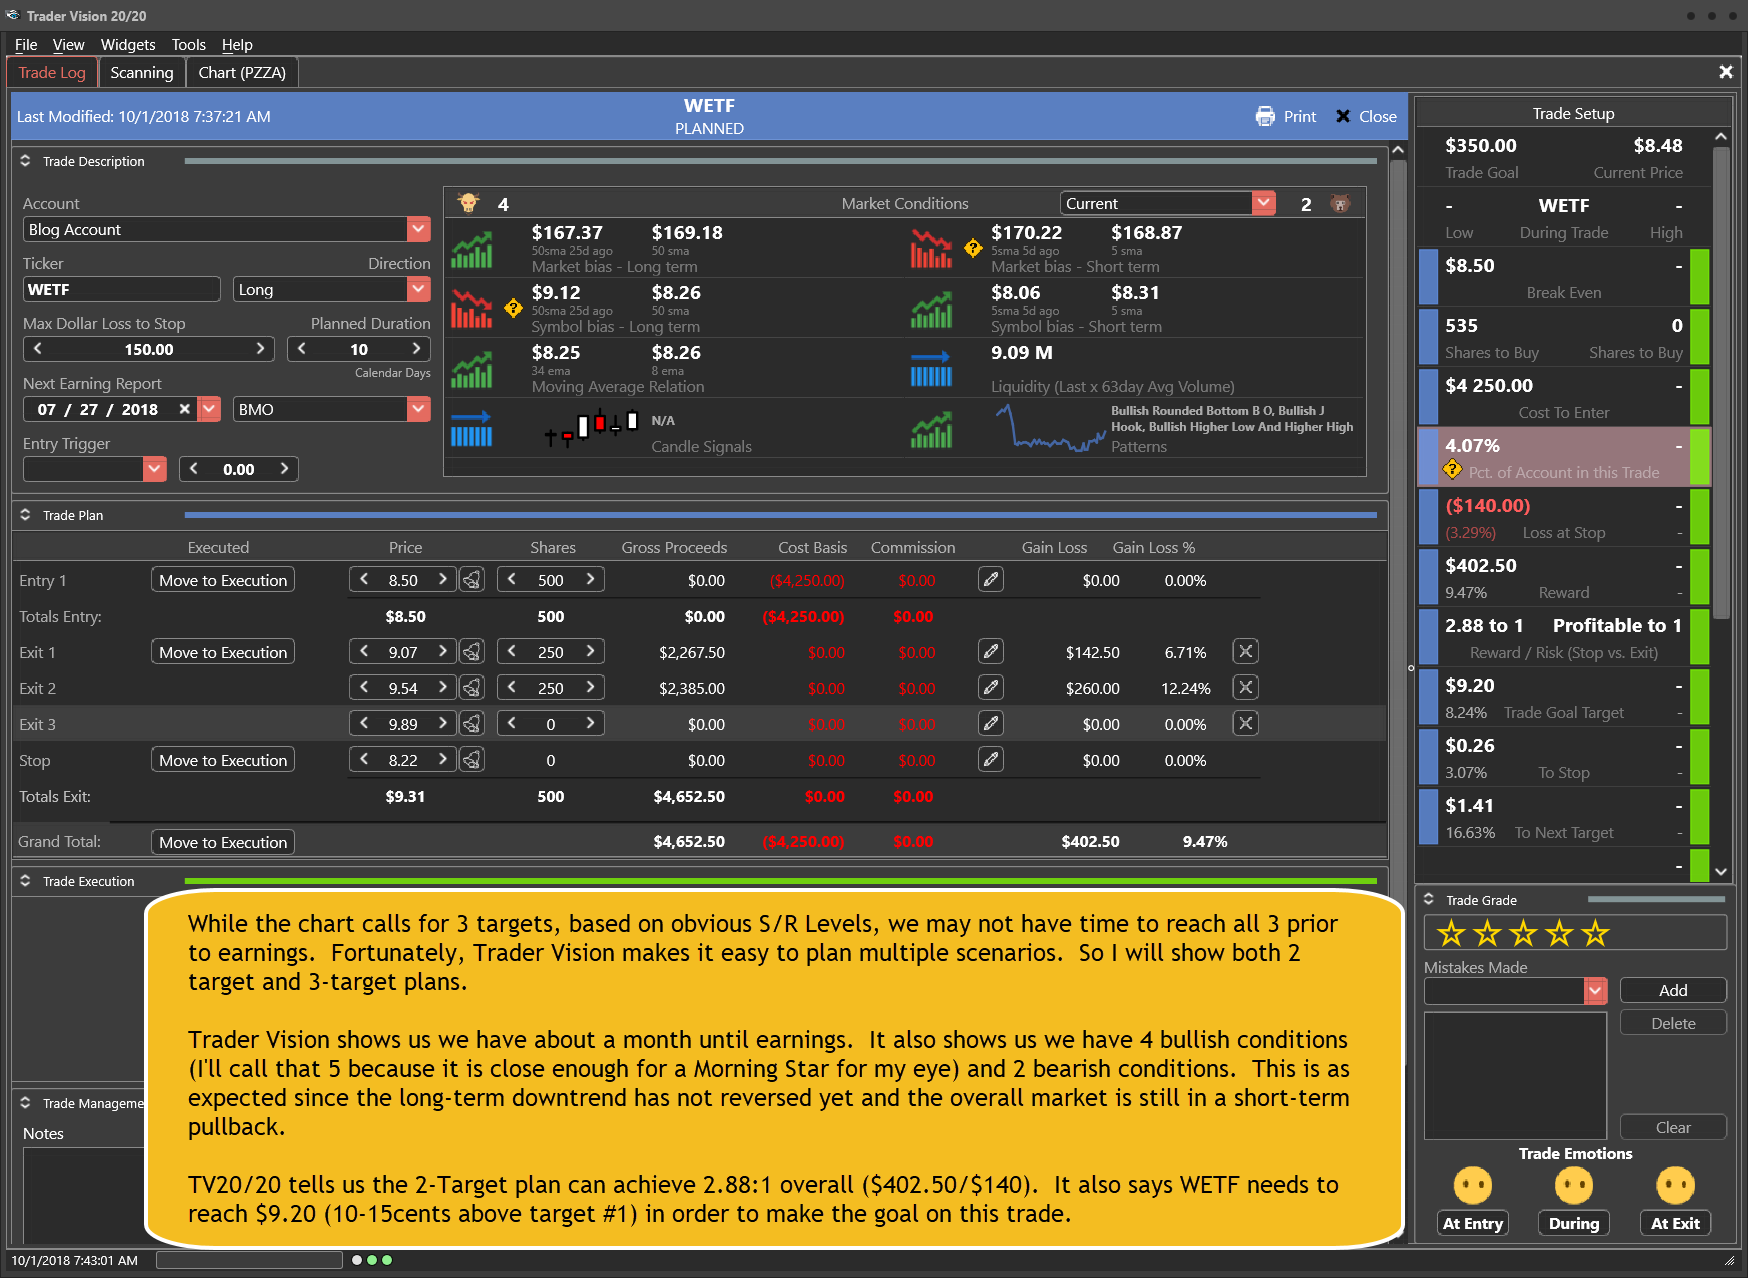
While the chart calls for 3 targets, based on obvious S/R Levels, we may not have time to reach all 3 prior to earnings. Fortunately, Trader Vision makes it easy to plan multiple scenarios. So I will show both 2 target and 3-target plans.

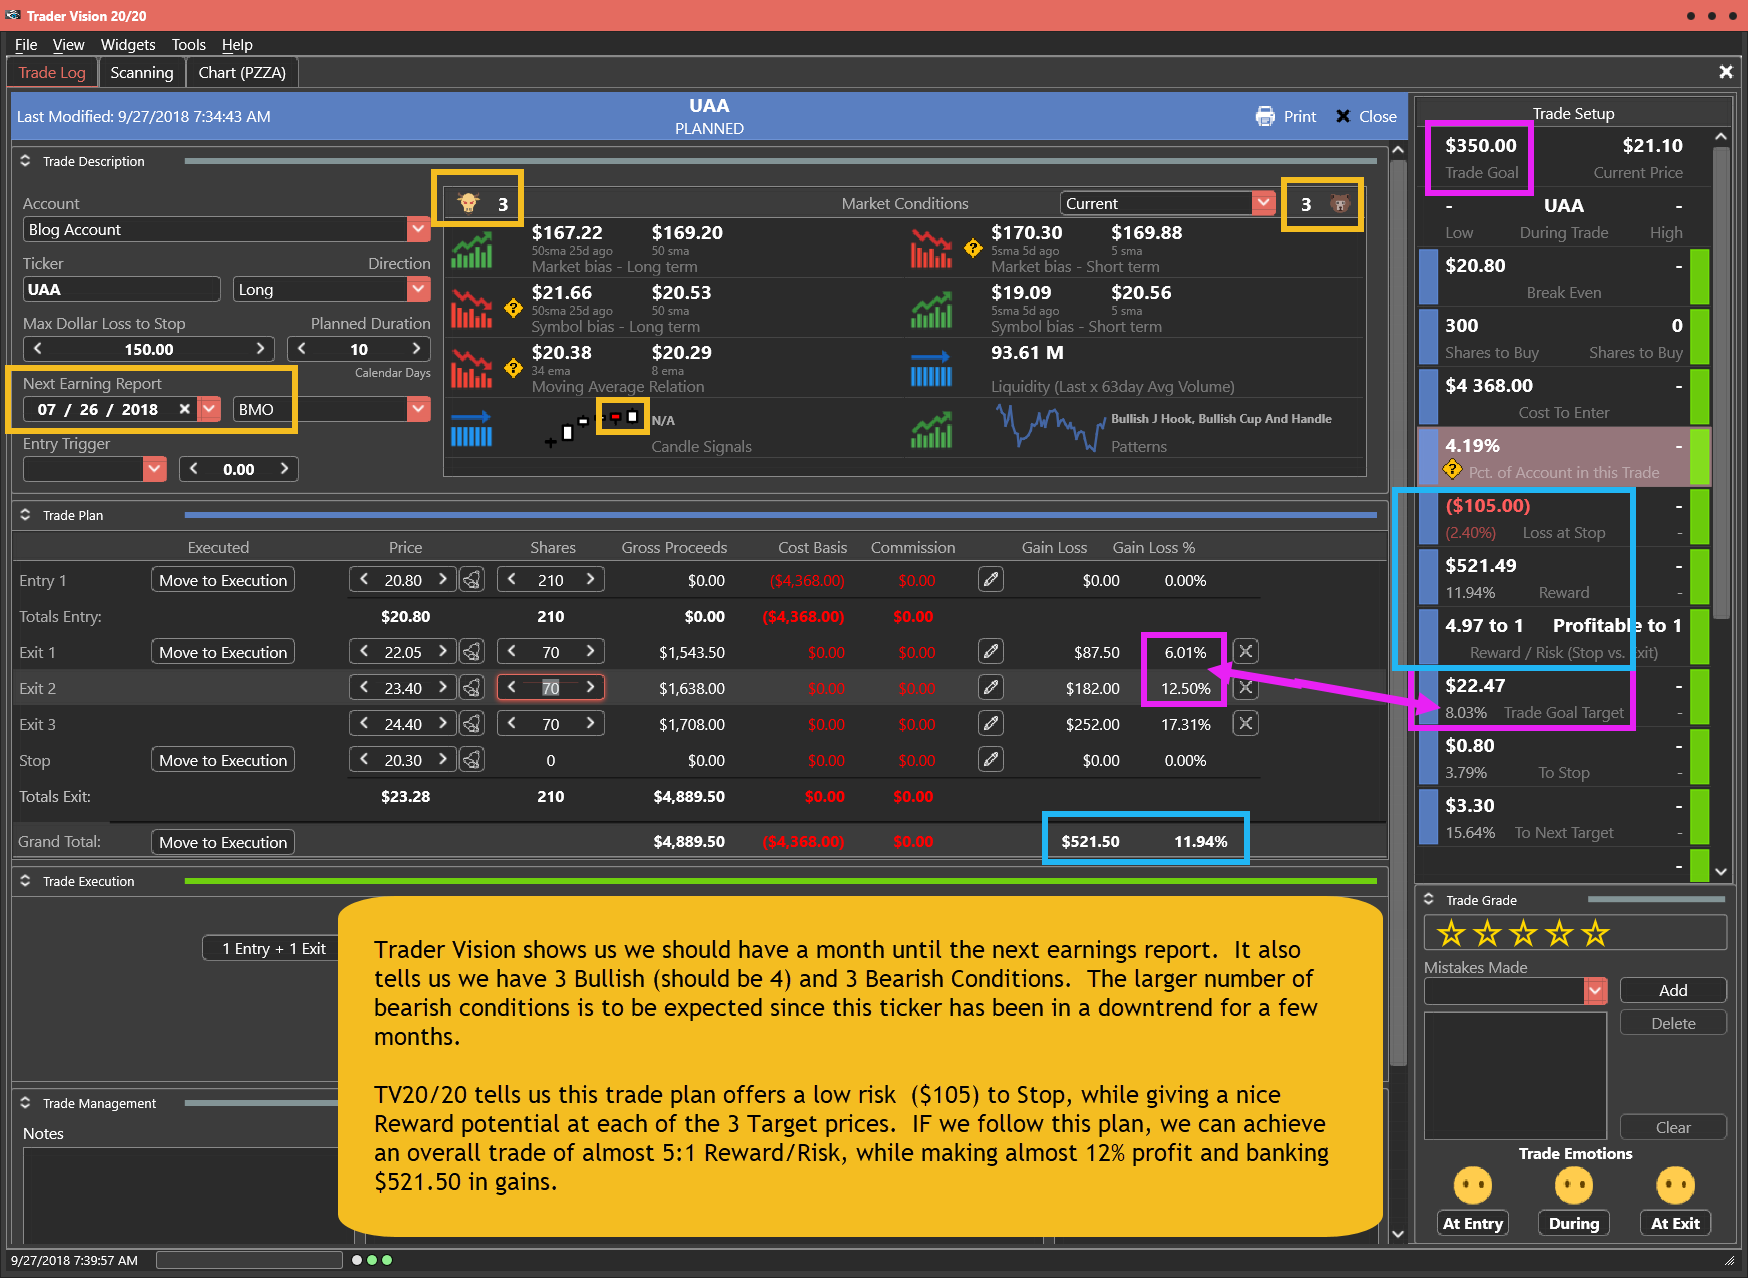
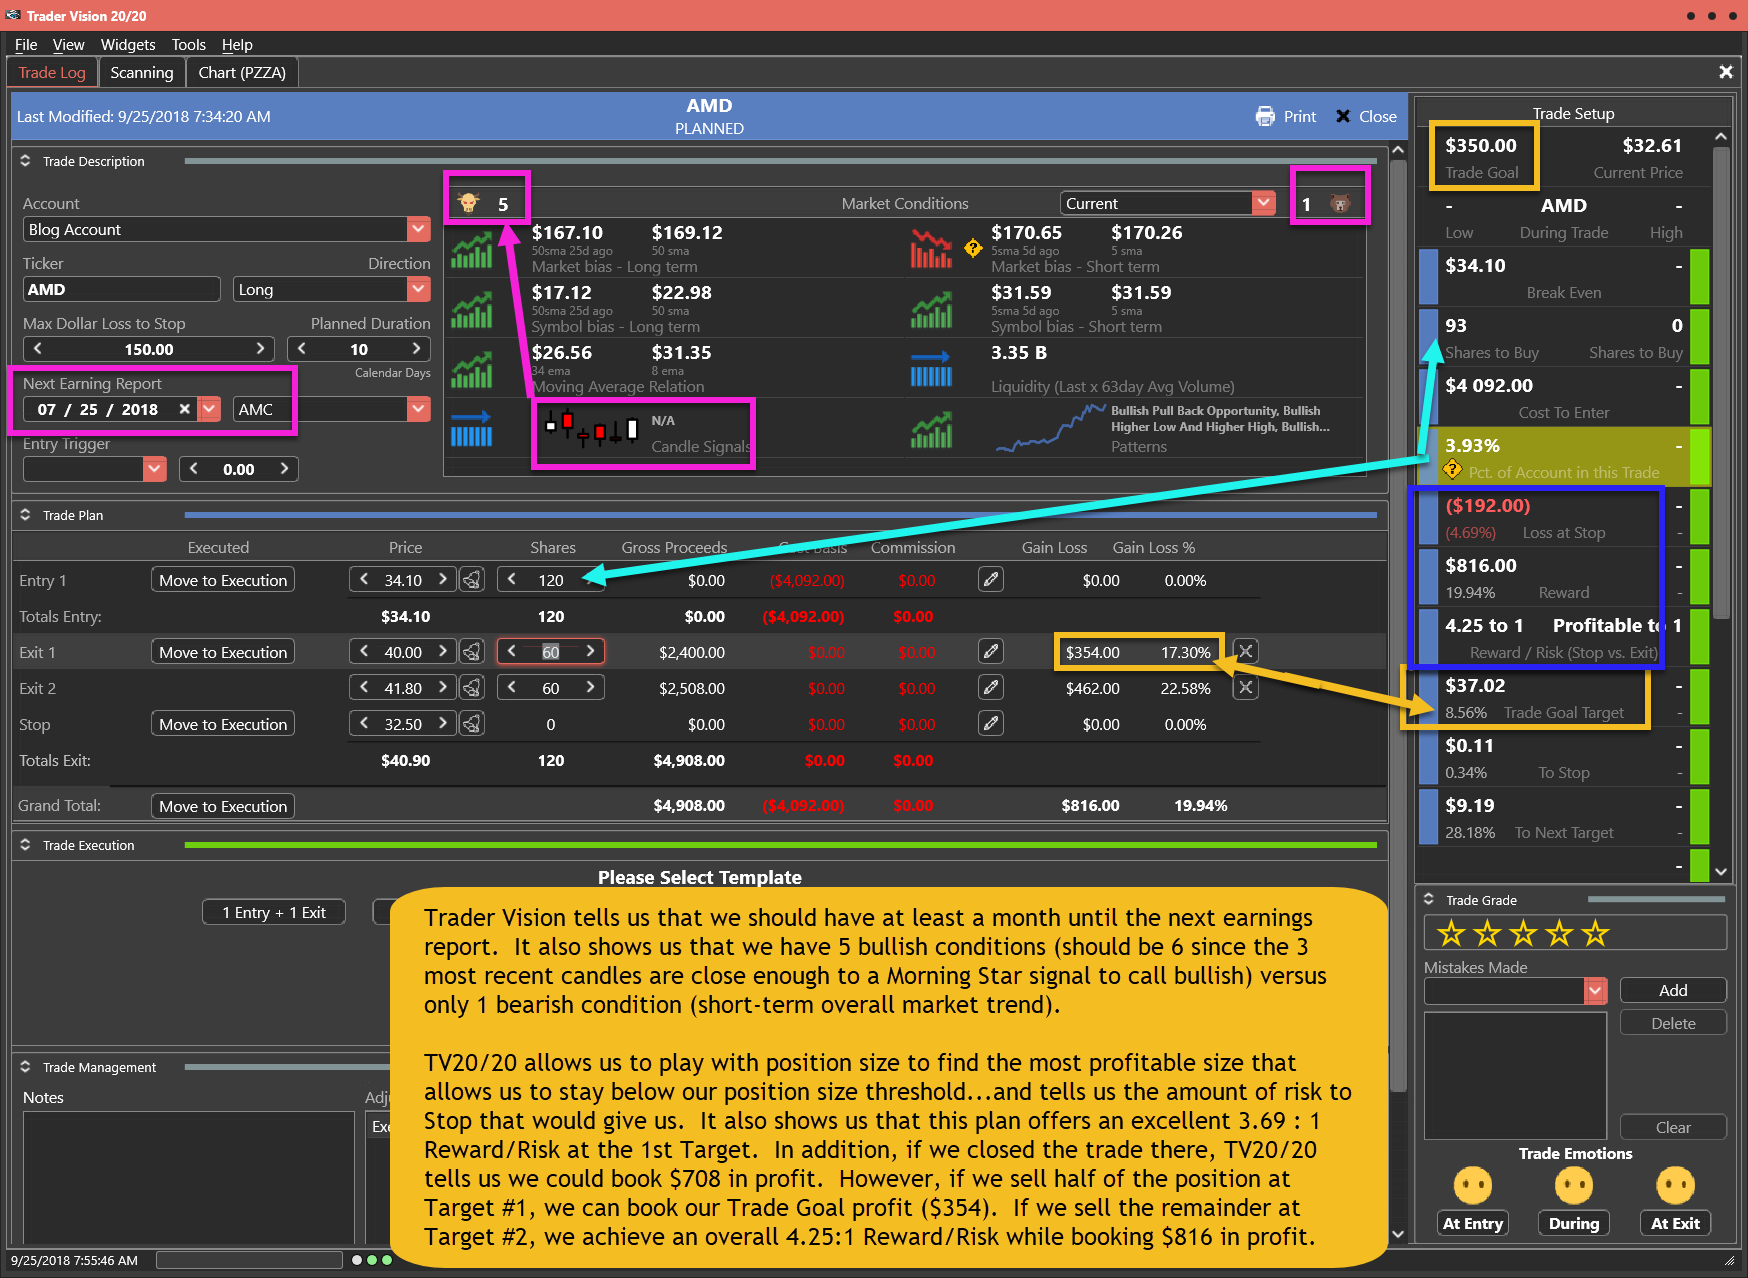
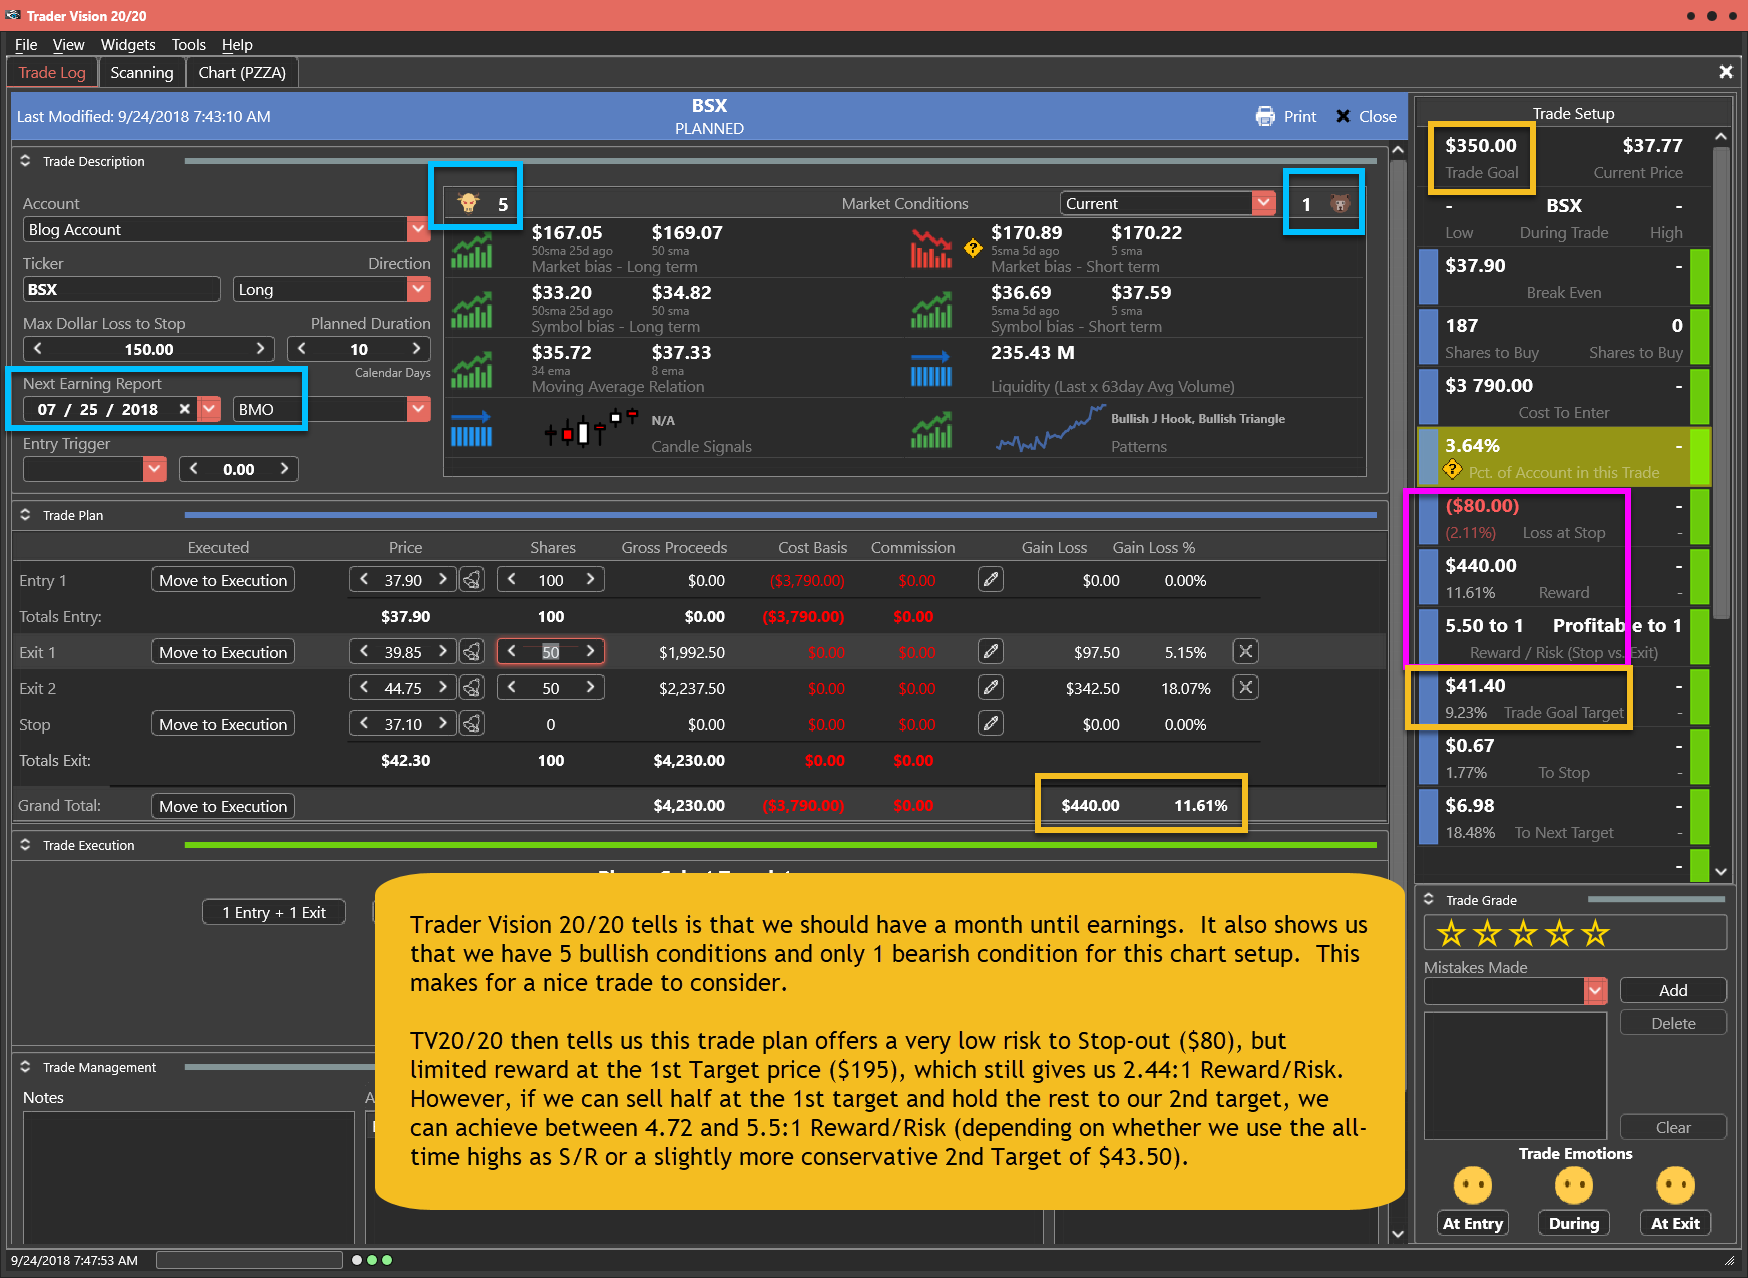
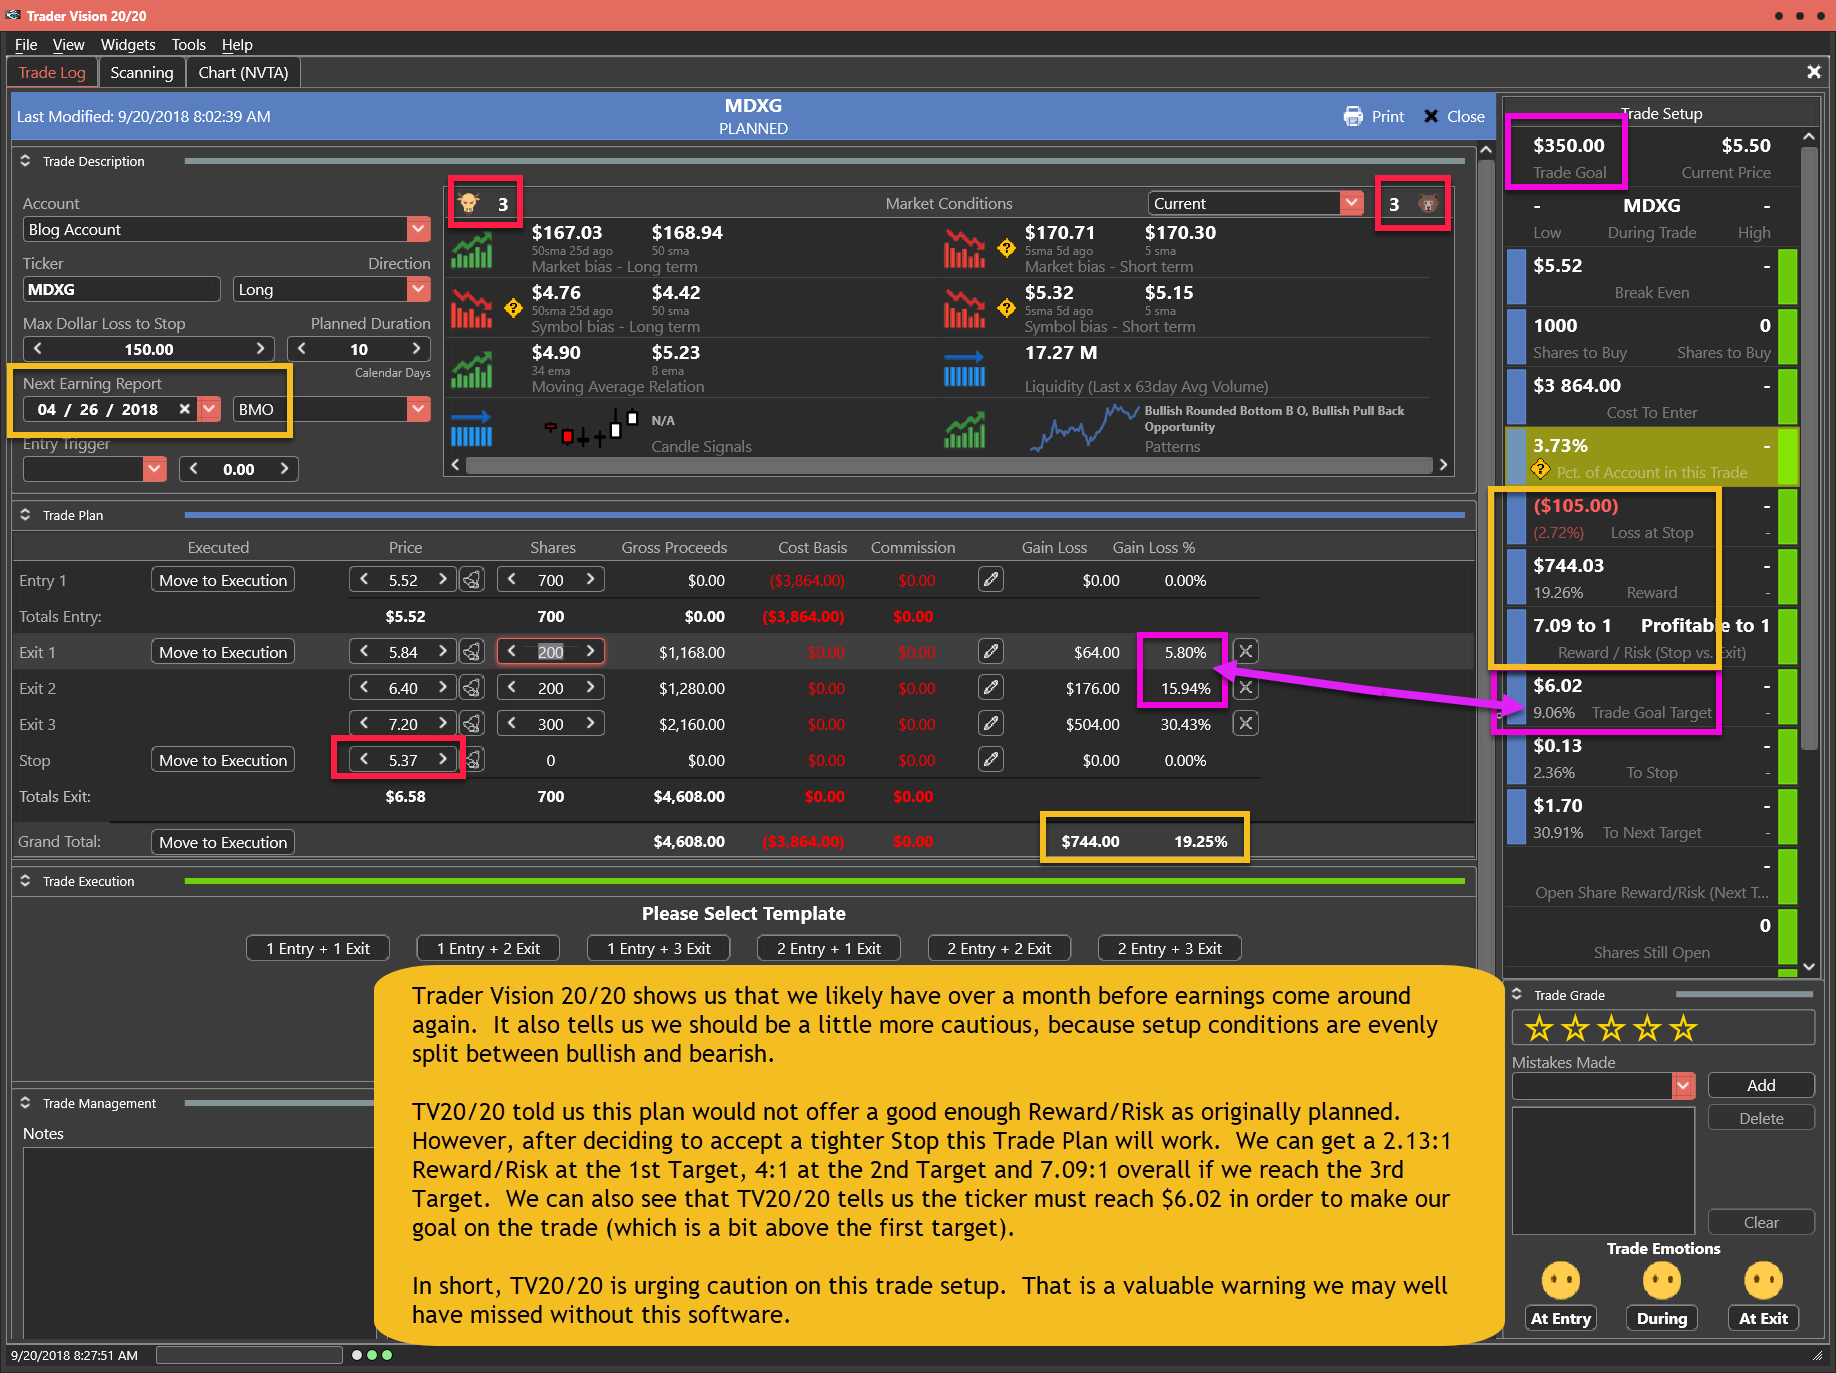
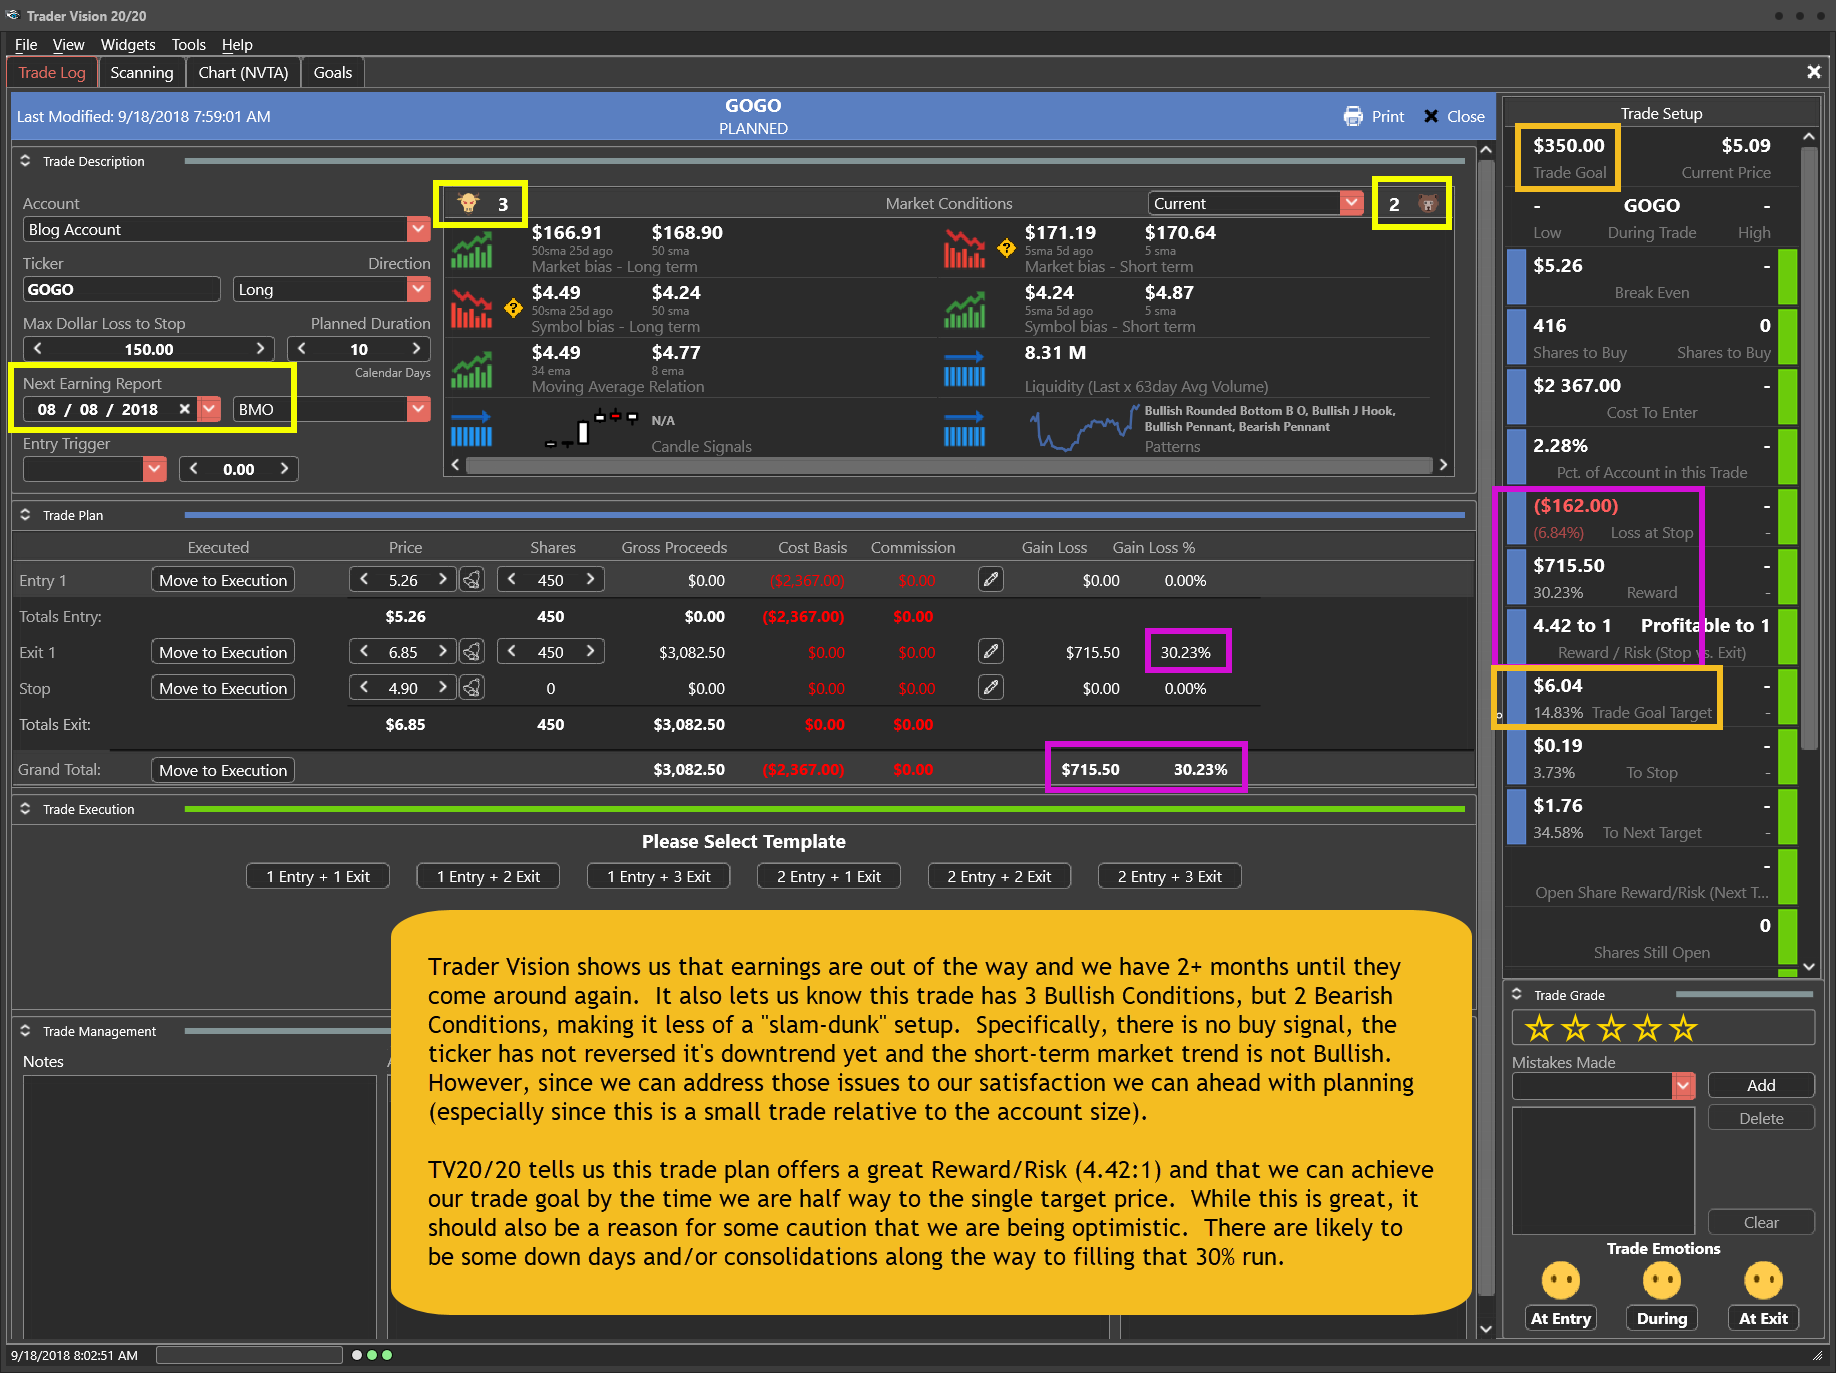
Trader Vision shows us we have about a month until earnings. It also shows us we have 4 bullish conditions (I’ll call that 5 because it is close enough for a Morning Star for my eye) and 2 bearish conditions. This is as expected since the long-term downtrend has not reversed yet and the overall market is still in a short-term pullback.

TV20/20 tells us the 2-Target plan can achieve 2.88:1 overall ($402.50/$140). It also says WETF needs to reach $9.20 (10-15cents above target #1) in order to make the goal on this trade.

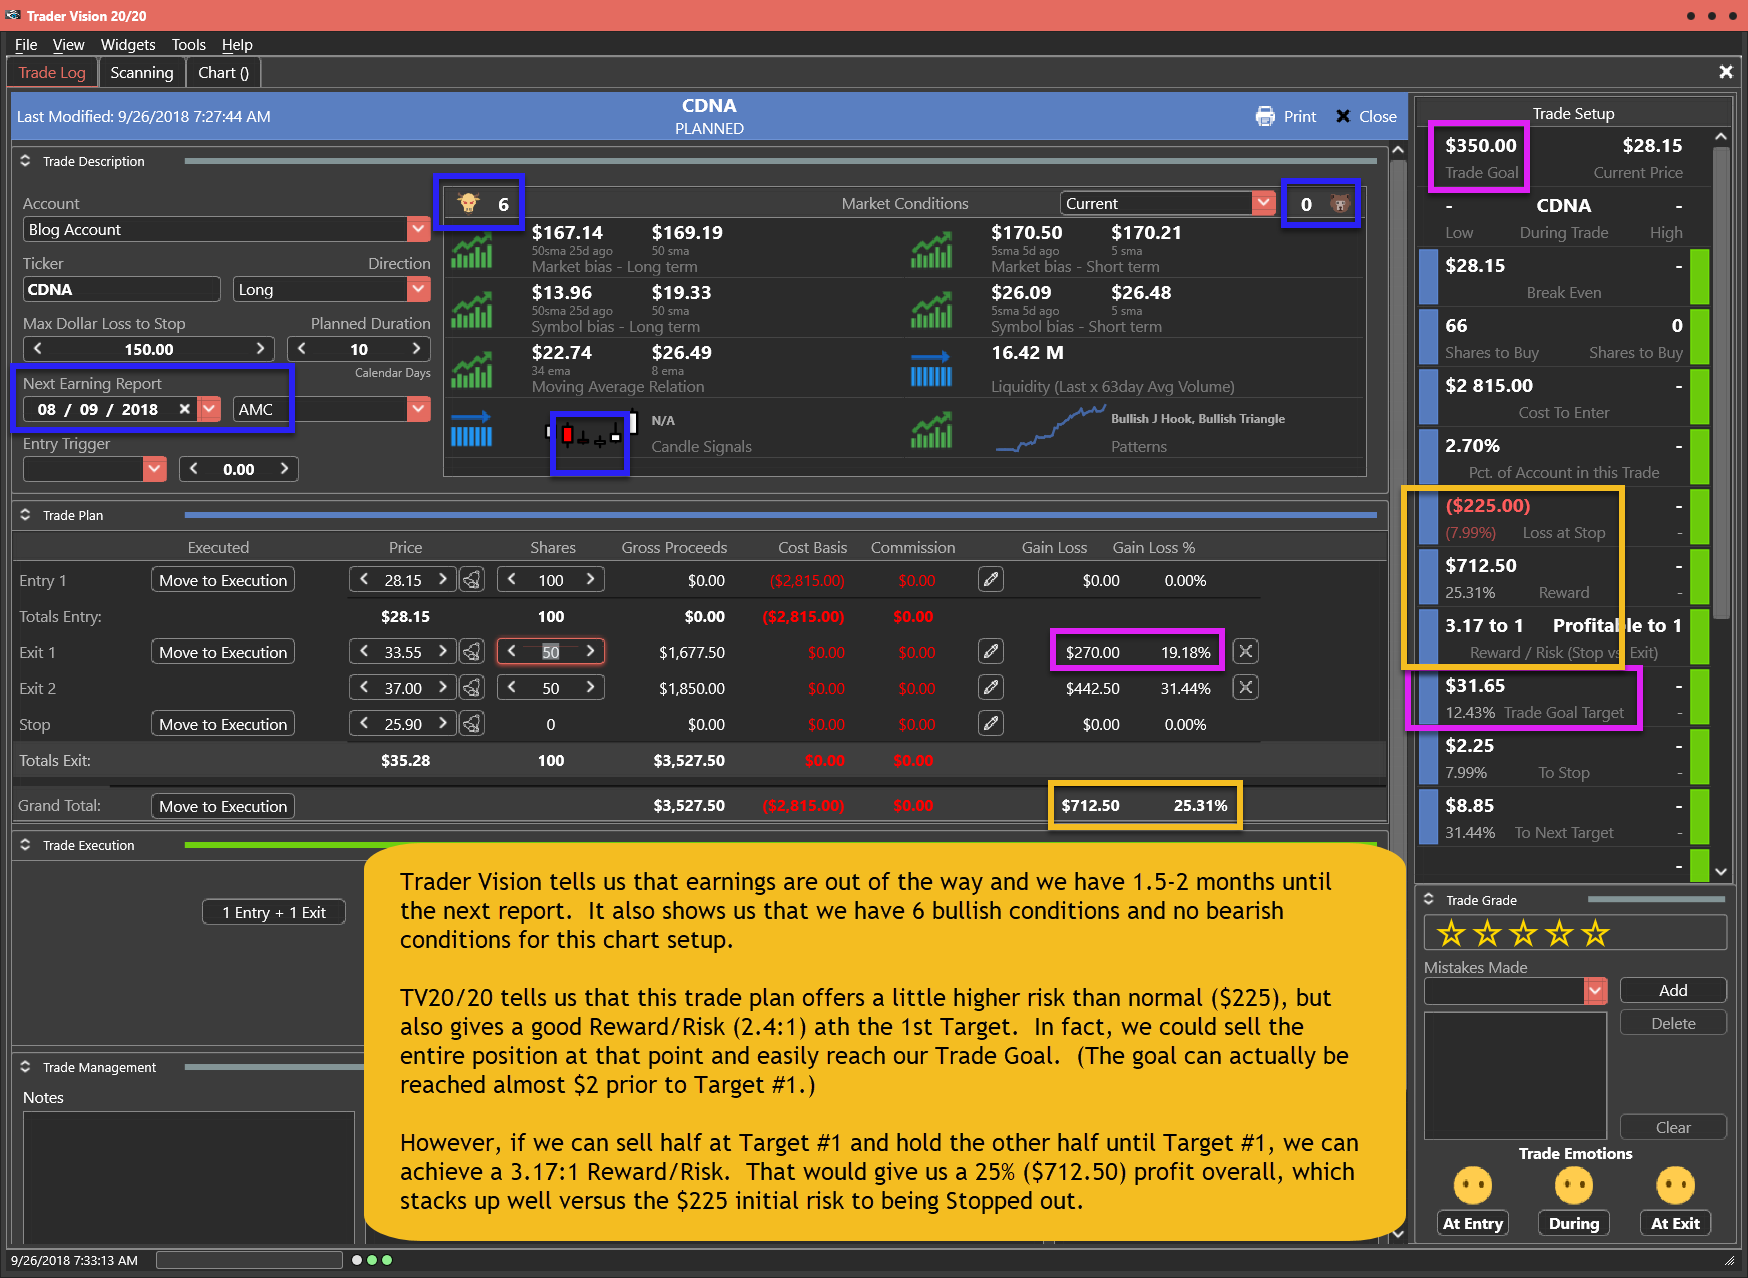
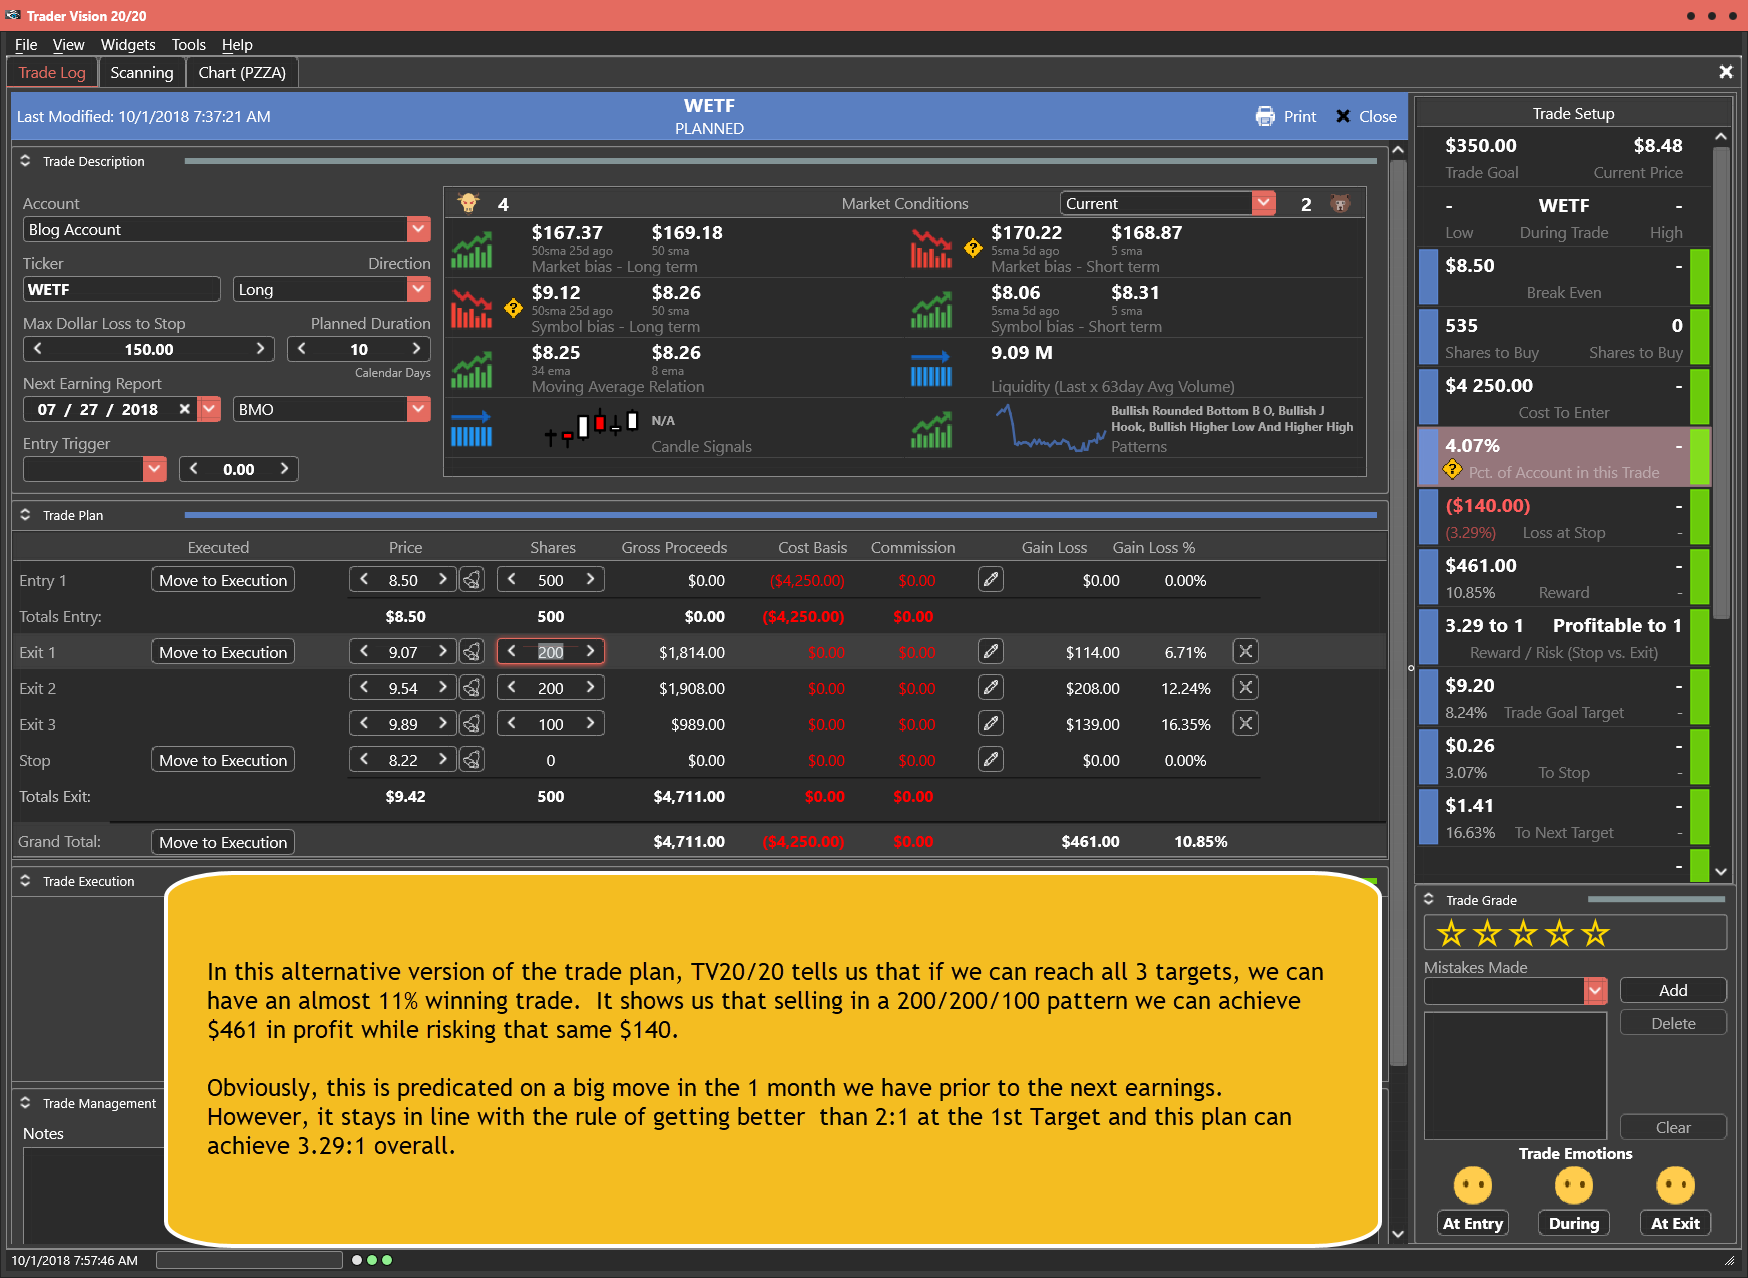
In this alternative version of the trade plan, TV20/20 tells us that if we can reach all 3 targets, we can have an almost 11% winning trade. It shows us that selling in a 200/200/100 pattern we can achieve $461 in profit while risking that same $140.

Obviously, this is predicated on a big move in the 1 month we have prior to the next earnings. However, it stays in line with the rule of getting better than 2:1 at the 1st Target and this plan can achieve 3.29:1 overall.

Having this knowledge before a trade is even entered makes it much easier to control emotions and maintain discipline.

Below is my markup of the chart and the trade plan as laid out by Trader Vision 20/20.  As a bonus, if you click the green button below, you’ll be able to watch a video of the chart markup and trade planning process.

The WETF Trade Setup – As of 9-27-18

WETF Chart Setup as of 9-27-18

The Trade Plan A

WETF Trade Plan 1 for 10-1-18

The Trade Plan B

Note how Trader Vision 20/20 does so much of the work for you.  Knowing the ratio of Bullish Conditions to Bearish ones as well as the overall risk of the position size, risk to Stop out and the Reward possible at each Target price can help a great deal with controlling our emotions.  Knowing the dollar impact of every scenario ahead of time, allows us to make calm decisions during the trade.  It really takes the pressure off.  No guesswork.  No surprises.  No emotional roller coaster.

To see a short video of this trade’s chart markup and trade planning, click the button below.


Put the power to Trader Vision 20/20 to work for you…


Testimonial

Trader Vision immediately simplified the process…immediately it provided that information and guidance to me. I knew what I would risk for how much reward, I began taking trades off at the 1st target, 2nd target, I was no longer holding all my trades for the homerun. I also began implementing the stop losses if and when they were reached, not just hoping the stock would recover.  It then became easier to see what patterns were working for me and which were not.  It provided a much more relaxed and stress-free environment. –Joan G


***************************************************************************************************

Investing and Trading involve significant financial risk and are not suitable for everyone. Ed Carter is not a licensed financial adviser nor does he offer trade recommendations or investment advice to anyone. No communication from Hit and Run Candlesticks Inc. is to be considered financial or trading advice. All information is intended for Educational Purposes Only. Terms of Service.

***************************************************************************************************

UAA Setup and Trade Plan

Today’s Featured Trade Idea is UAA.

Members can join us in Trading Room #1 as Rick reviews the UAA setup and other Trade-Ideas at 9:10am Eastern.  For now, here are my own analysis and a potential trade plan made using our Trader Vision 20/20 software.

UAA has been in a downtrend all summer. This includes several failures to break the downtrend. In the last week, a Trader’s Best Friend Signal started the last run up to retest. This time, UAA broke through and held a S/R level. Finally, on Wed. it printed a Bullish Engulfing signal that broke through and closed above the downtrend.

I will be looking for an inside day buy (on a successful retest of the downtrend), using a Stop below the S/R level that held the last 3 days. The 3 target prices come from S/R levels seen in daily and longer-term charts and represent a run up to the pre-downtrend highs.

Trader Vision shows us we should have a month until the next earnings report. It also tells us we have 3 Bullish (should be 4) and 3 Bearish Conditions. The larger number of bearish conditions is to be expected since this ticker has been in a downtrend for a few months.

TV20/20 tells us this trade plan offers a low risk ($105) to Stop, while giving a nice Reward potential at each of the 3 Target prices. If we follow this plan, we can achieve an overall trade of almost 5:1 Reward/Risk, while making almost 12% profit and banking $521.50 in gains.

Having this knowledge before a trade is even entered makes it much easier to control emotions and maintain discipline.

Below is my markup of the chart and the trade plan as laid out by Trader Vision 20/20.  As a bonus, if you click the green button below, you’ll be able to watch a video of the chart markup and trade planning process.

The UAA Trade Setup – As of 9-26-18

UAA Chart Setup as of 9-26-18

The Trade Plan

UAA Trade Plan for 9-27-18

Note how Trader Vision 20/20 does so much of the work for you.  Knowing the ratio of Bullish Conditions to Bearish ones as well as the overall risk of the position size, risk to Stop out and the Reward possible at each Target price can help a great deal with controlling our emotions.  Knowing the dollar impact of every scenario ahead of time, allows us to make calm decisions during the trade.  It really takes the pressure off.  No guesswork.  No surprises.  No emotional roller coaster.

To see a short video of this trade’s chart markup and trade planning, click the button below.


Put the power to Trader Vision 20/20 to work for you…


Testimonial

Trader Vision immediately simplified the process…immediately it provided that information and guidance to me. I knew what I would risk for how much reward, I began taking trades off at the 1st target, 2nd target, I was no longer holding all my trades for the homerun. I also began implementing the stop losses if and when they were reached, not just hoping the stock would recover.  It then became easier to see what patterns were working for me and which were not.  It provided a much more relaxed and stress-free environment. –Joan G


***************************************************************************************************

Investing and Trading involve significant financial risk and are not suitable for everyone. Ed Carter is not a licensed financial adviser nor does he offer trade recommendations or investment advice to anyone. No communication from Hit and Run Candlesticks Inc. is to be considered financial or trading advice. All information is intended for Educational Purposes Only. Terms of Service.

***************************************************************************************************

CDNA Setup and Trade Plan

Today’s Featured Trade Idea is CDNA.

Members can join us in Trading Room #1 as Rick reviews the CDNA setup and other Trade-Ideas at 9:10am Eastern.  For now, here are my own analysis and a potential trade plan made using our Trader Vision 20/20 software.

CDNA has been in a strong bullish trend since April 2017. The most recent leg was a strong bullish run lasting a month and a half, ending in consolidation over the last couple weeks. On Tuesday, CDNA broke out of that consolidation.

I will be looking for the trend to continue and looking for an Entry about where it closed on Tuesday. I will use Fibonacci Extension Targets since we are at all-time highs. These seem more than reasonable, when compared to the 2 most recent bull swings (as shown by the green rectangles). I’ll use a Volatility Stop as my initial Stop-loss, which is just below a potential Support area.

Trader Vision tells us that earnings are out of the way and we have 1.5-2 months until the next report. It also shows us that we have 6 bullish conditions and no bearish conditions for this chart setup.

TV20/20 tells us that this trade plan offers a little higher risk than normal ($225), but also gives a good Reward/Risk (2.4:1) ath the 1st Target. In fact, we could sell the entire position at that point and easily reach our Trade Goal. (The goal can actually be reached almost $2 prior to Target #1.)

However, if we can sell half at Target #1 and hold the other half until Target #1, we can achieve a 3.17:1 Reward/Risk. That would give us a 25% ($712.50) profit overall, which stacks up well versus the $225 initial risk to being Stopped out.

Having this knowledge before a trade is even entered makes it much easier to control emotions and maintain discipline.

Below is my markup of the chart and the trade plan as laid out by Trader Vision 20/20.  As a bonus, if you click the green button below, you’ll be able to watch a video of the chart markup and trade planning process.

The CDNA Trade Setup – As of 9-25-18

CDNA Chart Setup as of 9-25-18

The Trade Plan

CDNA Trade Plan for 9-26-18

Note how Trader Vision 20/20 does so much of the work for you.  Knowing the ratio of Bullish Conditions to Bearish ones as well as the overall risk of the position size, risk to Stop out and the Reward possible at each Target price can help a great deal with controlling our emotions.  Knowing the dollar impact of every scenario ahead of time, allows us to make calm decisions during the trade.  It really takes the pressure off.  No guesswork.  No surprises.  No emotional roller coaster.

To see a short video of this trade’s chart markup and trade planning, click the button below.


Put the power to Trader Vision 20/20 to work for you…


Testimonial

Trader Vision immediately simplified the process…immediately it provided that information and guidance to me. I knew what I would risk for how much reward, I began taking trades off at the 1st target, 2nd target, I was no longer holding all my trades for the homerun. I also began implementing the stop losses if and when they were reached, not just hoping the stock would recover.  It then became easier to see what patterns were working for me and which were not.  It provided a much more relaxed and stress-free environment. –Joan G


***************************************************************************************************

Investing and Trading involve significant financial risk and are not suitable for everyone. Ed Carter is not a licensed financial adviser nor does he offer trade recommendations or investment advice to anyone. No communication from Hit and Run Candlesticks Inc. is to be considered financial or trading advice. All information is intended for Educational Purposes Only. Terms of Service.

***************************************************************************************************

AMD Setup and Trade Plan

Today’s Featured Trade Idea is AMD.

Members can join us in Trading Room #1 as Rick reviews the AMD setup and other Trade-Ideas at 9:10am Eastern.  For now, here are my own analysis and a potential trade plan made using our Trader Vision 20/20 software.

AMD has been a long-term bullish trend. The most recent leg up ran strong for a month and then formed a nice Bull Flag that culminated in a Morning Star signal on Monday. Based on long-term charts showing resistance at the recent high area, I will look for a b/o Entry.

I sill use a fairly tight Stop and use the level where a 32.8% Fib Extension of the most recent run-up and a long-term S/R level coincide as my 1st Target. The 2nd Target will be the area where long-term (all-time) highs topped out back in 2006.

Trader Vision tells us that we should have at least a month until the next earnings report. It also shows us that we have 5 bullish conditions (should be 6 since the 3 most recent candles are close enough to a Morning Star signal to call bullish) versus only 1 bearish condition (short-term overall market trend).

TV20/20 allows us to play with position size to find the most profitable size that allows us to stay below our position size threshold…and tells us the amount of risk to Stop that would give us. It also shows us that this plan offers an excellent 3.69 : 1 Reward/Risk at the 1st Target. In addition, if we closed the trade there, TV20/20 tells us we could book $708 in profit. However, if we sell half of the position at Target #1, we can book our Trade Goal profit ($354). If we sell the remainder at Target #2, we achieve an overall 4.25:1 Reward/Risk while booking $816 in profit.

Having this knowledge before a trade is even entered makes it much easier to control emotions and maintain discipline.

Below is my markup of the chart and the trade plan as laid out by Trader Vision 20/20.  As a bonus, if you click the green button below, you’ll be able to watch a video of the chart markup and trade planning process.

The AMD Trade Setup – As of 9-24-18

AMD Chart Setup as of 9-24-18

The Trade Plan

AMD Trade Plan for 9-25-18

Note how Trader Vision 20/20 does so much of the work for you.  Knowing the ratio of Bullish Conditions to Bearish ones as well as the overall risk of the position size, risk to Stop out and the Reward possible at each Target price can help a great deal with controlling our emotions.  Knowing the dollar impact of every scenario ahead of time, allows us to make calm decisions during the trade.  It really takes the pressure off.  No guesswork.  No surprises.  No emotional roller coaster.

To see a short video of this trade’s chart markup and trade planning, click the button below.


Put the power to Trader Vision 20/20 to work for you…


Testimonial

Trader Vision immediately simplified the process…immediately it provided that information and guidance to me. I knew what I would risk for how much reward, I began taking trades off at the 1st target, 2nd target, I was no longer holding all my trades for the homerun. I also began implementing the stop losses if and when they were reached, not just hoping the stock would recover.  It then became easier to see what patterns were working for me and which were not.  It provided a much more relaxed and stress-free environment. –Joan G


***************************************************************************************************

Investing and Trading involve significant financial risk and are not suitable for everyone. Ed Carter is not a licensed financial adviser nor does he offer trade recommendations or investment advice to anyone. No communication from Hit and Run Candlesticks Inc. is to be considered financial or trading advice. All information is intended for Educational Purposes Only. Terms of Service.

***************************************************************************************************

BSX Setup and Trade Plan

Today’s Featured Trade Idea is BSX.

Members can join us in Trading Room #1 as Rick reviews the BSX setup and other Trade-Ideas at 9:10am Eastern.  For now, here are my own analysis and a potential trade plan made using our Trader Vision 20/20 software.

BSX has been in a strong bullish trend all year. Over the last week it has been doing a tight consolidation to work off some of it’s over-extension. This forms a Pop Out of the Box pattern.

I will be looking for a breakout Entry using a Stop tight below the box. Targets come from a long-term (8 day) chart and I will look to take profits where the 38.2% Fib Extension and S/R align as well as around the 100% Extension or possibly the $44.75 all-time high level.

Trader Vision 20/20 tells is that we should have a month until earnings. It also shows us that we have 5 bullish conditions and only 1 bearish condition for this chart setup. This makes for a nice trade to consider.

TV20/20 then tells us this trade plan offers a very low risk to Stop-out ($80), but limited reward at the 1st Target price ($195), which still gives us 2.44:1 Reward/Risk. However, if we can sell half at the 1st target and hold the rest to our 2nd target, we can achieve between 4.72 and 5.5:1 Reward/Risk (depending on whether we use the all-time highs as S/R or a slightly more conservative 2nd Target of $43.50).

Having this knowledge before a trade is even entered makes it much easier to control emotions and maintain discipline.

Below is my markup of the chart and the trade plan as laid out by Trader Vision 20/20.  As a bonus, if you click the green button below, you’ll be able to watch a video of the chart markup and trade planning process.

The BSX Trade Setup – As of 9-21-18

BSX Chart Setup as of 9-21-18

The Trade Plan

BSX Trade Plan for 9-24-18

Note how Trader Vision 20/20 does so much of the work for you.  Knowing the ratio of Bullish Conditions to Bearish ones as well as the overall risk of the position size, risk to Stop out and the Reward possible at each Target price can help a great deal with controlling our emotions.  Knowing the dollar impact of every scenario ahead of time, allows us to make calm decisions during the trade.  It really takes the pressure off.  No guesswork.  No surprises.  No emotional roller coaster.

To see a short video of this trade’s chart markup and trade planning, click the button below.


Put the power to Trader Vision 20/20 to work for you…


Testimonial

Trader Vision immediately simplified the process…immediately it provided that information and guidance to me. I knew what I would risk for how much reward, I began taking trades off at the 1st target, 2nd target, I was no longer holding all my trades for the homerun. I also began implementing the stop losses if and when they were reached, not just hoping the stock would recover.  It then became easier to see what patterns were working for me and which were not.  It provided a much more relaxed and stress-free environment. –Joan G


***************************************************************************************************

Investing and Trading involve significant financial risk and are not suitable for everyone. Ed Carter is not a licensed financial adviser nor does he offer trade recommendations or investment advice to anyone. No communication from Hit and Run Candlesticks Inc. is to be considered financial or trading advice. All information is intended for Educational Purposes Only. Terms of Service.

***************************************************************************************************

GSM Setup and Trade Plan

Today’s Featured Trade Idea is GSM.

Members can join us in Trading Room #1 as Rick reviews the GSM setup and other Trade-Ideas at 9:10am Eastern.  For now, here are my own analysis and a potential trade plan made using our Trader Vision 20/20 software.

GSM has been in a long-term downtrend. However, a month ago the bulls stepped in to reverse matters. After a very strong run that took GSM into a RBB pattern, the stock has been in a profit-taking pullback the last couple weeks. It is important to note that it held the 50sma and a support level (about 7.95) on the pullback. Now the bulls have stepped back in and pushed off that support.

I will look for a b/o Entry with a Stop down at the tops of the most recent pullback highs. The targets come from long-term charts 5-8day charts) and I am planning this as a 2 target plan…but a 3-target plan is certainly possible if the overall market cooperates and GSM continues to work.

Trader Vision tells us we have 2 months until the next earnings report. It also tells us that we have 5 bullish versus only 1 bearish condition. We also expect this bearish condition since the stock has been in a successful pullback (which held support). So we can tell this is a nice chart setup.

TV20/20 then tells is that this trade plan offers us a decent Reward/Risk at the 1st Target price (2.12:1, with the ability to essentially make our Trade Goal at that point). However, if we can sell half at the 1st Target while holding the remainder until Target 2, we can get a 3.3:1 Reward Risk ($527.50 / $160). Overall, this would give us a 12.38% trade.

Having this knowledge before a trade is even entered makes it much easier to control emotions and maintain discipline.

Below is my markup of the chart and the trade plan as laid out by Trader Vision 20/20.  As a bonus, if you click the green button below, you’ll be able to watch a video of the chart markup and trade planning process.

The GSM Trade Setup – As of 9-20-18

GSM Chart Setup as of 9-20-18

The Trade Plan

GSM Trade Plan for 9-21-18

Note how Trader Vision 20/20 does so much of the work for you.  Knowing the ratio of Bullish Conditions to Bearish ones as well as the overall risk of the position size, risk to Stop out and the Reward possible at each Target price can help a great deal with controlling our emotions.  Knowing the dollar impact of every scenario ahead of time, allows us to make calm decisions during the trade.  It really takes the pressure off.  No guesswork.  No surprises.  No emotional roller coaster.

To see a short video of this trade’s chart markup and trade planning, click the button below.


Put the power to Trader Vision 20/20 to work for you…


Testimonial

Trader Vision immediately simplified the process…immediately it provided that information and guidance to me. I knew what I would risk for how much reward, I began taking trades off at the 1st target, 2nd target, I was no longer holding all my trades for the homerun. I also began implementing the stop losses if and when they were reached, not just hoping the stock would recover.  It then became easier to see what patterns were working for me and which were not.  It provided a much more relaxed and stress-free environment. –Joan G


***************************************************************************************************

Investing and Trading involve significant financial risk and are not suitable for everyone. Ed Carter is not a licensed financial adviser nor does he offer trade recommendations or investment advice to anyone. No communication from Hit and Run Candlesticks Inc. is to be considered financial or trading advice. All information is intended for Educational Purposes Only. Terms of Service.

***************************************************************************************************

MDXG Setup and Trade Plan

Today’s Featured Trade Idea is MDXG.

Members can join us in Trading Room #1 as Rick reviews the MDXG setup and other Trade-Ideas at 9:10am Eastern.  For now, here are my own analysis and a potential trade plan made using our Trader Vision 20/20 software.

MDXG has been in a large RBB pattern for a month. In the last 2 weeks, it has created a PBO (Pullback Opportunity) and the bulls have stepped back in off of Trendline and Fib support.

I will be looking for a positive trading Entry, using the J-hook b/o level as Target #1, the 23.6% Fib Ext. (which matches a longer-term chart S/R level) as target #2 and a longer-term chart S/R level as Target #3. The initial Stop will be quite tight below the $5.45 level MDXG broke through yesterday.

Trader Vision 20/20 shows us that we likely have over a month before earnings come around again. It also tells us we should be a little more cautious, because setup conditions are evenly split between bullish and bearish.

TV20/20 told us this plan would not offer a good enough Reward/Risk as originally planned. However, after deciding to accept a tighter Stop this Trade Plan will work. We can get a 2.13:1 Reward/Risk at the 1st Target, 4:1 at the 2nd Target and 7.09:1 overall if we reach the 3rd Target. We can also see that TV20/20 tells us the ticker must reach $6.02 in order to make our goal on the trade (which is a bit above the first target).

In short, TV20/20 is urging caution on this trade setup. That is a valuable warning we may well have missed without this software.

Having this knowledge before a trade is even entered makes it much easier to control emotions and maintain discipline.

Below is my markup of the chart and the trade plan as laid out by Trader Vision 20/20.  As a bonus, if you click the green button below, you’ll be able to watch a video of the chart markup and trade planning process.

The MDXG Trade Setup – As of 9-19-18

MDXG Chart Setup as of 9-19-18

The Trade Plan

MDXG Trade Plan for 9-20-18

Note how Trader Vision 20/20 does so much of the work for you.  Knowing the ratio of Bullish Conditions to Bearish ones as well as the overall risk of the position size, risk to Stop out and the Reward possible at each Target price can help a great deal with controlling our emotions.  Knowing the dollar impact of every scenario ahead of time, allows us to make calm decisions during the trade.  It really takes the pressure off.  No guesswork.  No surprises.  No emotional roller coaster.

To see a short video of this trade’s chart markup and trade planning, click the button below.


Put the power to Trader Vision 20/20 to work for you…


Testimonial

Trader Vision immediately simplified the process…immediately it provided that information and guidance to me. I knew what I would risk for how much reward, I began taking trades off at the 1st target, 2nd target, I was no longer holding all my trades for the homerun. I also began implementing the stop losses if and when they were reached, not just hoping the stock would recover.  It then became easier to see what patterns were working for me and which were not.  It provided a much more relaxed and stress-free environment. –Joan G


***************************************************************************************************

Investing and Trading involve significant financial risk and are not suitable for everyone. Ed Carter is not a licensed financial adviser nor does he offer trade recommendations or investment advice to anyone. No communication from Hit and Run Candlesticks Inc. is to be considered financial or trading advice. All information is intended for Educational Purposes Only. Terms of Service.

***************************************************************************************************

SYMC Setup and Trade Plan

Today’s Featured Trade Idea is SYMC.

Members can join us in Trading Room #1 as Rick reviews the SYMC setup and other Trade-Ideas at 9:10am Eastern.  For now, here are my own analysis and a potential trade plan made using our Trader Vision 20/20 software.

SYMC has been forming a Rounded Bottom for some time. On Tuesday it broke into an RBB pattern and is nearing a S/R level (seen on daily and weekly charts).

I will look for a b/o Entry with a Stop not far above the 50sma. The 2 Targets come from S/R levels seen on the Weekly chart and the 2nd will likely be near the 200sma when SYMC reaches that level.

Trader Vision tells us we have a month and a half until the next earnings. It also shows us that this chart setup offers 4 bullish conditions and 2 bearish conditions.

TV20/20 tells us that this plan will give us a 2.9:1 Reward/Risk at the 1st Target and a 4.6:1 Reward/Risk overall if we reach the 2nd target ($100/$460). It also shows us that the trade needs to reach just 30 cents above our 1st target in order to achieve our trade goal.

Having this knowledge before a trade is even entered makes it much easier to control emotions and maintain discipline.

Below is my markup of the chart and the trade plan as laid out by Trader Vision 20/20.  As a bonus, if you click the green button below, you’ll be able to watch a video of the chart markup and trade planning process.

The SYMC Trade Setup – As of 9-18-18

SYMC Chart Setup as of 9-18-18

The Trade Plan

SYMC Trade Plan for 9-19-18

Note how Trader Vision 20/20 does so much of the work for you.  Knowing the ratio of Bullish Conditions to Bearish ones as well as the overall risk of the position size, risk to Stop out and the Reward possible at each Target price can help a great deal with controlling our emotions.  Knowing the dollar impact of every scenario ahead of time, allows us to make calm decisions during the trade.  It really takes the pressure off.  No guesswork.  No surprises.  No emotional roller coaster.

To see a short video of this trade’s chart markup and trade planning, click the button below.


Put the power to Trader Vision 20/20 to work for you…


Testimonial

Trader Vision immediately simplified the process…immediately it provided that information and guidance to me. I knew what I would risk for how much reward, I began taking trades off at the 1st target, 2nd target, I was no longer holding all my trades for the homerun. I also began implementing the stop losses if and when they were reached, not just hoping the stock would recover.  It then became easier to see what patterns were working for me and which were not.  It provided a much more relaxed and stress-free environment. –Joan G


***************************************************************************************************

Investing and Trading involve significant financial risk and are not suitable for everyone. Ed Carter is not a licensed financial adviser nor does he offer trade recommendations or investment advice to anyone. No communication from Hit and Run Candlesticks Inc. is to be considered financial or trading advice. All information is intended for Educational Purposes Only. Terms of Service.

***************************************************************************************************

GOGO Setup and Trade Plan

Today’s Featured Trade Idea is GOGO.

Members can join us in Trading Room #1 as Rick reviews the GOGO setup and other Trade-Ideas at 9:10am Eastern.  For now, here are my own analysis and a potential trade plan made using our Trader Vision 20/20 software.

GOGO has been in a bullish trend for the last 1.5 months. In the last few days, it has been consolidating between 2 Support/Resistance levels. On a breakout, it will get into a large “waterfall” candle that will act like a gap. However sometime during the time it takes to fill that waterfall, it will run into potential resistance at the 200sma.

For planning/analysis purposes, for my Target price, I chose a level along the recent trend that should be near the 200sma when GOGO reaches that point. I will look for a b/o Entry and an initial Stop below the most recent Support.

Trader Vision shows us that earnings are out of the way and we have 2+ months until they come around again. It also lets us know this trade has 3 Bullish Conditions, but 2 Bearish Conditions, making it less of a “slam-dunk” setup. Specifically, there is no buy signal, the ticker has not reversed its downtrend yet and the short-term market trend is not Bullish. However, since we can address those issues to our satisfaction we can ahead with planning (especially since this is a small trade relative to the account size).

TV20/20 tells us this trade plan offers a great Reward/Risk (4.42:1) and that we can achieve our trade goal by the time we are halfway to the single target price. While this is great, it should also be a reason for some caution that we are being optimistic. There are likely to be some down days and/or consolidations along the way to filling that 30% run.

Having this knowledge before a trade is even entered makes it much easier to control emotions and maintain discipline.

Below is my markup of the chart and the trade plan as laid out by Trader Vision 20/20.  As a bonus, if you click the green button below, you’ll be able to watch a video of the chart markup and trade planning process.

The GOGO Trade Setup – As of 9-17-18

GOGO Chat Setup as of 9-17-18

The Trade Plan

GOGO Trade Plan for 9-18-18

Note how Trader Vision 20/20 does so much of the work for you.  Knowing the ratio of Bullish Conditions to Bearish ones as well as the overall risk of the position size, risk to Stop out and the Reward possible at each Target price can help a great deal with controlling our emotions.  Knowing the dollar impact of every scenario ahead of time, allows us to make calm decisions during the trade.  It really takes the pressure off.  No guesswork.  No surprises.  No emotional roller coaster.

To see a short video of this trade’s chart markup and trade planning, click the button below.


Put the power to Trader Vision 20/20 to work for you…


Testimonial

Trader Vision immediately simplified the process…immediately it provided that information and guidance to me. I knew what I would risk for how much reward, I began taking trades off at the 1st target, 2nd target, I was no longer holding all my trades for the homerun. I also began implementing the stop losses if and when they were reached, not just hoping the stock would recover.  It then became easier to see what patterns were working for me and which were not.  It provided a much more relaxed and stress-free environment. –Joan G


***************************************************************************************************

Investing and Trading involve significant financial risk and are not suitable for everyone. Ed Carter is not a licensed financial adviser nor does he offer trade recommendations or investment advice to anyone. No communication from Hit and Run Candlesticks Inc. is to be considered financial or trading advice. All information is intended for Educational Purposes Only. Terms of Service.

***************************************************************************************************

DISH Setup and Trade Plan

Today’s Featured Trade Idea is DISH.

Members can join us in Trading Room #1 as Rick reviews the DISH setup and other Trade-Ideas at 9:10am Eastern.  For now, here are my own analysis and a potential trade plan made using our Trader Vision 20/20 software.

DISH recently broke its long-term downtrend and after a run up off the bottom has been consolidating in a range for a month. The last few days it ran up and then on Friday started retesting the breakout level printing an indecisive Spinning Top. If it can break out, there is about 5% to be made before it runs into the next S/R level and the 200sma.  So, this trade really is only viable as a stock trade if it breaks on through that level and continues the rally up into the $42 area.  I will look for a b/o buy, with a tight Stop and the targets drawn off longer-term charts.

Trader Vision tells us earnings are out of the way. It also shows us that we have 5 Bullish Conditions and only 1 Bearish Condition (overall market short-term trend) in favor of this setup.

TV20/20 shows us that this trade plan offers low risk (at a reasonable position size), but also limited upside potential. We can achieve a 2:1 Reward/Risk at the 1st Target by using a tight Stop. However, if we can sell half at Target #1 and hold the remainder up through the 200sma to Target #2, we can get 3.64:1, achieve our Trade Goal and pocket a respectable 9.9% ($364.50) overall on the trade.  If this offered a decent options setup, this would be a more attractive trade.

Having this knowledge before a trade is even entered makes it much easier to control emotions and maintain discipline.

Below is my markup of the chart and the trade plan as laid out by Trader Vision 20/20.  As a bonus, if you click the green button below, you’ll be able to watch a video of the chart markup and trade planning process.

The DISH Trade Setup – As of 9-14-18

DISH Chart Setup as of 9-14-18

The Trade Plan

Note how Trader Vision 20/20 does so much of the work for you.  Knowing the ratio of Bullish Conditions to Bearish ones as well as the overall risk of the position size, risk to Stop out and the Reward possible at each Target price can help a great deal with controlling our emotions.  Knowing the dollar impact of every scenario ahead of time, allows us to make calm decisions during the trade.  It really takes the pressure off.  No guesswork.  No surprises.  No emotional roller coaster.

To see a short video of this trade’s chart markup and trade planning, click the button below.


Put the power to Trader Vision 20/20 to work for you…


Testimonial

Trader Vision immediately simplified the process…immediately it provided that information and guidance to me. I knew what I would risk for how much reward, I began taking trades off at the 1st target, 2nd target, I was no longer holding all my trades for the homerun. I also began implementing the stop losses if and when they were reached, not just hoping the stock would recover.  It then became easier to see what patterns were working for me and which were not.  It provided a much more relaxed and stress-free environment. –Joan G


***************************************************************************************************

Investing and Trading involve significant financial risk and are not suitable for everyone. Ed Carter is not a licensed financial adviser nor does he offer trade recommendations or investment advice to anyone. No communication from Hit and Run Candlesticks Inc. is to be considered financial or trading advice. All information is intended for Educational Purposes Only. Terms of Service.

***************************************************************************************************