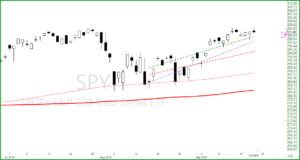
Crumbs from Relief Rallies

Crumbs from Relief Rallies

Crumbs from relief rallies are when the trend is down, and traders take advantage of short-term rallies into resistance or the bearish downtrend line. The SPY ended yesterday with a Doji, and when you place it next to the previous day, you have a Doji Continuation patt5ern. Of course for the pattern to work, we must have followed through. Price action above $274.60 would be a step in the right direction, ultimately price action over $280.60 would set the SPY up for a challenge of the October highs. Price action failing the $274.60 area could lead to a retest of about $268.45 or even lower. Please note the trend is still the seller’s friend and buyers are picking up crumbs from the relief rallies.

On Track This Year 362%

One of the most important tools Rick uses to achieve trading success in a Real-Time Live Scanner. To up your game and achieve higher profits consider the LTA – Live Trading Alert Scanner Traspaerancey and Trading Results.


DISCLAIMER: Investing / Trading involves significant financial risk and is not suitable for everyone. No communication from us should be considered as financial or trading advice. All information provided by Hit and Run Candlesticks Inc, its affiliates or representatives is intended for educational purposes only. You are advised to test any new approach before implementing it.  Past performance does not guarantee future results. Terms of Service


G20 Trump China Up Next

G20 Trump China Up Next

G20 Trump and China up next, if they can ease the tension like Powell did yesterday Santa could be back in town. Of course, it may be coal for us if the kids don’t play nice. Yesterday we saw a huge move in the market, DJ-30 up over 600 points! The SPY has seen nothing but three days of bullishness with yesterday being the big winner. Price has nearly come back to challenge the 200- and 50-SMA’s and the close yesterday was above the 50% line from the recent high to the recent low. We should expect a little rest and inside action today and possibly a challenge of the 200-SMA before the weekend. Looking forward to pulling a few profits off the next two days.

Live Trading Alert Hot List

CYH recently was a Rounded Botmm Breakout set up and now has broken out above the 200-SMA on good volume. The 20-day chart pattern is a near perfect J-Hook Continuation pattern. With yesterdays close above $4.00 CYH may be getting ready for the next level. Add CYH to LTA-Live Trading Alerts Real Time Market Scanner watchlist for a buying alert. CYH bullish above $3.90, stop below $3.79

Members, please log in to the member’s blog for more Trade-Ideas. Start here for membership or a trial

****VXX – Bring the VXX down, bring the fear down

Trading Services We Offer

  1. Hit and Run Candlesticks
  2. Right Way Options
  3. Top Gun Day Trading
  4. 30-Day Trial

362% On Track This Year

Rick uses three main trading tools and has dialed them in for max performance. Rick also freely shares his insights on what makes the tools the best and how to use them. Rick is also one of the only traders in the industry that shares his trading account. Traspaerancey and Trading Results.

  1. LTA – Live Trading Alerts Get your 30-Day Trail
  2. TC2000 Charting Get $25.00 Off
  3. TradeHawk Trading Platform

Free YouTube Education  •  Subscription PlansPrivate 2-Hour Coaching

YouTube Videos

Trading at the BeachHow to set up the T-Line Regression LinesMetaStock AutomatedTrading the T-Line TrapShorting the Blue Ice Pattern


DISCLAIMER: Investing / Trading involves significant financial risk and is not suitable for everyone. No communication from us should be considered as financial or trading advice. All information provided by Hit and Run Candlesticks Inc, its affiliates or representatives is intended for educational purposes only. You are advised to test any new approach before implementing it.  Past performance does not guarantee future results. Terms of Service


Wall of Worry Powell Trump China

Wall of Worry Powell Trump China 

The Powell, Trump, China wall of worry are a few of the troubles the market is dealing with. Powell to speak today and the upcoming Fed meeting Dec. 19 may shed positive light or lay a dark cloud over the market. The G20, Trump and China meeting might remove some of the walls of worry or add more. The technical fracture the market is also a problem and will take time to resolve.

Another positive day yesterday for the SPY, about $273.25 remains the number the bulls need to beat before they can advance. Above $265.45 keeps the bull from drowning but struggling.

BABA RBB Setup

We are already long BABA

BABA has been flirting the RBB set up with price closing over the 50-SMA the past 2-days. The bottom construction looks solid with an Inverted Head and Shoulder formation. The weekly chart found support on the Dotted Duece and has now closed back above the weekly T-Line. The typical RBB trade target direction is the 200-SMA. BABA has been added as a trade candidate to add to our LTA-Live Trading Alerts Real Time Market Scanner watchlist for a buying alert. BABA bullish above $156.502, stop below $147.65

Members, please log in to the member’s blog for more Trade-Ideas. Start here for membership or a trial

****VXX – Bring the VXX down, bring the fear down

Trading Services We Offer

  1. Hit and Run Candlesticks
  2. Right Way Options
  3. Top Gun Day Trading
  4. 30-Day Trial

321% This Year

Rick uses three main trading tools and has dialed them in for max performance. Rick also freely shares his insights on what makes the tools the best and how to use them. Rick is also one of the only traders in the industry that shares his trading account. Traspaerancey and Trading Results.

  1. LTA – Live Trading Alerts Get your 30-Day Trail
  2. TC2000 Charting Get $25.00 Off

Free YouTube Education  •  Subscription PlansPrivate 2-Hour Coaching

YouTube Videos

Trading at the BeachHow to set up the T-Line Regression LinesMetaStock AutomatedTrading the T-Line TrapShorting the Blue Ice Pattern


DISCLAIMER: Investing / Trading involves significant financial risk and is not suitable for everyone. No communication from us should be considered as financial or trading advice. All information provided by Hit and Run Candlesticks Inc, its affiliates or representatives is intended for educational purposes only. You are advised to test any new approach before implementing it.  Past performance does not guarantee future results. Terms of Service

SPY 2-Day Chart Printed Bullish Engulf

SPY 2-Day Chart Printed Bullish Engulf

The good news: The SPY 2-day chart has printed a double bottom Bullish Engulf all on the 200-SMA. So is this the start of a bullish turnaround? The answer is in whether or not we have bullish follow through over the first hurdle $273.25. The bad news is the SPY like the other indices are in a painful downtrend with a ton of resistance above. Trade considerations and rate hikes continue to add bearish weight to this market. Smaller and fewer positions and quicker profits seem to be the key in this market.

TAL RBB Setup

TAL is an (RBB) Rounded Bottom Breakout Setup and finding support on one of our lower band lines. In the last few weeks price has rallied up and rested with a Flag formation. The rule of thumb is that on a breakout price should move to the next resistance level. The typical RBB trade target direction is the 200-SMA. Adding TAL as a trade candidate to add to our LTA-Live Trading Alerts Real Time Market Scanner watchlist for a buying alert. TAL bullish above $29.15, stop below $27.75

****VXX – Yesterday the VXX chart shows that a little fear was leaving the party. Be careful this party can start up again at any time.

321% This Year

Rick uses three main trading tools and has dialed them in for max performance. Rick also freely shares his insights on what makes the tools the best and how to use them. Rick is also one of the only traders in the industry that shares his trading account. Traspaerancey and Trading Results.

Free YouTube Education  •  Subscription Plans Private 2-Hour Coaching

YouTube Videos

Trading at the BeachHow to set up the T-Line Regression LinesMetaStock AutomatedTrading the T-Line TrapShorting the Blue Ice Pattern


DISCLAIMER: Investing / Trading involves significant financial risk and is not suitable for everyone. No communication from us should be considered as financial or trading advice. All information provided by Hit and Run Candlesticks Inc, its affiliates or representatives is intended for educational purposes only. You are advised to test any new approach before implementing it.  Past performance does not guarantee future results. Terms of Service

SP-500 Set To Open Higher

SP-500 Set To Open Higher

The SP-500 is set to open higher this morning and the DJ-30 set with a triple-digit open, but the big question is this the start of a bullish turnaround? To be a bullish turnaround, we would need to see a bullish bottom constructed and price above $271.90 on the SPY. On the other hand, a good bullish bounce would make for a great relief rally. Last week was another hard week for stocks, and the negative candles on the indices proved it. FANG stock remains weak as can be seen on the FNGU chart, price below the T-Line and the T-Line below the 34-EMA.

BECN RBB Setup

BECN is an (RBB) Rounded Bottom Breakout Setup, not that price has closed above the 50-SMA, and there is at least 10% between the 50-SMA and 200-SMA. The Bullish Engulf a few days ago was a bottom test followed by bullish follow through. With a swing target near the $42.50 area, BECN is a trade candidate to add to our LTA-Live Trading Alerts Real Time Market Scanner watchlist for a buying alert. BECN bullish above $31.75, stop below $29.90

****VXX – At the close Friday the VXX chart was on the bullish side suggesting fear, below $36.00 would suggest fear is under control while over $36.00 would suggest fear is once again fueled.

Trading Services We Offer

  1. Hit and Run Candlesticks
  2. Right Way Options
  3. Top Gun Day Trading
  4. 30-Day Trial

321% This Year

Rick uses three main trading tools and has dialed them in for max performance. Rick also freely shares his insights on what makes the tools the best and how to use them. Rick is also one of the only traders in the industry that shares his trading account. Traspaerancey and Trading Results.

  1. LTA – Live Trading Alerts Get your 30-Day Trail
  2. TC2000 Charting Get $25.00 Off
  3. TradeHawk Trading Platform

Free YouTube Education  •  Subscription PlansPrivate 2-Hour Coaching

YouTube Videos

Trading at the BeachHow to set up the T-Line Regression LinesMetaStock AutomatedTrading the T-Line TrapShorting the Blue Ice Pattern


DISCLAIMER: Investing / Trading involves significant financial risk and is not suitable for everyone. No communication from us should be considered as financial or trading advice. All information provided by Hit and Run Candlesticks Inc, its affiliates or representatives is intended for educational purposes only. You are advised to test any new approach before implementing it.  Past performance does not guarantee future results. Terms of Service

Gap Spinning Top Doji

Gap Spinning Top Doji

Yesterday we saw the SPY gap down and closed with a Spinning Top Doji. I don’t subscribe to the idea of a Doji being a buy signal as many do, I do believe the Doji represents indecision, a time for rest, re-think direction. $270.60 is about 50% of the recent low and recent high making it an important horizontal line to have on a chart. Sellers are still in control and can be easily seen by adding a downtrend line to the tops of price action. It has been my experience more money can be made by trading with the trend, not against the trend and to have patience when you think the trend is turning.

Thanksgiving Week Trade Ideas

With this being a holiday week low market volume, Thursday market closed and Friday a half day I have decided to suspend any new trade ideas until Monday. We will post trade ideas as they appear on LTA-Live Trading Alerts Real Time Market Scanner in the trading room.

_______________________________________________________

Trading Services We Offer

  1. Hit and Run Candlesticks
  2. Right Way Options
  3. Top Gun Day Trading
  4. 30-Day Trial

321% This Year

The two most important pieces of software Rick uses is LTA – Live Trading Alerts Get your 30-Day Trial, and TC2000 Charting Receive $25.00 Off
Rick has dialed them in for max performance, and he freely shares his insights on what makes the tools the best and how to use them. Rick is also one of the only traders in the industry that shares his trading account. Traspaerancey and Trading Results.

Free YouTube Education  •  Subscription PlansPrivate 2-Hour Coaching

YouTube Videos

Trading at the BeachHow to set up the T-Line Regression LinesMetaStock AutomatedTrading the T-Line TrapShorting the Blue Ice Pattern


DISCLAIMER: Investing / Trading involves significant financial risk and is not suitable for everyone. No communication from us should be considered as financial or trading advice. All information provided by Hit and Run Candlesticks Inc, its affiliates or representatives is intended for educational purposes only. You are advised to test any new approach before implementing it.  Past performance does not guarantee future results. Terms of Service

November 15 Lows Hold For Now

November 15 Lows Hold For Now?

The SPY slide yesterday but held above the November 15 lows for now. I am not boosting that is fantastic or anything just simply an observation. The bulls are getting their butts kicked as they try to fight back. Until we have a winner, this will be a troubled market to trade. I have fewer positions on and less invested in lowering my risk exposure. The SPY weekly chart is hanging from the 50-SMA, and that is never good. If the bulls can’t find a way to get back above the 50-SMA price action will need to find friendly support and the $246.00 area could be the story.

The first step for the bulls is to find a reason to find support above $270.50, then $275.90 and lastly (for now) $281.15. Below $270.50 the sellers will work for $265.30 and $260.00

Thanksgiving Week Trade Ideas

With this being a holiday week low market volume, Thursday market closed and Friday a half day I have decided to suspend any new trade ideas until Monday. We will post trade ideas as they appear on LTA-Live Trading Alerts Real Time Market Scanner in the trading room.

_______________________________________________________

Trading Room Services

  1. Hit and Run Candlesticks
  2. Right Way Options
  3. Top Gun Day Trading
  4. 30-Day Trial

321% This Year

The two most important pieces of software Rick uses is LTA – Live Trading Alerts Get your 30-Day Trial, and TC2000 Charting Receive $25.00 Off
Rick has dialed them in for max performance, and he freely shares his insights on what makes the tools the best and how to use them. Rick is also one of the only traders in the industry that shares his trading account. Traspaerancey and Trading Results.

Free YouTube Education  •  Subscription Plans Private 2-Hour Coaching

YouTube Videos

Trading at the BeachHow to set up the T-Line Regression LinesMetaStock AutomatedTrading the T-Line TrapShorting the Blue Ice Pattern


DISCLAIMER: Investing / Trading involves significant financial risk and is not suitable for everyone. No communication from us should be considered as financial or trading advice. All information provided by Hit and Run Candlesticks Inc, its affiliates or representatives is intended for educational purposes only. You are advised to test any new approach before implementing it.  Past performance does not guarantee future results. Terms of Service

Happy Thanksgiving Week

Happy Thanksgiving Week

Happy Thanks Giving Week. This week will be a challenge for sure with Tuesday getting ready for Thanksgiving, Wednesday Thanksgiving Day, Thursday the day after Thanksgiving. Friday is Black Friday, and the market is open ½ day, then teres Cyber Monday. The volume in the markets will likely dry up to near dust. In the trading room today we will look at my dark chart with no candles or price action, moving averages only. You will see the trouble the bulls are fighting.  The 34-EMA is barely hovering over the 200-SMA, and the 50-SMA started to turn down in early October. Under $275.85 the bulls are sitting ducks and could be forced to test the November possible the October lows. 7:30 am SPY futures down 10.00 and DIA down 85.00


FEYE On The Watchlist

FEYE is on the watchlist because of the trend, and the possible follow through freon the current chart pattern. Bullish trend. Volume break on October 31, and now price is having around supporting about $17.90. Thursday and Friday showed buyer interest near the Volatility Stop. Over $18.80 probable test of $19.50. Over $19.50 probable teat of near the recent high, so on and so on.

Add FEYE to your LTA-Live Trading Alerts Real Time Market Scanner watchlist and be alerted for a bullish entry/trade. Members trade ideas will be on the member’s blog.

Trading Services We Offer

  1. Hit and Run Candlesticks
  2. Right Way Options
  3. Top Gun Day Trading
  4. 30-Day Trial

321% This Year

The two most important pieces of software Rick uses is LTA – Live Trading Alerts Get your 30-Day Trail and TC2000 Charting Recieve $25.00 Off
Rick has dialed them in for max performance, and he freely shares his insights on what makes the tools the best and how to use them. Rick is also one of the only traders in the industry that shares his trading account. Traspaerancey and Trading Results.

Free YouTube Education  •  Subscription PlansPrivate 2-Hour Coaching

YouTube Videos

Trading at the BeachHow to set up the T-Line Regression LinesMetaStock AutomatedTrading the T-Line TrapShorting the Blue Ice Pattern


DISCLAIMER: Investing / Trading involves significant financial risk and is not suitable for everyone. No communication from us should be considered as financial or trading advice. All information provided by Hit and Run Candlesticks Inc, its affiliates or representatives is intended for educational purposes only. You are advised to test any new approach before implementing it.  Past performance does not guarantee future results. Terms of Service


How BABA Acts Today

How BABA Acts Today

Depending on how BABA acts today we may or may not capture profits, at the close yesterday we were up 42%. With a few other nice trades, we are working with such as (SYMC-closed yesterday) and PZZA the “Road To Wealth” Account will be positive a staggering 380% for 2018. The new LTA-Live Trading Alerts Real Time Market Scanner is working out great alerting me on trades that need my attention. We are very very excited about the built-in alerts, and they will only get better from here. Here are 14 charts I am adding to my LTA-Live Trading Alerts Real Time Market Scanner PBI, LLY, MRK, EXTRA, LCI, LOGM, XENT, CASA, COLL, FND, AGEN, CDNA, VXX. Trade-Ideas and picks are worthless unless you know how to read a chart for profitable trading.

****VXX – Be careful the VXX chart is still in a bullish position which means the fear in this market is real.

Trading Services We Offer

  1. Hit and Run Candlesticks
  2. Right Way Options
  3. Top Gun Day Trading
  4. 30-Day Trial

321% This Year

Rick uses three main trading tools and has dialed them in for max performance. Rick also freely shares his insights on what makes the tools the best and how to use them. Rick is also one of the only traders in the industry that shares his trading account. Traspaerancey and Trading Results.

  1. LTA – Live Trading Alerts Get your 30-Day Trail
  2. TC2000 Charting Get $25.00 Off
  3. TradeHawk Trading Platform

Free YouTube Education  •  Subscription PlansPrivate 2-Hour Coaching

YouTube Videos

Trading at the BeachHow to set up the T-Line Regression LinesMetaStock AutomatedTrading the T-Line Trap Shorting the Blue Ice Pattern


DISCLAIMER: Investing / Trading involves significant financial risk and is not suitable for everyone. No communication from us should be considered as financial or trading advice. All information provided by Hit and Run Candlesticks Inc, its affiliates or representatives is intended for educational purposes only. You are advised to test any new approach before implementing it.  Past performance does not guarantee future results. Terms of Service