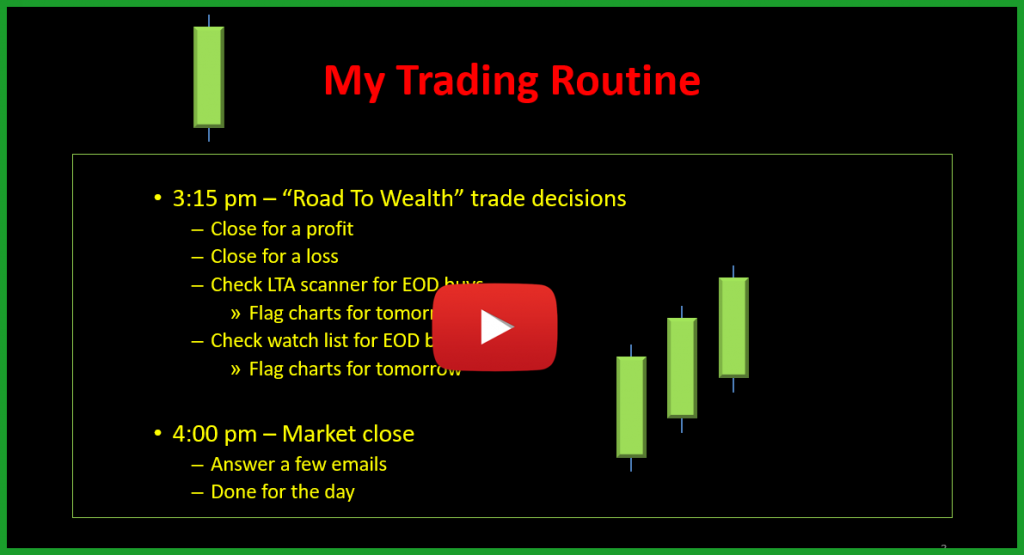
In this 1-hour overview, Rick Saddler founder of Hit and Run Candlesticks talks about his trading routine throughout the day. Hopefully, this will help answer questions for fellow traders.
Rick Saddler has been swing trading for the past 31 years and loves to share his experiences with candlestick signals and candlestick patterns. Trading with price action and chart patterns have been the key to 307% trading profits in 2018.
The charts in this video are for educational purposes only. No
communication from Hit and Run Candlestick Inc should be considered as
financial or trading advice. Past performance does not guarantee future
results.
Live Trading Alerts News
✅Live Trading Alerts – 100 plus alerts/scans to choose from
Two new auto scans have been added to the LTA-Live Trading Alerts Scanner; the Bull -Fig Newton patternand the Bear- Oreo Pattern. With over 100 built-in scans my favorite bullish scans are the Pop Out of The Box, The RBB, The 3×8 Trap, The Fig Newton. If you need set with the scanner set up or adding scans just let us know. Each day (Market hours) we provide Free Scanner coaching in our training room.
DISCLAIMER: Investing/ Trading involves significant financial risk and is not suitable for everyone. No communication from us should be considered as financial or trading advice. All information provided by it and Run Candlesticks Inc, its affiliates or representatives is intended for educational purposes only. You are advised to test any new approach before implementing it. Past performance does not guarantee future results. Terms of Service
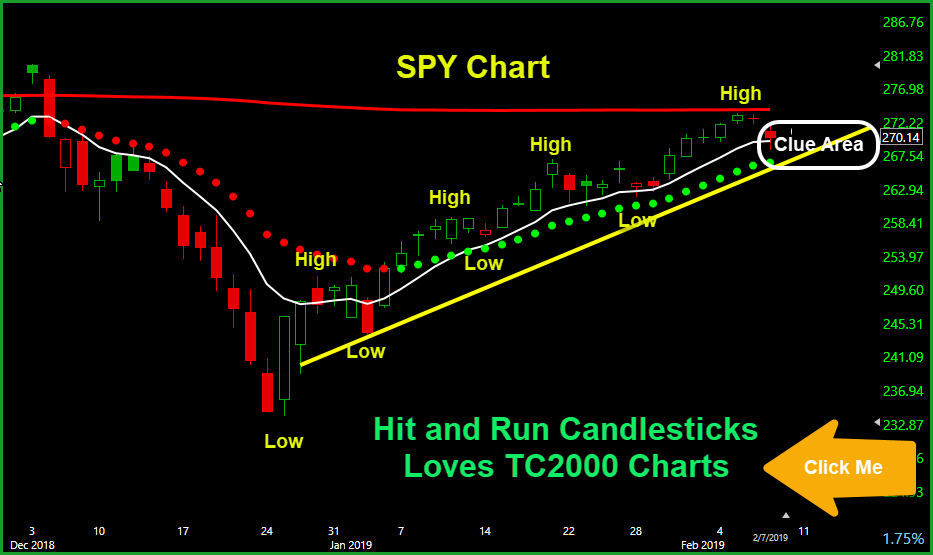
So the question is, do we buy, sell or hold? Let’s take a look at the chart, from the December lows the bulls have built a bullish trend, and the trend is still intact. Price action trend has been as of yesterdays close still is making new highs/higher lows. February 5, price action made a new high and is now pulling back toward the bullish trendline. The TC2000 T2122 chart was pegged and has now rolled over signaling a pullback.
Here is what we have done with this information, at the recent high we profited on a few winning long positions and have bought PUTS on the market. Yesterday we profited on a few of the PUTS, and now we are closely managing a few positions waiting for the SPY to give us a clue as it moves closer to the bullish uptrend line. We currently see this pullback as a bullish buying opportunity as long as price action stays above the trend. The key now is to identify the right price action buy/sell signal.
✅Live Trading Alerts – 100 plus alerts/scans to choose from
Two new auto scans have been added to the LTA-Live Trading Alerts Scanner; the Bull -Fig Newton patternand the Bear- Oreo Pattern. With over 100 built-in scans my favorite bullish scans are the Pop Out of The Box, The RBB, The 3×8 Trap, The Fig Newton. If you need set with the scanner set up or adding scans just let us know. Each day (Market hours) we provide Free Scanner coaching in our training room.
DISCLAIMER: Investing/ Trading involves significant financial risk and is not suitable for everyone. No communication from us should be considered as financial or trading advice. All information provided by it and Run Candlesticks Inc, its affiliates or representatives is intended for educational purposes only. You are advised to test any new approach before implementing it. Past performance does not guarantee future results. Terms of Service
Once again US/China trade uncertainty raises its ugly head providing the Bears the energy to
drive back the Bulls and test key support levels. As uncomfortable as it might have been the tenacious Bulls stepped up and effectively defended
price supports and the overall bullish market
trend. Currently the futures are
suggesting that Bulls will once need a strong defense
with an opening gap down of more than 100 points.
Overall this pullback was expected and normal healthy price action but the political uncertainty raises an additional challenge as traders face the weekend risk. Remember you don’t have to trade every day and the view from this sideline can be very comforting as we head into the weekend. After a great month of profits the last thing I want to do is try and predict the outcome of political uncertainty and give back hard-earned gains. As a result my plan for the day is to protect my capital and quietly slide into a restful weekend.
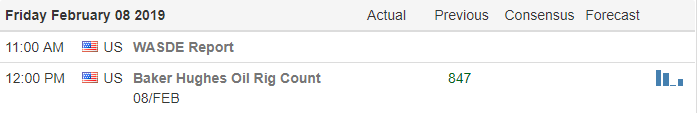
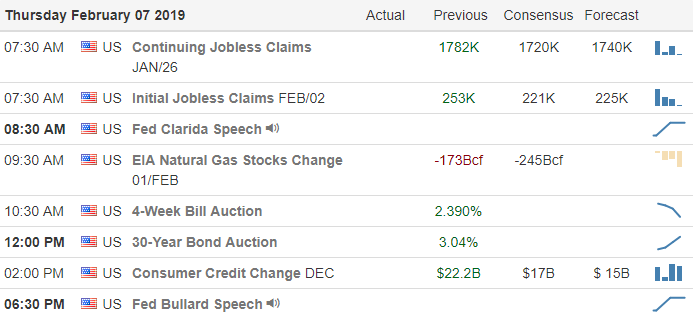
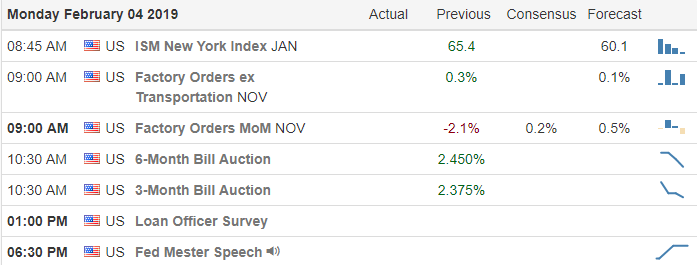
On the Calendar
On the Earnings Calendar we get a little break with only 52
companies reporting. Among the notable reports, ARNC, EXC, HAS, PSX & VTR.
Action Plan
Yesterday’s selloff became a bit
rough when the head of the US Economic Council reported that the US / China negotiations are still a long way from a
deal. The market then received a second blow when the Whitehouse moved the North
Korean meeting to March. Asian markets were lower across the board last night
while European markets mostly chop sideways nearly flat on the day. As I write this US Futures suggest a gap down
open testing yesterdays lows and key support levels.
On the bright side the key levels I mentioned in yesterdays
note held as support as the bulls effectively defended them with a nice late
day rally. With the looming political uncertainty
of US/China trade what will traders do as we head into the weekend? Without
question the bullish trend is currently still intact and this pullback is
nothing more than healthy price
action. However, it could easily become
serious if the bulls retreat ahead of the weekend. Let’s
hope the new cycle is quiet today, cooler heads prevail and bulls continue to
defend price support. Have a great
weekend everyone!
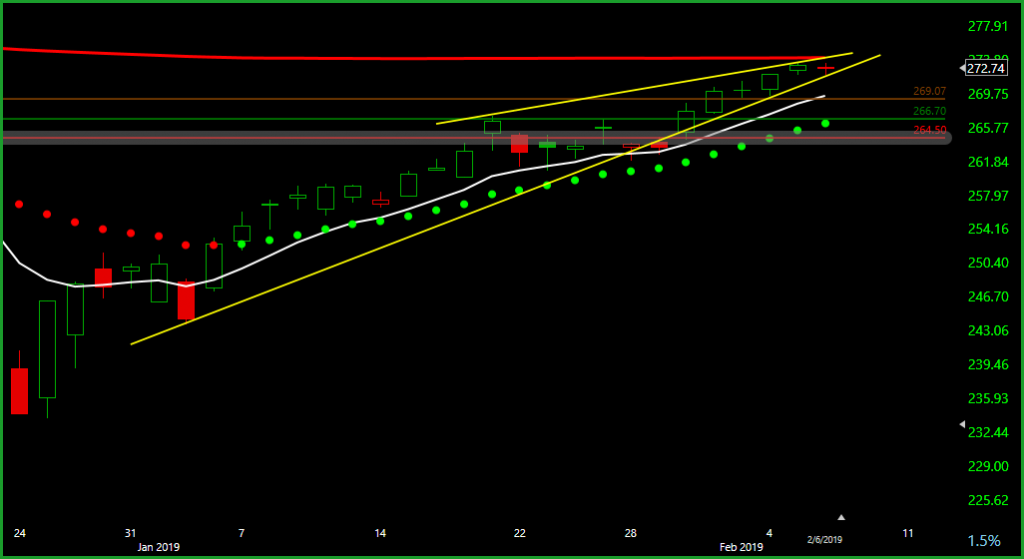
The bear is getting hangry; the bears are getting a little hangry since they only snacked six/seven days ago are have not had a big meal for about a month. The narrowing chart pattern is a clue that the current trend is getting tired and needs a rest. A few other clues are price action is pressed up against the 200-SMA, the T2122 4wk New High/Low Ratio is way overextended, and the FNUG daily chart closed with a Dark Cloud Cover yesterday. It looks like we are going to have an Evening Star open on the SPY and depending on the following price action/candle action the bulls might find support around $269.00, if not the $266.70 and $264.50 areas are open. Right now we will look at this bull back and bullish opportunity providing the bulls step in above $266.70. Cautiously bullish with a few short trades for balance.
Yesterday the Hit and Run Candlesticks “Road To Wealth” Account grabbed another ✅$300.00 profit on the X trade.
SPY Chart
2/7/2019 trade-ideas: we are adding the following to our watch list, (Long-OSTK, GRUB, ONB, MDLZ) (Short-CME, RAMP, AMZN, TTWO. Past performance does not guarantee future results
Live Trading Alerts News
✅Live Trading Alerts – 100 plus alerts/scans to choose from
Two new auto scans have been added to the LTA-Live Trading Alerts Scanner; the Bull -Fig Newton patternand the Bear- Oreo Pattern. With over 100 built-in scans my favorite bullish scans are the Pop Out of The Box, The RBB, The 3×8 Trap, The Fig Newton. If you need set with the scanner set up or adding scans just let us know. Each day (Market hours) we provide Free Scanner coaching in our training room.
DISCLAIMER: Investing/ Trading involves significant financial risk and is not suitable for everyone. No communication from us should be considered as financial or trading advice. All information provided by it and Run Candlesticks Inc, its affiliates or representatives is intended for educational purposes only. You are advised to test any new approach before implementing it. Past performance does not guarantee future results. Terms of Service
Futures this morning are
suggesting a lower open this morning, and although it’s down, it’s not bearish. In fact, I would say a market pullback or
consolidation is a sign of a healthy trend as long as the bulls defend support
levels. The Dow has rallied nearly 17% from
the market lows and a full month of bullish trading without a pullback. As resilient as the bulls have been, I doubt
they will give up easily and will likely fight to hold key price supports. In fact, this pullback could be very short
lived as long as earnings continue to roll out positively.
If the market simply consolidates
this can be a profitable time for stock pickers. If supports are defended a pullback can setup
new low-risk entries into existing trends?
So don’t fear a pullback embrace it because it’s the natural price
action of the market. It only becomes a
problem is support levels fail because that usually means significantly higher price
volatility. Keep an eye on support and
trend and remember Price is King.
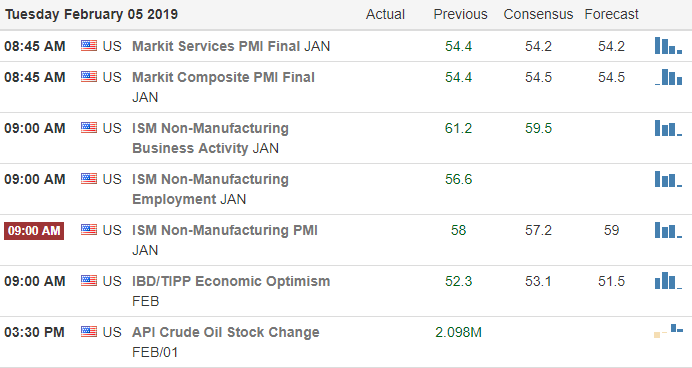
On the Calendar
On the Earnings Calendar,
we have a big dig day with 230 companies fessing up to earnings results. Some of the notable today are ANGI, MT, CAH, COLM, DNKN, EXPE, GRUB, K,
MAT, PENN, TWTR, TSN, WU, WWE & YUM.
Action Plan
Yesterday we saw a notable decline in bullish energy as the
market slid sideways in a very choppy price action day. This morning Futures are suggesting a
pullback with the Dow expected to gap
down more than 100 points. Although a
down day a pullback or merely a consolidation would be healthy for the overall market and does not at this time suggest bearishness. With more than 200 companies reporting today anything
is possible and futures could easily change their tune by the open.
Important support levels to watch
DIA 250, SPY 267, QQQ 166 & IWM 145.
If bulls can defend those supports levels or above the odds of the
bullish trend staying intact is very high. Breaking
those levels would add a bit of complication and likely see some fear and price
volatility return to the market. If the
market consolidates it can be a profitable
time for adept stock pickers as good patterns and trade setups will likely continue
to develop. As always stay focused on
price action trading the chart not your bias.
Twenty-two days in a row, that’s how many days price action has closed over the T-Line, price action has cut through every obstacle the bears have had. Now price is faced with the 200-SMA hurdle with right price action anything is possible. At the close yesterday, the SPY chart closed with a gap in the morning followed by a fairly tight trading day closing with Doji pinned just under the 200-SMA. The VIX pricked up a few buyers, not enough to panic but we should keep an eye on the price action. IYT and SMA have been in a solid T-Line run, and both are pinned just under the 200-SMA. We remain cautiously bullish above $269.19 on the SPY chart.
Yesterday the Hit and Run Candlesticks “Road To Wealth” Account grabbed another ✅$500.00 or 19%with the SQ trade. ✅The LTA Scanner gave a great alert on X; we are currently up 19%.
2/6/2019 trade-ideas: we are adding the following to our watch list, PCG, DISH, SBUX, WYNN, WY, CZR, UNP. Past performance does not guarantee future results
Live Trading Alerts News
✅Live Trading Alerts – 100 plus alerts/scans to choose from
Two new auto scans have been added to the LTA-Live Trading Alerts Scanner; the Bull -Fig Newton patternand the Bear- Oreo Pattern. With over 100 built-in scans my favorite bullish scans are the Pop Out of The Box, The RBB, The 3×8 Trap, The Fig Newton. If you need set with the scanner set up or adding scans just let us know. Each day (Market hours) we provide Free Scanner coaching in our training room.
DISCLAIMER: Investing/ Trading involves significant financial risk and is not suitable for everyone. No communication from us should be considered as financial or trading advice. All information provided by it and Run Candlesticks Inc, its affiliates or representatives is intended for educational purposes only. You are advised to test any new approach before implementing it. Past performance does not guarantee future results. Terms of Service
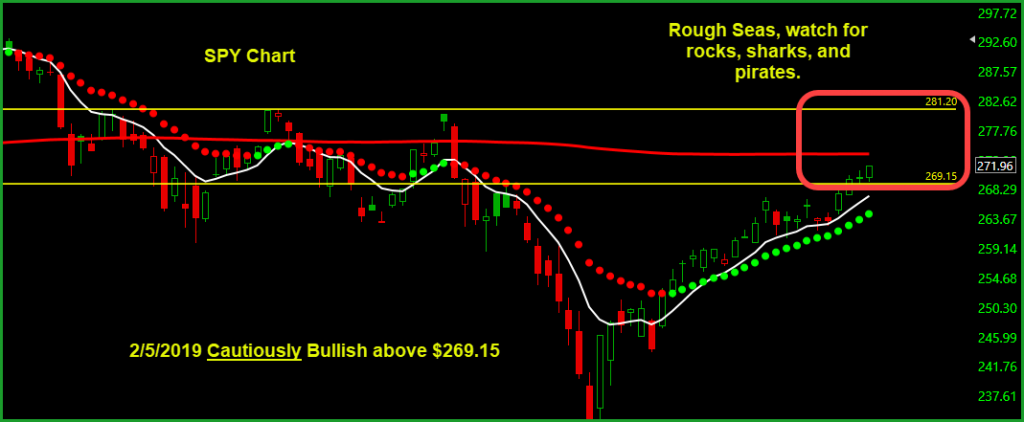
I love following a chart like the SPY that is trending and when price action gives us PBO’s (Pull Back Opportunities) followed by profitable swings. January 24th through January 30th was a perfect PBO opportunity with a swing to the Dotted Deuce and now possibly the 200-SMA on the SPY chart. When looking at the SPY, it is clear to see that the bulls have been in control climbing the wall of worry fending off the very obvious resistance starting on the January 15th candle. Unfourtiountly the bullishness can end in a split second, above $269.15 and up to $281.20 we feel will be like sailing through rough waters. Our navigation will be crucial getting past the rocks, sharks and pirates.
✅Live Trading Alerts – 100 plus alerts/scans to choose from
Yesterday the “Live Trading Alerts Scanner” alerted us on a few great setups; I was able to capture terrific entries on X and GS. Now we will manage them based our proven trading rules. Three of my favorite scans are the Pop Out of The Box, The RBB, and the 3×6 Trap. Yesterday we took profits on V, and WDC both alerted by the Live Trading Alerts Scanner. 👉😎Todays trade-ideas came from Live Trading Alerts at the closing bell yesterday: NBR, X, LMT, URI, BBBY, HOME, IBM. Not all charts are a buy today, knowing trade ideas still require trading education and savvy. Past performance does not guarantee future results.
DISCLAIMER: Investing/ Trading involves significant financial risk and is not suitable for everyone. No communication from us should be considered as financial or trading advice. All information provided by it and Run Candlesticks Inc, its affiliates or representatives is intended for educational purposes only. You are advised to test any new approach before implementing it. Past performance does not guarantee future results. Terms of Service
In an amazing show strength,
the Bulls refused to give an inch and ultimately defied gravity pushing upward
right into the close. In the shadow of
GOOG earnings that seemed to disappoint investors and ahead of State of the Union Address that may prove to be controversial
the futures market currently points to yet
another gap up open. Go Bulls!
As much as my current long positions are benefiting from the bullish activity adding new
risk so late in the rally should be carefully
considered. The fear of missing out is a
strong emotion that often causes traders to abandon their discipline and
blindly chase into positions without consideration to risk or price resistance. The market can certainly continue to rally from
here, but it’s very important to plan acceptable risk trades and avoid chasing.
On the Calendar
On the Earnings Calendar,
earnings reports ramp up today with 150 companies reporting. Among the notable reports: ALL, APC, ADM,
BDX, BP, CNC, DLR, EA, EL, LAZ, PBI, RL, SNAP, VIAB & DIS.
Action Plan
The Bulls refused to
lose continuing to defy gravity with Dow
closing up 175 points. During the
evening Futures were lower as earnings from GOOG, GLUU, GILD and STX disappointed
investors. Surprisingly futures shook off the disappointment around 2:00 AM and began
to rally strongly and have not looked back since. As I write this, ahead of many of the morning
earnings reports, futures are suggesting a gap up open of more than 75 points.
Tonight is the delayed State of the Union address in which
there is speculation that the President will declare a National Emergency to fund the border wall without
Congressional approval. Should that occur, it will most certainly set
off a firestorm of controversy that could affect the overall market. Pop some corn, put your feet and watch the
show! Though my long positions are likely
to benefit from this morning bullishness, I will not chase entries so late in
this rally. If you do decide to enter new
risk today make sure you wait for proof that buyers are in support of the
morning gap.
Traders normally think of options only as a method of speculation. However options were originally created to allow institution’s a method of managing risk.
Most of the time I approach the market with a directional assumption, but right now I feel much more comfortable sitting on the fence. After a run that produced the best January market
performance n 32 years, I simply feels right to be a little cautious. Having produced substantial profits in the
bull run, I went into the weekend holding only a few long positions and a
couple of conservative hedge trades to
reduce my long risk.
Let me be very clear that I am not at all bearish. There is nothing in the price action that
suggests bearishness, and as a matter of fact, earnings could easily
continue to inspire the bulls higher. I
do believe the bull run is a little stretched however
so it would be wise to be on the lookout for clues of a pullback or at a minimum
a consolidation. My current watchlist chalked
full of very good looking charts, but as of this morning I plan to take slow with
more of a wait and see approach before adding new risk.
On the Calendar
On the Earnings Calendar,
we have 80 companies reporting results today.
Notable earnings today: AVB, CLX, GILD, GOOGL, LM, LEG, ON, STX &
SYY.
Action Plan
A rather quiet market news weekend as the nation focused mostly on the Super Bowl and the resulting parties. Although we are about at the mid-point of earnings season, we have a very big week ahead of us with GOOGL reporting after the bell today. As I write this Futures are currently flat but keep in mind that CLX reports before the open among other potential market move reports, so anything is possible.
I went into the weekend light in my account wanting to
protect capital and thinking a rest or even a market
pullback could begin at any time. As of this morning,
I’m still comfortable with that decision. However,
I want to be clear that I’m not at all bearish just cautious after the best January
market performance in 32 years. Earnings could easily continue to inspire the bulls propelling price even higher, but I think just a single stumble could also trigger
some profit-taking. While I still have
several long positions, I also have also
added some positions to hedge to reduce my long risk. Although I’m choosing caution, there are a lot of very good looking charts on my watchlist
ready to become active trades depending upon overall price action.