On Sunday the Wall Street Journal triggered a buy the rumor rally
when they reported that the US and China are “in the final stage of completing a
trade deal.” The story offered nothing
as to an actual completion date of the agreement and had little to no details
about what’s included. Nonetheless, markets
around the world have reacted bullishly to the hope that some kind of agreement is forthcoming hopefully
sooner than later.
We have more than 500 companies reporting earnings this week
and busy economic calendar as we move toward the Friday Employment Situation report. The index trends are still up but we still have those pesky price resistance levels above
that continue to demand respect. As we
saw on Friday a gap into price resistance can prove dangerous and costly if you
chase into it with a fear of missing out.
Wait for proof in the price action after the gap that buyers are
stepping in supporting the gap to avoid those nasty pop and drop patterns.
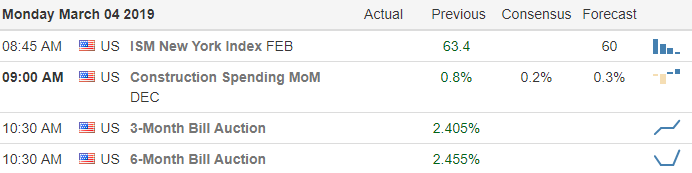
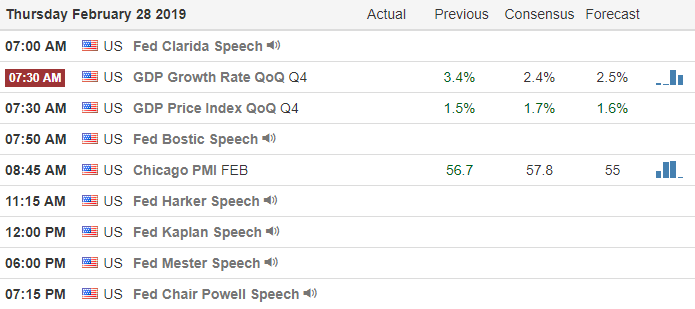
On the Calendar
On the Earnings Calendar we have 64 companies stepping up to report earnings results today.
Action Plan
Friday’s gap up open into resistance found sellers and through
our the morning gave back the entire gain
and at one point was looking pretty grim.
Fortunately the bulls went back to
work in the afternoon recovering about half of the initial morning gap. This morning futures are once again signaling
a gap up open with Asian and European markets
also bullish overnight. On Sunday the
Wall Street Journal reported that the US
and China are “in the final stage of completing a
trade deal.” It cited that Beijing was offering some lower tariffs on U.S. Products and markets responded bullishly
around the world.
Unfortunately the story said nothing about the timeline to completion and little to no detail
as to the contents in the agreement. A true to form buy the rumor market pop! Nonetheless, the trend is still up and thus
far key resistance levels are still holding and must be respected. We have another big week of earnings reports
and several significant economic reports culminating on Friday with the big
Employment Situation number on Friday morning.
As always, avoid chasing the morning
gap waiting instead for proof in the price action that buyers are going to set
in supporting the gap.
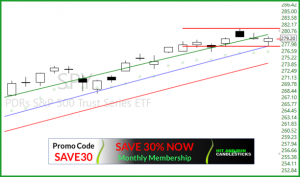
The chart in a yesterdays blog post I had drawn two red lines, one at Monday’s high (Resistance) and one at Wednesday’s low (Support). Yesterday printed a higher low Doji within our T-Line Bands that formed the early stage of a Bullish Continuation pattern. Bullish followthrough over Monday’s high $281.31 would suggest the Bulls may be ready to challenge the $286 area. Now for the Bearish scenario – Price closes below the $277.48 support line would suggest price may be headed back to the 200-SMA. The Live Trading Alerts Scanner can and does help
It’s the first of the month, and we will start new student training on the
(LTA) Live Trading Alerts. Live Trading Alerts is by far the best trading
software for signaling you when stocks ready to breakout or breakdown. With a steady
flow of market data, the LTA Scanner pinpoints chart patterns, candlesticks
signals, and patterns, trends. The (LTA) Live Trading Alerts Scanner the trader’s
edge.
Road To Wealth’s #1 Trading Tool. Year to-date total account profits of 215% could not have been achieved without the Live Trading Alerts Scanner
Searches for the setups
Creates scans for setups instead of a useless list
You can create your own Alert Strategies
Know when any of your positions are breaking down
Identify unusual volume flows
Find patterns and signals on Intraday and Daily time frames
Find the breakouts and breakdowns before the crowd
DISCLAIMER: Investing/ Trading involves significant financial risk and is not suitable for everyone. No communication from us should be considered as financial or trading advice. All information provided by it and Run Candlesticks Inc, its affiliates or representatives is intended for educational purposes only. You are advised to test any new approach before implementing it. Past performance does not guarantee future results. Terms of Service
Asian markets closed
higher overnight even after China manufacturing
numbers declined for the 3rd straight month. European markets are also higher across the board
this morning due to fresh US-China trade comments according to CNBC. Consequently,
US Futures are pointing to a substantial gap up this morning supposedly in reaction to yesterday’s GDP number
if you believe the news.
Currently the futures suggest a gap of more than 175 Dow points
this morning to test key resistance index levels. Those caught short could enhance the bullish move,
buying to cover in a so-called
short squeeze. We should also be on
guard for the possibility of a pop and
drop pattern at or near price resistance. Don’t chase with the fear of missing out,
take a breath and wait to see if buyers step in supporting the gap before
adding risk ahead of the weekend.
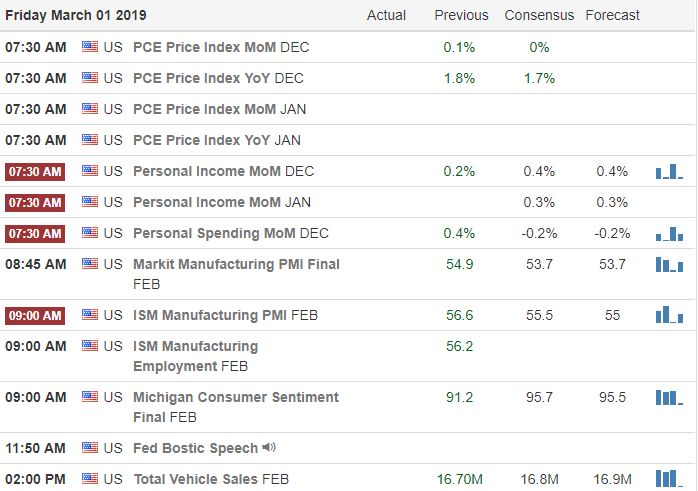
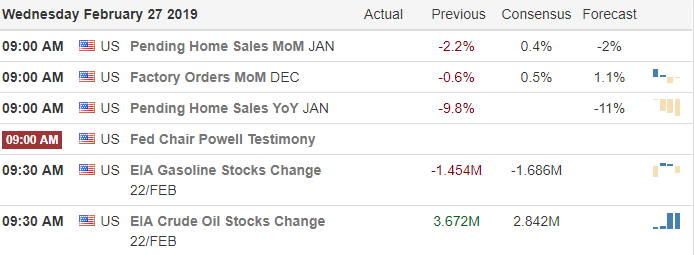
On the Calendar
We get a little break on the Earnings Calendar with just 50
companies reporting earnings today. Notable
reports today are XRAY, FL and SNH.
Action Plan
Futures are sharply higher this morning though I’m not sure
why other than the bulls just want to go
up. CNBC is suggesting it due to US/China
trade comments but the only story I can find on the subject suggests that Intellectual Property Theft remains a major sticking point. There is also a suggestion that the market is
responding to yesterday’s strong GDP news.
Odd, but okay. Nonetheless we are looking at a substantial gap up this morning
and those caught short may trigger a short squeeze this morning.
Although we have a lighter day on the earnings calendar we
have several potential market-moving
economic reports this reports morning. Remember
to not chase a morning gap especially right
into price resistance. Wait to see if
buyers step in supporting the gap because we don’t want to get caught in a classic pop and drop at price resistance. If
resistance does break an attack of record market
highs may be in the cards. Have a fantastic weekend everyone!
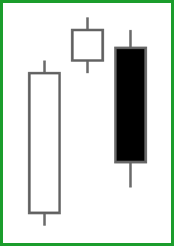
The SPY’s Evening Star is still present as well as the QQQ’s, DIA’s and IWM. The SPY’s low yesterday was $277.48 or the Lower T-Line Band, yesterday’s low was also the 3rd lower low in a row and the 3rd lower high. The three lower lows and lower highs is a sign the sellers have more control than the buyers. However as of yesterday, not enough control to push price below the T-Line Band bullish area. $281.00 remains strong resistance but not impossible to break out. The bulls have truly been amazing. If this week’s price can hold it’s low above $276.35, it will mark the 10th week in a row of higher lows. We are still cautiously bullish, bullish because of the trend and cautious because of the $301.00 resistance.
The Month of February is coming to an end, and I would like to thank all the members for there post and comments. It is so great to read your post when you enter and exit a trade and your wins and losses, thank you. The Road To Wealth account will end the month of February with about a 15% increase or about $3,400.00.
Hit and Run Candlesticks News
Yesterday we closed another 20% from out IWM PUTS which brings the “Road to Wealth” account to over 425% increase in 14 months. Possible trade ideas- MRO, IMMU, APA, CLR, OSTK, CHK, NBR. I have opened up two more spots for the “March Road To Wealth Coaching.” Mentoring program. Read More…
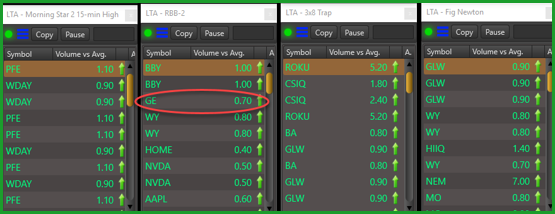
Live Trading Alerts News
✅Live Trading Alerts – 100 plus alerts/scans to choose from
Two new auto scans have been added to the LTA-Live Trading Alerts Scanner; the Bull -Fig Newton patternand the Bear- Oreo Pattern. With over 100 built-in scans my favorite bullish scans are the Pop Out of The Box, The RBB, The 3×8 Trap, The Fig Newton. If you need set with the scanner set up or adding scans just let us know. Each day (Market hours) we provide Free Scanner coaching in our trading room #4. Warning the LTA- Live Trading Alert software is a game changer, alerts for candlesticks, candlesticks patterns, western patterns, price action, tends, bullish and bearish.
DISCLAIMER: Investing/ Trading involves significant financial risk and is not suitable for everyone. No communication from us should be considered as financial or trading advice. All information provided by it and Run Candlesticks Inc, its affiliates or representatives is intended for educational purposes only. You are advised to test any new approach before implementing it. Past performance does not guarantee future results. Terms of Service
The North Korean summit abruptly ends with no deal and with the public Cohen political drama now behind closed doors the US Futures are suggesting only a modestly lower open. However, with more than 280 companies reporting and a busy economic calendar a lot could still change as we move toward this mornings bell.
Even though the bulls have given up a little ground the last couple days they still are in control of the uptrend and fought back yesterday cutting the initial losses in half by the close. The bears on the other hand continue to defend key resistance levels putting market between a rock and hard place and we will have to watch price closely for clues. Perhaps we slip into a healthy consolidation resting after such an extraordinary market run. If that’s the case, there will be some good trading for stock pickers as companies with price momentum can continue to elevate with relatively low volatility. That of course will change dramatically if the bears began to gain the upper hand. Stay focused and flexible.
On the Calendar
We have a big day on the Earnings Calendar with more than
280 companies stepping up to report. Among
the notable earnings today are, DDD, ABB, ALRM, AMC, AMCX, BUD, ADSK, CARS,
CROX, ECA, GPS, EP, JCP, JD, KDP, LTC, MAIN, MAR, JWM, NRG, PRTY, SEAS, SPLK,
TC, VMW and WDAY.
Action Plan
After some initial selling the market became very choppy and
lethargic as the Cohen political drama which may be better described as a soap opera
played out at the US Capital. As near as
I could tell skimming through the highlights the only thing accomplished was
political grandstanding. The markets are
reacting lower this morning as due to the US/North Korean summit ends abruptly
with no deal. We also have India and Pakistan
exchanging air strikes as tensions between the two countries escalate.
Technically, the indexes continue to battle index resistance
levels and though the bulls gave up a little ground in the last couple trading
days they continue to fight hard to hold the current up trend. Asian markets closed lower and European are also
currently lower across the board this morning.
US Futures are pointing to a modestly lower open but with a big day of
earnings and economic reports anything is possible.
The close
yesterday produced an Evening Star closing on the upper T-Line channel band. More
selling and a close below yesterdays low $278.90
today or tomorrow could put price action
on the blue Lower T-Line channel band or about $276.90. If a Red Volatility
Stop Dot is created, the pressure on the
bulls might make them run for safety
about $273.50. A test of the 200 SMA is possible if the buyers don’t put a game
together. The T-2122 chart 4Wk New High/Low Ratio saw weakness yesterday below the 80 line,
and today we are likely to test the
recent low. From the December low to yesterdays high the 23.6 Fib retracement would be $269.80, a nice
healthy pullback, the 38.2 line would be at $262.95.
Hit and Run Candlesticks News
Yesterday we closed VXXB for 26% which brings the Road to Wealth account to a 425% increase in 14 months. I have opened up two more spots for the “March Road To Wealth Coaching.” Possible trade ideas- DPZ, ATGE, EA, UNP, PYPL, HAE, EBS, MTAP, SGMS. We will also be moderating the LTA Scanner.
Live Trading Alerts News
✅Live Trading Alerts – 100 plus alerts/scans to choose from
Two new auto scans have been added to the LTA-Live Trading Alerts Scanner; the Bull -Fig Newton patternand the Bear- Oreo Pattern. With over 100 built-in scans my favorite bullish scans are the Pop Out of The Box, The RBB, The 3×8 Trap, The Fig Newton. If you need set with the scanner set up or adding scans just let us know. Each day (Market hours) we provide Free Scanner coaching in our trading room #4. Warning the LTA- Live Trading Alert software is a game changer, alerts for candlesticks, candlesticks patterns, western patterns, price action, tends, bullish and bearish.
DISCLAIMER: Investing/ Trading involves significant financial risk and is not suitable for everyone. No communication from us should be considered as financial or trading advice. All information provided by it and Run Candlesticks Inc, its affiliates or representatives is intended for educational purposes only. You are advised to test any new approach before implementing it. Past performance does not guarantee future results. Terms of Service
Futures are pointing to a modestly
lower open this morning as the market faces a day of historical events. First are
the decisions of nuclear disbarment of
North Korean a feat no sitting president has been able to accomplish.
Secondly a congressional hearing where the president’s former attorney is
expected to testify that is boss broke the law while
holding the highest office in the nation.
Add to that a big day of earnings reports and full economic calendar and
I think it’s safe to say the market has a lot a lot on its plate to digest.
The bulls have proven to be
very resilient and the trend is up so expect them to fight hard to defend against
any bear attack. However, we also have
to respect the price resistance in the index charts and plan for the
possibility that the political drama could impact the market with higher volatility. Saying that anything is possible would not be
an understatement and you never know exactly how the market could react with so
much to chew on today.
On the Calendar
On the Earnings Calendar we have a big day with more than
210 companies reporting quarterly results.
Some of the notable earnings are, AMT,
APA, BBY, BKNG, BOX, CPB, CHK, DF, FIT, TWNK,
HPQ, LB, LOW, ODP, PK, PBR, SQ, TDOC, TJX and WING.
Action Plan
As the US and North Korean
try to make nice while discussing nuclear disarmament abroad the president himself
will be under attack in a congressional hearing right here at home. Putting the president’s
challenges aside we should plan for the possibility of serious market impacts. As I write this morning note the futures are
pointing to only a modest decline at the open.
With a big day of earnings reports, important economic reports and a distracting
political drama anything is possible.
In our 11th week of rally and testing index price
resistance it would not be out of the question to see some profit-taking begin
or some price consolidation to reinforce a new level of support. However, the bulls have proven to be remarkably tenacious and with the market trend strongly
in their favor I would expect them to fight hard for higher prices. Avoid predicting, stay focused on price, remain
flexible, stay disciplined to your trading rules and prepare for a very interesting
day.
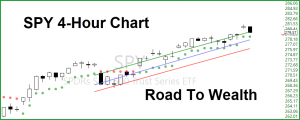
I often watch
the 4-hour chart, and yesterday the SPY
4-hour chart ended the day with an Evening
Star closing below the upper T-Line channel Band. The SPY looks to be opening lower
today causing a high probability of price testing the Lower T-Line channel Band.
A close below $278.50 will likely produce a Red V-Stop, first one in the past
18 days. Note we have not seen a Red V-stop on the daily in the past 41 days,
that’s a lot of bullishness with no real rest. Yesterday’s 4-hour Evening Star was produced at the $280.00 resistance line with
the 4wk New High/Low Ratio above 80. The VXXB chart closed with a solid piercing
candle on the daily chart and a Morning Star signal on the 4-hour chart. Final
comments: trend light in this market if
the SPY fails the T-Line the $200SMA or $274.50 and $271.20 could be in the
cards.
Hit and Run Candlesticks News
Yesterday we closed JNJ for 17% and GE for 80%. We also took on a few new trades CRON, SPY, and VXXB
Trade ideas for the watch list – (Long AG, ECA, AAOI, EXAS, EBIX, VXXB) (Short STZ, GILD)
Live Trading Alerts News
✅Live Trading Alerts – 100 plus alerts/scans to choose from
Two new auto scans have been added to the LTA-Live Trading Alerts Scanner; the Bull -Fig Newton patternand the Bear- Oreo Pattern. With over 100 built-in scans my favorite bullish scans are the Pop Out of The Box, The RBB, The 3×8 Trap, The Fig Newton. If you need set with the scanner set up or adding scans just let us know. Each day (Market hours) we provide Free Scanner coaching in our trading room #4. Warning the LTA- Live Trading Alert software is a game changer, alerts for candlesticks, candlesticks patterns, western patterns, price action, tends, bullish and bearish.
DISCLAIMER: Investing/ Trading involves significant financial risk and is not suitable for everyone. No communication from us should be considered as financial or trading advice. All information provided by it and Run Candlesticks Inc, its affiliates or representatives is intended for educational purposes only. You are advised to test any new approach before implementing it. Past performance does not guarantee future results. Terms of Service
According to new reports the futures are down this morning because
investors are seeking clarity on the US / China trade deal. How can there be clarity when have been no
details and no deal has yet not yet finished?
Would it not be more likely that
the market is merely needing a rest after
the Dow has rallied nearly 4500 points in just over ten weeks? After an extraordinary run a rest or pullback is normal
and healthy price action to confirm or build price support.
The trend is still up and but there are warnings signs that
this run is a bit overextended. However,
at this time there are no clues of failure and the bulls have proven to be remarkably resilient
fending off bear attacks quite easily of late.
I would not expect them to give up easily now but stay focused on price action
clues waiting to see if the sellers show up in support or the morning gap down
or if buyers step in rejecting the low.
On the Calendar
On the Earnings Calendar we have over 200 companies reporting today. Among the most notable are, HD, M, BGS, BMO,
BNS, LNG, CSGP, CBRL, DISCA, ELF, EV, FTR, GWPH, HTZ, SJM, TREE, MELI, MYL,
PANW, PZZA, PSA, SDRL, SSTK, TIVO, VSI, and WTW.
Action Plan
If we are to believe the news
CNBC is citing that the futures are lower because investors want clarity on the US / China deal! Hmm, all along there has little to know
details and the fact is there has been no official deal as of now. Seems more likely
is down because simply because it needs a rest after Dow rally of nearly 4500 points! Nonetheless, Asian and European markets are lower this morning and it doesn’t
help the situation with HD missed on earnings early this morning.
The President is on his way to Vietnam to meet with Kim Jong-un
to discuss nuclear disarmament. Don’t be surprised if news reports from the
meeting create a little market volatility.
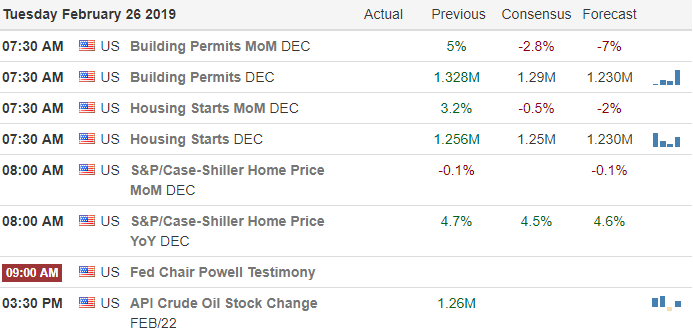
Keep an
eye on the Housing numbers this morning at 8:30 AM Eastern. Let’s hope
they show a better result than the
existing home sales numbers last week or the open today could be a little
rough. The trend is still up but there
are several danger signs so stay focused on price. There may be nothing at all to worry about but
let’s have the bull prove that before taking
additional long risk.
In this 90-min. video Rick talks about two of his favorite chart patterns to fish with, the T-Line Bounce and the Rounded Bottom Breakout. Also in thes video, Rick talks about the Live Trading Alert Scanner, and how he thinks it’s the best hook to have on your fishing vest.
The charts in this video are for educational purposes only. No communication from Hit and Run Candlestick Inc should be considered as financial or trading advice. Past performance does not guarantee future results.
DISCLAIMER: Investing/ Trading involves significant financial risk and is not suitable for everyone. No communication from us should be considered as financial or trading advice. All information provided by it and Run Candlesticks Inc, its affiliates or representatives is intended for educational purposes only. You are advised to test any new approach before implementing it. Past performance does not guarantee future results. Terms of Service