Special 50% discount – Availability Limited to 10 traders
Futures are up this morning as this blog is being written. Looking at the SPY (weekly chart) it is clear to see price on a support and the 23.6 Fib line. (Not too surprised of a bounce and a test of the 50-SMA) The daily chart has the 200-SMA 2.3% below yesterdays close, and the daily Blue Ica failure is still in the game. Bullish price action would have to close above $289.20 for the buyers to be in control. In my humble opinion, anything less than $289.20 would keep the current downtrend intact. The T2122 chart is now in an oversold area; buyers are starting to peck around, but will they be able to give us a solid close in the next day or so over $289.20? Remember base hits and protective stops. Set a plan 2:1 minimum and when long buy near support and when shorting buy near resistance. The market of late has been challenging for even the best of traders, ask them what their tricks are to survive.
Trade Ideas
We are adding the following trade ideas to our watch-list. Be sure to check earnings dates. COST, SYF, PEP, BX, AXP, LMT, MA, MET. Trend, Protective Stops, Base hits.
We use 2 of The Worlds Best Trading Tools, TC2000 for charting, LTA-Live Trading Alerts for real-time price action, candle and candle patterns, and western patterns. The right tools for the right job.👍
DISCLAIMER: Investing / Trading involves significant financial risk and is not suitable for everyone. No communication from Hit and Run Candlesticks Inc, its affiliates or representatives is not financial or trading advice. All information provided by Hit and Run Candlesticks Inc, its affiliates and representatives are intended for educational purposes only. You are advised to test any new trading approach before implementing it. Past performance does not guarantee future results. Terms of Service
Stalled US/China trade negotiations continue to ripple around
the world as the nervous tensions grow amidst the uncertainty of it all. After the blacklisting of Huawei’s devices,
Google has suspended business activity with the Chinese device maker essentially
blocking it from global growth and inflaming already difficult negotiations
between the countries.
Tensions are also on the rise with Iran with the president’s
warning of the end of Iran if they raise arms against the US. As John Wayne would say, they’s fightin’ words! Hopefully cooler heads will prevail but once
again the uncertainty is not something the market likes so keep an eye on the
VIX if fear begins to grow. A failure at
the 50-day average in the index chart creates significant technical and psychological
damage that can take weeks if not months to repair. Choose your risk carefully.
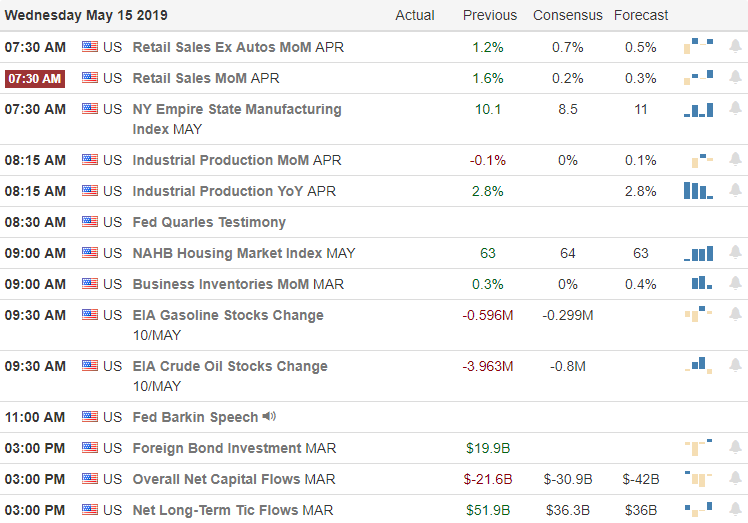
On the Calendar
On the Earnings calendar we have 80 companies expected to
fess up to results. Notable earnings
include IGT, TTM & TI.
Action Plan
Futures that initially pushed higher by nearly 120 points in
early trading reversed overnight as trade war tensions continue and saber
rattling with Iran grew over the weekend.
Potentially damaging technical price patterns let behind on Friday’
index charts could bring out the bear this morning unless there is something
that can inspire the bulls in the lead up to today’s open.
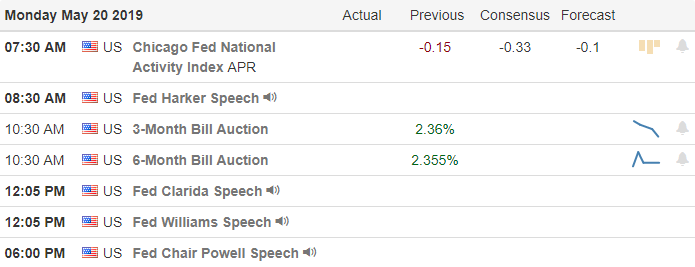
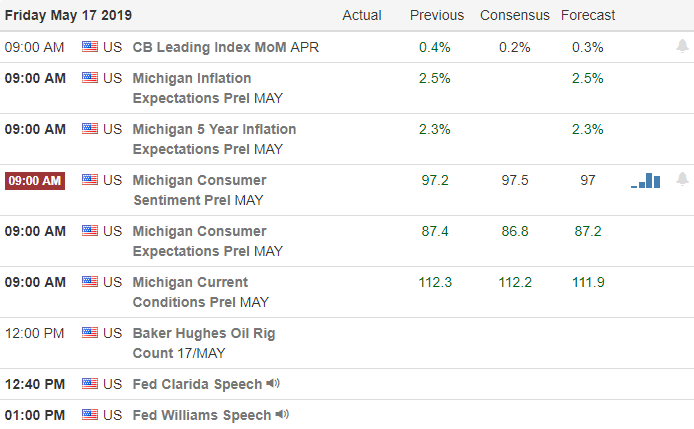
Unfortunately there is nothing on the economic calendar to inspire
and although there are some notable earnings reports today they are unlikely to
market moving events. That means the
market will likely be very sensitive to news reports and tweets today opening
the door to volatile price action. Remember
is unwise to chaise a gap so let’s wait and see if sellers come in to support
the gap before making any new trade decisions.
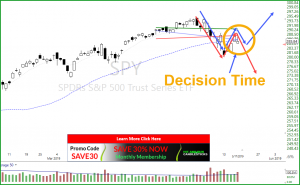
It looks has been performing a balancing act around the 50-SMA for the past nine days, all below its recent high. A close above $290.50 could set the bulls free to challenge the $294.95 high. Weakness and a failure to claim the 50-SMA for the Bulls could lead into chart patterns such as a “Blue Ice Failure” and a “Bearish H Pattern.” Both of these patterns are on the edge of success and could push price closer to the 200-SMA or about. The T2122 chart (3wk New High/Low Ratio has not turned up from the recent down move. When looking at the VXX on the daily chart, it looks like like it has been through a meat grinder, but the chart pattern is still holding a bullish form. To say this market has been easy to trade the last couple of weeks would be a flat out lie. It’s important to know when duck into a cove, tie up and wait out the storm.
Trade Ideas
We are adding the following trade ideas to our watch-list. PEP, GIS, CMCSA, PLUG, MDB, CELG, ATHM, SQQQ, TZA, SOXS, XRX, VXX, SPXS. We follow the trend, buy near support, profit into strength for solid base hits.
We use 2 of The Worlds Best Trading Tools, TC2000 for charting, LTA-Live Trading Alerts for real-time price action, candle and candle patterns, and western patterns. The right tools for the right job.👍
DISCLAIMER: Investing / Trading involves significant financial risk and is not suitable for everyone. No communication from Hit and Run Candlesticks Inc, its affiliates or representatives is not financial or trading advice. All information provided by Hit and Run Candlesticks Inc, its affiliates and representatives are intended for educational purposes only. You are advised to test any new trading approach before implementing it. Past performance does not guarantee future results. Terms of Service
Finding a trending chart and waiting for the next entry is the easiest way to make consistent profits in the market. In this live E-learning class we focused in on a few simple indicators that work very when determining the trend of stock
Earlier this week price had closed below the 50-SMA and yesterday (Thursday) the Bulls found a path to close over the 50-SMA. This by no means suggests the bulls are back. A test of the or near the 50-SMA is required and bullish follow-through from there. Below $279.95 the seller will throw a party, and above %289.23 the buyers will dance in the streets. IWM is having a little trouble at the 50-SMA, a bear flag and a Blue Ice Failure at the moment, for this reason, we shorted IWM yesterday looking for a few hundred $$$ in profits. The VXX chart is another reason we took advantage of IWM. On the 15- minute chart the VXX was forming a bottom (“W”) looking like it want to attack its 50-SMA. Pre-market this plan is working, we will see if the open is the same. Yesterday we closed out PEP and PG for nice double-digit profits, could have not done it without our trading tools.
Trade Ideas
Sorry, we do not post trade ideas on Fridays. Friday is the day we clean up our positions. And enjoy being a Trader of the market. We follow the trend, buy near support, profit into strength for solid base hits.
We use 2 of The Worlds Best Trading Tools, TC2000 for charting, LTA-Live Trading Alerts for real-time price action, candle and candle patterns, and western patterns.
👍 A good tool improves the way you work. A great tool 👉 improves the way you think. – Jejj Duntemann
DISCLAIMER: Investing / Trading involves significant financial risk and is not suitable for everyone. No communication from Hit and Run Candlesticks Inc, its affiliates or representatives is not financial or trading advice. All information provided by Hit and Run Candlesticks Inc, its affiliates and representatives are intended for educational purposes only. You are advised to test any new trading approach before implementing it. Past performance does not guarantee future results. Terms of Service
Having reaped the benefits of a nice relief rally traders
will have to consider the weekend risk of the trade war news and the rising tensions
with Iran. Futures are currently
pointing to a bearish open with the Dow currently expected to open about 100 points
lower.
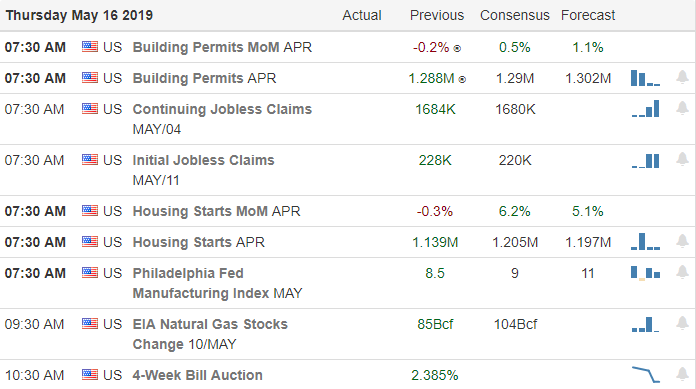
With a light day on both the earnings and economic calendars
traders will have plenty of ponder the technical damage in index charts as this
volatile week comes to the close. Yesterday
afternoon I began to lighten up by taking profits to reduce risk and hedging
positions that I plan to hold. Consider carefully
how best to protect your capital in light of the tensions, possible volatility that
can emerge over the weekend.
On the Calendar
As usual we get a little break on the Earnings Calendar Friday
with only 13 companies today. Notable earnings
include DE & RDY.
Action Plan
After a big rally to test key resistance levels futures are
pointing to some profit-taking at the open this morning. With a light day on the earnings calendar and
the economic calendar the market will have to ponder the technical damage in
the charts as we move toward the weekend.
Tensions with Iran have grown to such an extent that the Whitehouse has
deemed it time to inform Congress.
Hopefully cooler heads prevail but traders should consider the
weekend risk if a military confrontation were to occur let alone the slings and
arrows tossed back and forth in the trade war.
Currently futures point to more than a 100-point gap down. If that holds the open watch closely to see
if sellers support the gap before considering short positions. However, if the sellers do being to pile on
reducing risk into the weekend fear could quickly grow and selling could
quickly accelerate.
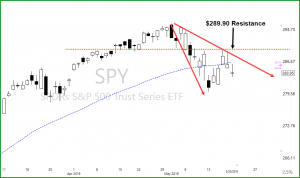
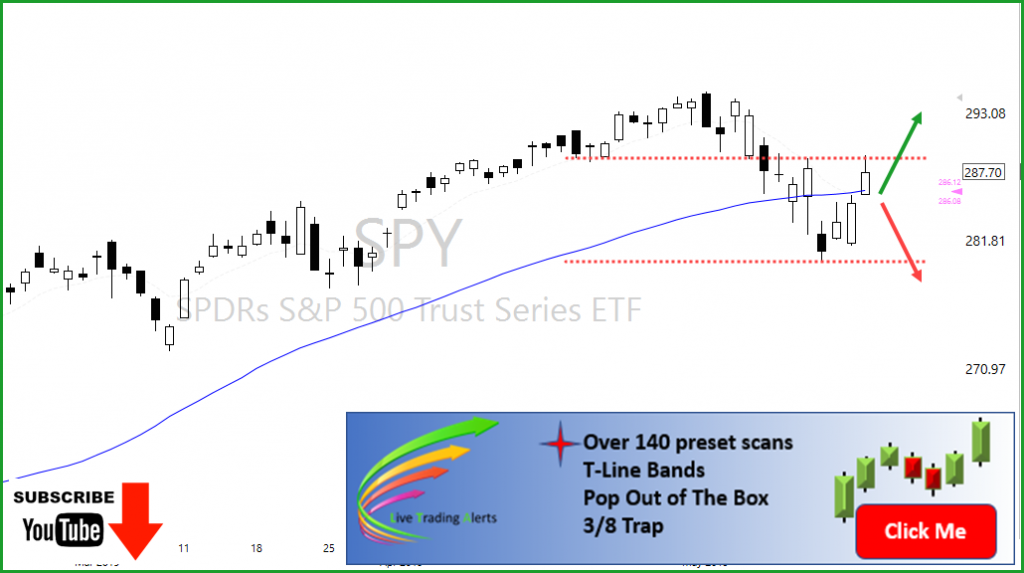
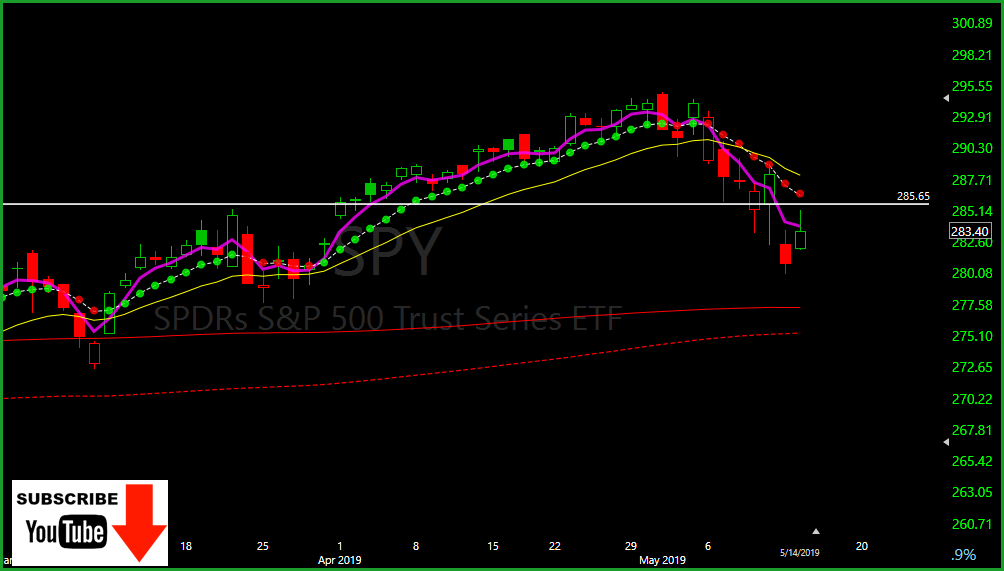
Yesterday’s candle rolled about 1.56% or about $4.40, that’s what happens when you’re afraid to fall, unfortunately, sometimes it can’t be helped. As we had said yesterday if the SPY can not turn $285.65 into support price will be forced to sleep with the 200-SMA for a day or two. Yesterday’s candle was impressive, but now we need follow-through and a test of the $285.65 area for support. For the 50-SMA followers price closed yesterday below the 50-SMA and the fast moving average has not closed back over the T-Line, meaning the buyers need more time or there are not enough buyers willing to push. Pre-Market is suggesting the buyers are in town. Hopefully, they will stay. Support above $265.85 would also suggest the recent May highs could get challenged. Keep your eye on the VXX; price is still in a bullish formation, and support is near.
In my opinion, the LTA- Live Scanner and TC2000 offer the best of the best. TC2000 charts are clear, easy to use, and read. The LTA- Live Alert Scanner pops up trade ideas that fit my style based on how I have set the program up right on my desktop. Day Traders and Swing Trader needs an edge to succeed.
🍰 Today we are adding 10 stocks to our watch list for a possible trade in the next few days. ZNGA, RCII, SE, AMD, BX, MDLZ, AIG, ZS, PG, MSFT, PEP, NOW, The alert software we at Hit and Run Candlesticks and Right Way Options is available to you. Try it for a month
🎯 The Worlds Best Trading Tools ✅ TC2000 for charting, ✅ LTA-Live Trading Alerts for real-time price action, candle and candle patterns, and western patterns. ✅ TradeHawk for placing the trades. Crazy enough, not one of them are expensive.
👍 A good tool improves the way you work. A great tool 👉 improves the way you think. – Jejj Duntemann
DISCLAIMER: Investing / Trading involves significant financial risk and is not suitable for everyone. No communication from Hit and Run Candlesticks Inc, its affiliates or representatives is not financial or trading advice. All information provided by Hit and Run Candlesticks Inc, its affiliates and representatives are intended for educational purposes only. You are advised to test any new trading approach before implementing it. Past performance does not guarantee future results. Terms of Service
Do we dare hope for a bullish follow-through this morning? Although
a presidential executive order seems to have raised trade war tensions markets are
putting on a brave face this morning. Following
a rather volatile session Asian market closed mixed but modestly higher overnight. European are currently green across the board
and US Futures point to a bullish open in the pre-market.
The world largest retailer, WMT, has already reported better
than expected to give the futures a nice bump but we have three potential market-moving
economic reports at 8:30 AM Eastern for the market to digest before the
open. Keep a close eye on price action
and remember we have important resistance levels just above that the bears
could defend. As for me I do dare to
hope for follow-through bullishness but I will patiently wait until I see proof
the bulls have the energy to deal with resistance before considering new risk.
On the Calendar
We have a lighter day on the Earnings Calendar but we have
some heavy hitters that could move the market.
Notable reports include, WMT, NVDA, AINV, AMAT, BIDU, BOOT, FRO, IQ,
LTM, MANU, NGG & WIX.
Action Plan
We had a nice steady rally yesterday following a gap down
open as the market reacted to trade tensions and declining retail sales figures. After the bell yesterday the president signed
an executive order that allows the federal government to block transactions
that involve information or communications technology citing National Security
concerns. China sees this as a direct assault
on the mobile device seller Huawei adding additional pressure to trade negotiations.
Despite that, futures are currently pointing bullish open. Dare we hope for a day of follow-through? Keep in mind we have some big earnings reports
today that could move the market as well as three potential market-moving economic
reports at 8:30 AM Eastern. If the pre-market
bullishness holds into the open remember to watch closely key resistance levels
where the bears could reassert themselves.
A gap into resistance raises the risk of a pop and drop so keep a close
eye on the price action and avoid chasing the open.
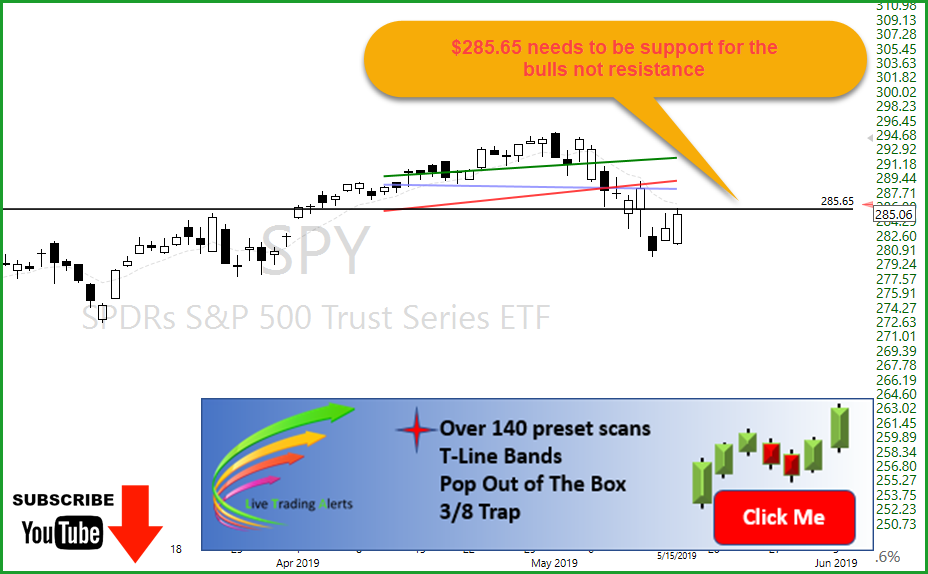
Something as simple as a trend can be a traders edge. Based on or 3-Line Dark chart the sellers are winning the game, at least as of yesterdays close. If the buyers can close above $285.65 and establish support, they have a chance to climb higher. Ultimately the trend needs to make a big turn, 👉Fast-EMA needs to be above the T-Line, and the T-Line need to be above the slow-EMA. If the sellers maintain control, we are looking at both our 200 moving average lines for a price test. Looking at the weekly chart, the SPY is at a little support but is also looking at three lower lows, and the monthly chart is supporting a Bearish Engulf. The VXX has challenged the 200-SMA in the (RBB) Rounded Bottom Breakout pattern, currently bullishly consolidating. May is turning out to be a fight between the buyers and sellers; this is where traders need the very best tools 👉for trading and have their wits about them.
In my opinion, the LTA- Live Scanner and TC2000 offer the best of the best. TC2000 charts are clear, easy to use, and read. The LTA- Live Alert Scanner pops up trade ideas that fit my style based on how I have set the program up right on my desktop. Day Traders and Swing Trader needs an edge to succeed.
🍰 Today we are adding 10 stocks to our watch list for a possible trade in the next few days. SPXS, QID, FAZ, VXX, TZA, SYY, COTY, GIS, CL, NEE. The alert software we at Hit and Run Candlesticks and Right Way Options is available to you. Try it for a month
🎯 The Worlds Best Trading Tools ✅ TC2000 for charting, ✅ LTA-Live Trading Alerts for real-time price action, candle and candle patterns, and western patterns. ✅ TradeHawk for placing the trades. Crazy enough, not one of them are expensive.
👍 A good tool improves the way you work. A great tool 👉 improves the way you think. – Jejj Duntemann
DISCLAIMER: Investing / Trading involves significant financial risk and is not suitable for everyone. No communication from Hit and Run Candlesticks Inc, its affiliates or representatives is not financial or trading advice. All information provided by Hit and Run Candlesticks Inc, its affiliates and representatives are intended for educational purposes only. You are advised to test any new trading approach before implementing it. Past performance does not guarantee future results. Terms of Service
Yesterday broad-based rally left me hopeful that we might
see at least a little follow-through bullishness this morning. Futures during the night showed some promise
of that as Asian markets rallied closing up across the board. Unfortunately that bullishness has faded this
morning ahead of a big day of earnings reports and economic reports.
Although there was some sweet relief yesterday from the
selling pressure so much technical damage was created on Monday prices now face
some pretty tough resistance levels if the rally is to continue. Perhaps this mornings data deluge and provide
the energy need to inspire the bulls higher. As you plan your risk forward however it would
be wise to remember that it’s not uncommon for prices to retest market lows at
some point. Remember the current trend
is still down and how the market deals with resistance levels will be very
important as we move forward.
On the Calendar
A busy day on the Earnings Calendar with nearly 190
companies reporting. Notable reports
BABA, CSCO, ERJ, FLO, JACK, M, NTES & TCEHY.
Action Plan
Yesterday’s relief rally appears to have been very broad-based
with many sectors involved in the recovery.
Unfortunitually Monday’s selling created so much technical damage in
charts they now face some pretty strong price resistance levels. We also have a very big day of earnings and an
economic calendar full of potential market move reports for the market to chew
on this morning.
Futures reopened last night bearish but then turned bullish
as Asian markets found the energy to recover but that warn and fuzzy feeling has
now slipped away. As I write this note futures
are pointing to a gap down of more than 50 points but that could quickly change
as earnings and economic data rolls out.
Keep a close eye on overhead resistance levels and remember that market
bottoms often require a retest of previous supports so plan your risk
carefully.