Over-trading a dull market

Over-trading a dull market

While the market waits for details of the US/China negotiations the price action has become very light and choppy and there is a danger of over-trading a dull market.  Traders can easily become bored during choppy markets talking themselves into trader they would normally avoid just to have something to do and break the boredom.

If the overall market is patiently waiting perhaps we should do the same.  Eventually the stalemate will be broken and the market could suddenly move either up or down.  Unfortunately, that big move often happens overnight and the result can be very costly if you find that you’re on the wrong side of the move.  Exercise your discipline, stay focused on price action and carefully weigh the risks of over-trading a dull market.


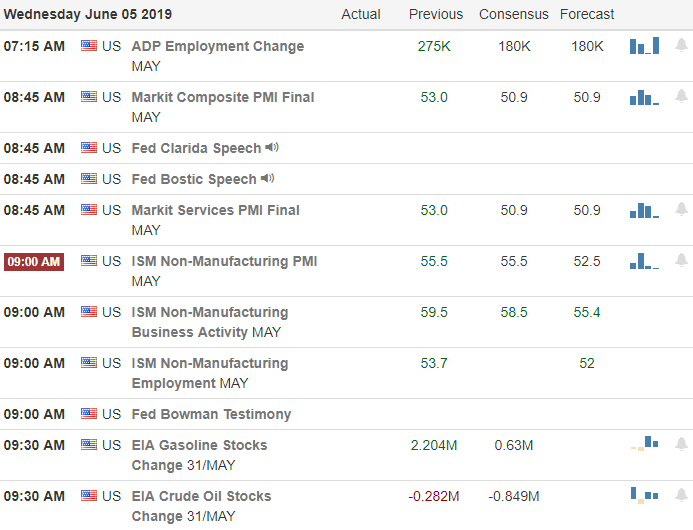
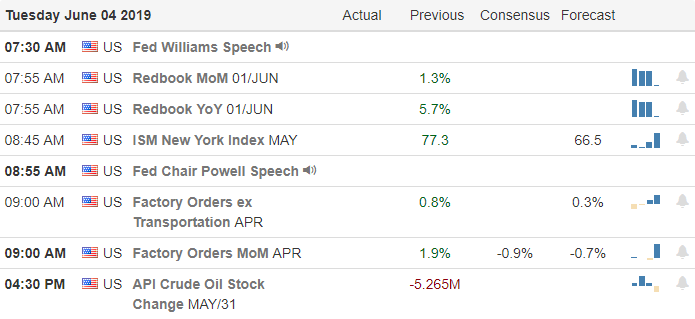
On the Calendar

On the Earnings Calendar we have more than 120 companies reporting.  Notable reports are, ANF, AEO, BJ. BKCC, BREW, DLTR, SWRE & RST.

Action Plan

Yesterday was a mind-numbingly boring day with light volume chop as the market waits for news on the trade deal.  The entire range of the DIA yesterday was less than $1.50 closing just 0.09 cents below the open of the day.  There are certainly very good looking stocks but keep in mind a single new report could move the market substantially so be careful not to over-trade out of sheer boredom.

Asian markets closed mixed over-night and currently European markets are mixed and mostly flat as it seems the entire world is watching and waiting.  Currently the futures are pointing to a modestly lower open having recovered about 50% from their overnight lows.  Perhaps earnings and economic reports can break the logjam this morning and we can pick a direction.  If not it would be wise to remember that really big moves often happen overnight on news events.  Over-trade a dull market and you can easily find yourself on the wrong side of the move.  Plan your risk accordingly.

Trade Wisely,

Doug

Holding Our T-Line Channel

The sellers (Bears) have been stopping the buyers (Bulls) in there tracks. The only thing the Bulls have done is to hold price within the Bullish T-Line channels, that is good but will it be enough? The bears have carved out and Bearish Evening Star and a Bearish Engulf and both are still active. If the sellers can force the bulls to close below $276.30, $272.40 and $266.95 could get tested. Over $280.50 the buyers will have a chance to be bulls. I have had reports of many people having trouble in the past few days. Remember to know your limits, what you can trade and what you can not trade. LOL, the market never stays the same for very long. Yesterday The LTA Scanner alerted us on (CRON) as it was just starting to work on the T-Line Bounce and the T-Line Band Scan. Yes we took advantage, and it has been worth 26.6% so far paying for the scanner four times over

Hit and Run Candlesticks News

Yesterday The LTA Scanner alerted us on (CRON) as it was just starting to work on the T-Line Bounce and the T-Line Band Scan. Yes, we took advantage, and it has been worth 26.6% so far paying for the scanner four times over in one trade. The Road To Wealth Account loves the Scanner. Trade-Ideas for the next week or so: ACB, CRON, FB, SQ, NBR, X, AER, TOL, CME, CIEN

Live Trading Alerts News

Testimonial

I have hit for over $300 this morning using your LTA scanner, I think I have found my niche!

Coach B.

Save time reviewing hundreds of charts. ✅Find EXACTLY the right set up by being alerted for only those tickers that qualify.  ✅Stop “Chasing trades” by being alerted of the move (not finding out later.) ✅Eliminate “trouble pulling the trigger” (be sure when a ticker is moving.) ✅Stop “leaving money on the table” (manage your exits with lower-time alerts.) Stop “Predicting” by trading alerts that show the turn, not forecast it. ✅Stop ignoring the overall market (by watching alerts on DIA, SPY, IWM, QQQ.)  ✅Gain massive efficiency over flipping through charts (hoping to find them at just the right time) or waiting on someone to feed you trade ideas.

Rick’s Favorite Charting Software

Free YouTube Education  •  Subscription PlansPrivate 2-Hour Coaching

 DISCLAIMER: Investing/ Trading involves significant financial risk and is not suitable for everyone. No communication from us should be considered as financial or trading advice. All information provided by it and Run Candlesticks Inc, its affiliates or representatives is intended for educational purposes only. You are advised to test any new approach before implementing it.  Past performance does  not guarantee future results. Terms of Service

A Reminder

A Reminder
ursus arctos – a wild brown bear look at me partially hidden by tree trunk in the boreal forest. a really funny scene

It has been 11 weeks since the bears have a chance to eat and yesterday snack was just a reminder they are still there and still hungry.  Yesterday, price action was also a reminder that no matter how strong a trend may appear, price resistance in the chart should be respected by traders at all-times!  Notice I didn’t say that resistance is something to fear, only that it must be respected an approached with a little caution and a plan for the what if.

Although yesterdays selloff created some market fear and volatility, technically very little damage was done at least at this point.  If the bulls get back to work then yesterday move could prove to just that reminder that the bears are still lurking about and we can never get complacent in our trading.  On the other hand if the bulls stumble again we could see a push down to test the next levels of support.  Keep in mind price resistance is still above and the bears have given us a gentle reminder of their willingness to defend it so plan your risk accordingly. 

On the Calendar

calendar

On the Earnings Calendar we have nearly 120 companies reporting results today.  Among the notable reports are: CRM, AVAV, AMBA, CIEN, KSS, ROST, SINA, TGT, URBN, VSLR & WB.

Action Plan

After a painful pop and drop yesterday futures are pointing to a modest open but there is a challenge ahead on the Economic Calendar that has the potential to trip the bulls.  At 10:00 AM Eastern we will get the New Home Sales numbers that disappointed the market in the last report.  The last reading was 657K, analysts lowered the consensus target to 590K today.  If they lowered the expectation enough perhaps it won’t be a problem but if the actual number comes in less than expected once again we could see some additional selling. 

Yesterday selloff certainly created a little fear but overall the technical damage is minimal at this point.  If the bulls can step up their efforts we could easily see the indexes slide right back into consolidation as we wait for news on a US/China trade deal.  However, if the bulls happen to stumble again the bears could be emboldened to test lower supports.  Once again that 10 AM report could be very important as to which side gains the edge.  As always stay focused on price and remember to trade the chart for what it is, not what you want it to be.

Trade Wisely,

Doug

The SPY And The Wall

This $281.50 area on the SPY is proving to quite the wall for the SPY, three times last year and two times this year. The T2122 chart (4wk New High/Low Ratio) is breaking down from its overbought area now trending toward the oversold area.  The SPY chart is a bit puzzling right now, The Bears produced a Bearish Engulf yesterday and a Bearish Evening Star a week ago, the Bulls have held the trend in a fairly tight range. There are many things I have learned in my 31-years of trading; one is to know my risk limits. Yesterday we made two great trades with VXXB and SPY puts then went to 100% cash. Until Mr. Market gives a better clue, I will plan to sit mostly on the sidelines with only a few trades here and there. A close over $280.50 the bulls have a chance, under not so much.

Hit and Run Candlesticks News

🎯 The “Road to Wealth” account to over 400% in the past 14 months and plan to double 2018 profits. 🎁Yesterday we had great profits on VXXB and SPY puts, took a few losses as well.

✅ Today I will be using the Live Trading Alerts Scanner for trade ideas. We need to see what is setting up both up and down. One spot available for the “Road To Wealth Coaching.” Mentoring program. Read More…

Live Trading Alerts News

Save time reviewing hundreds of charts. ✅Find EXACTLY the right set up by being alerted for only those tickers that qualify.  ✅Stop “Chasing trades” by being alerted of the move (not finding out later.) ✅Eliminate “trouble pulling the trigger” (be sure when a ticker is moving.) ✅Stop “leaving money on the table” (manage your exits with lower-time alerts.) Stop “Predicting” by trading alerts that show the turn, not forecast it. ✅Stop ignoring the overall market (by watching alerts on DIA, SPY, IWM, QQQ.)  ✅Gain massive efficiency over flipping through charts (hoping to find them at just the right time) or waiting on someone to feed you trade ideas.

Rick’s Favorite Charting Software

Free YouTube Education  •  Subscription PlansPrivate 2-Hour Coaching

 DISCLAIMER: Investing/ Trading involves significant financial risk and is not suitable for everyone. No communication from us should be considered as financial or trading advice. All information provided by it and Run Candlesticks Inc, its affiliates or representatives is intended for educational purposes only. You are advised to test any new approach before implementing it.  Past performance does  not guarantee future results. Terms of Service

Monday Morning Wall of Worry

The SPY wall of worry comes through again. I do think every trader is concerned about the resistance line that is drawn across 10/17/18 – 11/7/19 and 12/3/19 and rightly so. On the other hand, the same traders are seeing the bulls hold it together with a bullish trend starting in late December with a weekly chart showing Ten weeks of new higher lows, (crazy and amazing). Put those two scenarios together, and you have the perfect wall of worry. Remember that price is king and price builds trends. The VIX-X chart is showing no fear in the market and remains pushed down below our Red/Green line closing Friday at $13.57. A  VIX-X close over $16.20 would certainly get the attention of the market. We will be starting Monday cautiously bullish, taking profits into strength or base hits.

Hit and Run Candlesticks News

The start of another week of trading and we are excited! The “Road to Wealth” account to over 400% in the past 14 months and are planes are to double 2018 profits. Possible trade ideas- OSTK, KMI, BMY, MRO, WDC, FDC, BBT, NVDA, JNJ, AAPL. Two spots available for the “March Road To Wealth Coaching.” Mentoring program. Read More…


Live Trading Alerts News

✅Live Trading Alerts – 100 plus alerts/scans to choose from

Two new auto scans have been added to the LTA-Live Trading Alerts Scanner; the Bull -Fig Newton pattern and the Bear- Oreo Pattern. With over 100 built-in scans my favorite bullish scans are the Pop Out of The Box, The RBB, The 3×8 Trap, The Fig Newton. If you need set with the scanner set up or adding scans just let us know. Each day (Market hours) we provide Free Scanner coaching in our trading room #4. Warning the LTA- Live Trading Alert software is a game changer, alerts for candlesticks, candlesticks patterns, western patterns, price action, tends, bullish and bearish.

Rick’s Favorite Charting Software

Free YouTube Education  •  Subscription PlansPrivate 2-Hour Coaching

 DISCLAIMER: Investing/ Trading involves significant financial risk and is not suitable for everyone. No communication from us should be considered as financial or trading advice. All information provided by it and Run Candlesticks Inc, its affiliates or representatives is intended for educational purposes only. You are advised to test any new approach before implementing it.  Past performance does  not guarantee future results. Terms of Service

Buy the Rumor Gap

On Sunday the Wall Street Journal triggered a buy the rumor rally when they reported that the US and China are “in the final stage of completing a trade deal.”  The story offered nothing as to an actual completion date of the agreement and had little to no details about what’s included.  Nonetheless, markets around the world have reacted bullishly to the hope that some kind of agreement is forthcoming hopefully sooner than later.

We have more than 500 companies reporting earnings this week and busy economic calendar as we move toward the Friday Employment Situation report.  The index trends are still up but we still have those pesky price resistance levels above that continue to demand respect.  As we saw on Friday a gap into price resistance can prove dangerous and costly if you chase into it with a fear of missing out.  Wait for proof in the price action after the gap that buyers are stepping in supporting the gap to avoid those nasty pop and drop patterns.

On the Calendar

calendar

On the Earnings Calendar we have 64 companies stepping up to report earnings results today.

Action Plan

Friday’s gap up open into resistance found sellers and through our the morning gave back the entire gain and at one point was looking pretty grim.  Fortunately the bulls went back to work in the afternoon recovering about half of the initial morning gap.  This morning futures are once again signaling a gap up open with Asian and European markets also bullish overnight.  On Sunday the Wall Street Journal reported that the US and China are “in the final stage of completing a trade deal.”  It cited that Beijing was offering some lower tariffs on U.S. Products and markets responded bullishly around the world.

Unfortunately the story said nothing about the timeline to completion and little to no detail as to the contents in the agreement.  A true to form buy the rumor market pop!  Nonetheless, the trend is still up and thus far key resistance levels are still holding and must be respected.  We have another big week of earnings reports and several significant economic reports culminating on Friday with the big Employment Situation number on Friday morning.  As always, avoid chasing the morning gap waiting instead for proof in the price action that buyers are going to set in supporting the gap.

Trade Wisely,

Doug
#1 Traders Edge

The chart in a yesterdays blog post I had drawn two red lines, one at Monday’s high (Resistance) and one at Wednesday’s low (Support). Yesterday printed a higher low Doji within our T-Line Bands that formed the early stage of a Bullish Continuation pattern. Bullish followthrough over Monday’s high $281.31 would suggest the Bulls may be ready to challenge the $286 area. Now for the Bearish scenario – Price closes below the $277.48 support line would suggest price may be headed back to the 200-SMA. The Live Trading Alerts Scanner can and does help

It’s the first of the month, and we will start new student training on the (LTA) Live Trading Alerts. Live Trading Alerts is by far the best trading software for signaling you when stocks ready to breakout or breakdown. With a steady flow of market data, the LTA Scanner pinpoints chart patterns, candlesticks signals, and patterns, trends. The (LTA) Live Trading Alerts Scanner the trader’s edge.

Road To Wealth’s #1 Trading Tool. Year to-date total account profits of 215% could not have been achieved without the Live Trading Alerts Scanner
  • Searches for the setups
  • Creates scans for setups instead of a useless list
  • You can create your own Alert Strategies
  • Know when any of your positions are breaking down
  • Identify unusual volume flows
  • Find patterns and signals on Intraday and Daily time frames
  • Find the breakouts and breakdowns before the crowd

We also provide free set up • Try it for a month

Free YouTube Education  •  Subscription PlansPrivate 2-Hour Coaching

 DISCLAIMER: Investing/ Trading involves significant financial risk and is not suitable for everyone. No communication from us should be considered as financial or trading advice. All information provided by it and Run Candlesticks Inc, its affiliates or representatives is intended for educational purposes only. You are advised to test any new approach before implementing it.  Past performance does  not guarantee future results. Terms of Service

The Bulls Push Higher

Higher

Asian markets closed higher overnight even after China manufacturing numbers declined for the 3rd straight month.  European markets are also higher across the board this morning due to fresh US-China trade comments according to CNBC.  Consequently, US Futures are pointing to a substantial gap up this morning supposedly in reaction to yesterday’s GDP number if you believe the news.

Currently the futures suggest a gap of more than 175 Dow points this morning to test key resistance index levels.  Those caught short could enhance the bullish move, buying to cover in a so-called short squeeze.  We should also be on guard for the possibility of a pop and drop pattern at or near price resistance.  Don’t chase with the fear of missing out, take a breath and wait to see if buyers step in supporting the gap before adding risk ahead of the weekend.

On the Calendar

calendar

We get a little break on the Earnings Calendar with just 50 companies reporting earnings today.  Notable reports today are XRAY, FL and SNH.

Action Plan

Futures are sharply higher this morning though I’m not sure why other than the bulls just want to go up.  CNBC is suggesting it due to US/China trade comments but the only story I can find on the subject suggests that Intellectual Property Theft remains a major sticking point.  There is also a suggestion that the market is responding to yesterday’s strong GDP news.  Odd, but okay.  Nonetheless we are looking at a substantial gap up this morning and those caught short may trigger a short squeeze this morning.

Although we have a lighter day on the earnings calendar we have several potential market-moving economic reports this reports morning.  Remember to not chase a morning gap especially right into price resistance.  Wait to see if buyers step in supporting the gap because we don’t want to get caught in a classic pop and drop at price resistance.   If resistance does break an attack of record market highs may be in the cards.  Have a fantastic weekend everyone!

Trade Wisely,

Doug

SPY holds T-Line Band

The SPY’s Evening Star is still present as well as the QQQ’s, DIA’s and IWM. The SPY’s low yesterday was $277.48 or the Lower T-Line Band, yesterday’s low was also the 3rd lower low in a row and the 3rd lower high. The three lower lows and lower highs is a sign the sellers have more control than the buyers. However as of yesterday, not enough control to push price below the T-Line Band bullish area. $281.00 remains strong resistance but not impossible to break out. The bulls have truly been amazing. If this week’s price can hold it’s low above $276.35, it will mark the 10th week in a row of higher lows. We are still cautiously bullish, bullish because of the trend and cautious because of the $301.00 resistance.

The Month of February is coming to an end, and I would like to thank all the members for there post and comments. It is so great to read your post when you enter and exit a trade and your wins and losses, thank you. The Road To Wealth account will end the month of February with about a 15% increase or about $3,400.00.

Hit and Run Candlesticks News

Yesterday we closed another 20% from out IWM PUTS which brings the “Road to Wealth” account to over 425% increase in 14 months. Possible trade ideas- MRO, IMMU, APA, CLR, OSTK, CHK, NBR. I have opened up two more spots for the “March Road To Wealth Coaching.” Mentoring program. Read More…

Live Trading Alerts News

✅Live Trading Alerts – 100 plus alerts/scans to choose from

Two new auto scans have been added to the LTA-Live Trading Alerts Scanner; the Bull -Fig Newton pattern and the Bear- Oreo Pattern. With over 100 built-in scans my favorite bullish scans are the Pop Out of The Box, The RBB, The 3×8 Trap, The Fig Newton. If you need set with the scanner set up or adding scans just let us know. Each day (Market hours) we provide Free Scanner coaching in our trading room #4. Warning the LTA- Live Trading Alert software is a game changer, alerts for candlesticks, candlesticks patterns, western patterns, price action, tends, bullish and bearish.

Rick’s Favorite Charting Software

Free YouTube Education  •  Subscription PlansPrivate 2-Hour Coaching

 DISCLAIMER: Investing/ Trading involves significant financial risk and is not suitable for everyone. No communication from us should be considered as financial or trading advice. All information provided by it and Run Candlesticks Inc, its affiliates or representatives is intended for educational purposes only. You are advised to test any new approach before implementing it.  Past performance does  not guarantee future results. Terms of Service