Lots Of Green
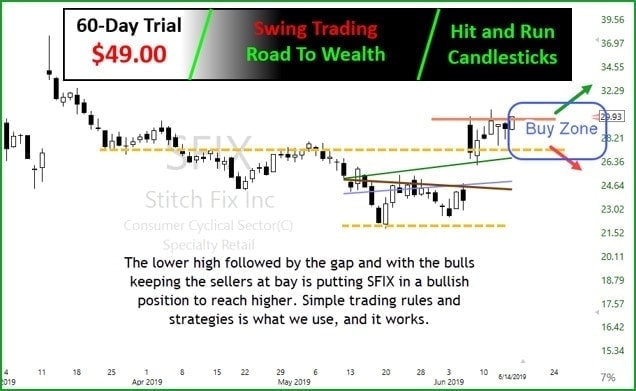
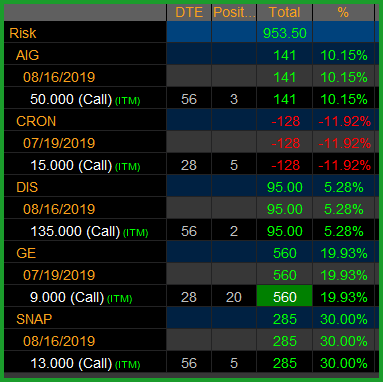
💲 Sold GDX yesterday 46% after buying it Wednesday, gaps are gifts and love it. AIG woke up yesterday and is drawing us a J-Hook continuation pattern, currently positive on AIG with 10%. Bought a little DIS yesterday up 5% so far. And GE is working with a 20% profit along with SNAP and a 30% profit. CRON is not quite green but working on it.

All buys and closes announced in the HRC Live Trading Room, be sure to tune in starting at 9:10 Eastern when I’ll review the market, trade ideas.
Have good trading day – Rick
Pre-Market Thoughts

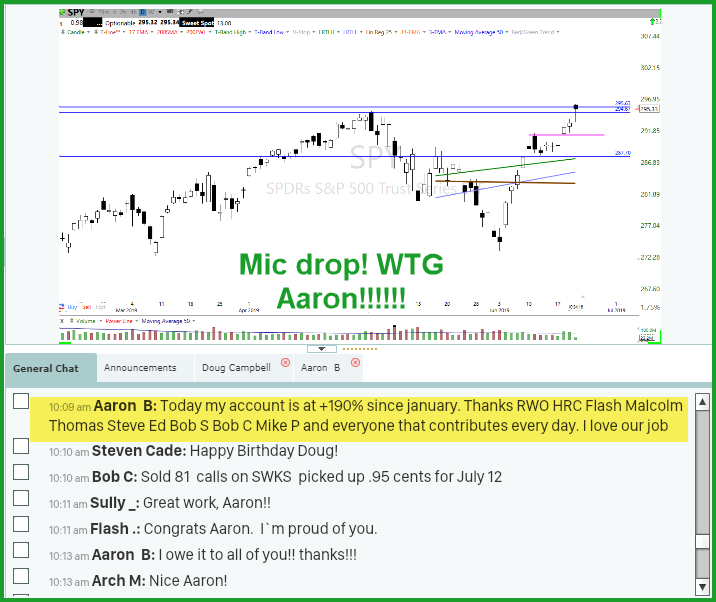
Sweet day yesterday, we heard from so many HRC and RWO subscribers that were good and green. We love to hear your feedback. Here is a quote from Aaron B.
(10:09 am) Aaron B: Today, my account is at +190% since January. Thanks, RWO HRC Flash Malcolm Thomas Steve Ed Bob S Bob C Mike P and everyone that contributes every day. I love our job!
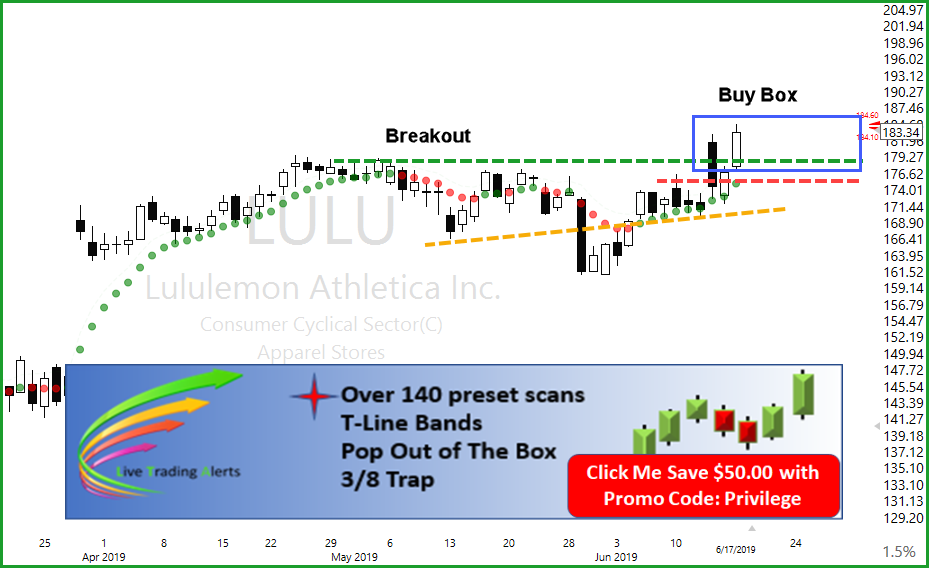
SPY gaps to new highs and closes with a Hanging man Candle, price also leaped a bit far from the T-Line, so the probabilities are that price needs a rest while the basic moving averages catch up and price finds support. I think it’s obvious to say the bulls have the upper hand. Be patient and don’t chase a chart for “Fear OF Missing Out,” we are now in a good position for a bullish pullback that sets up fantastic trades. I will be using the T-Line as my guide, price trending over the t-Line is bullish, and we need a quality entry pattern, and when price is trending below the T-Line, we show patients.
Trade Ideas
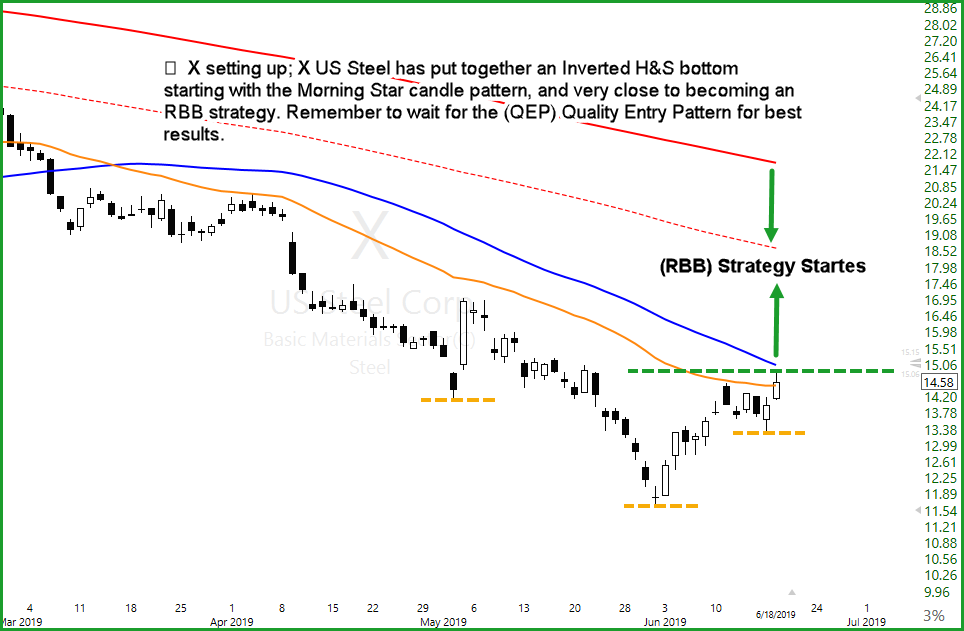
🎯 No trade ideas on Fridays; We don’t offer trade ideas on Fridays except in the live trading room. (QEP) Quality Entry Pattern for best results. Remember to wait for the (QEP) Quality Entry Pattern for best results.
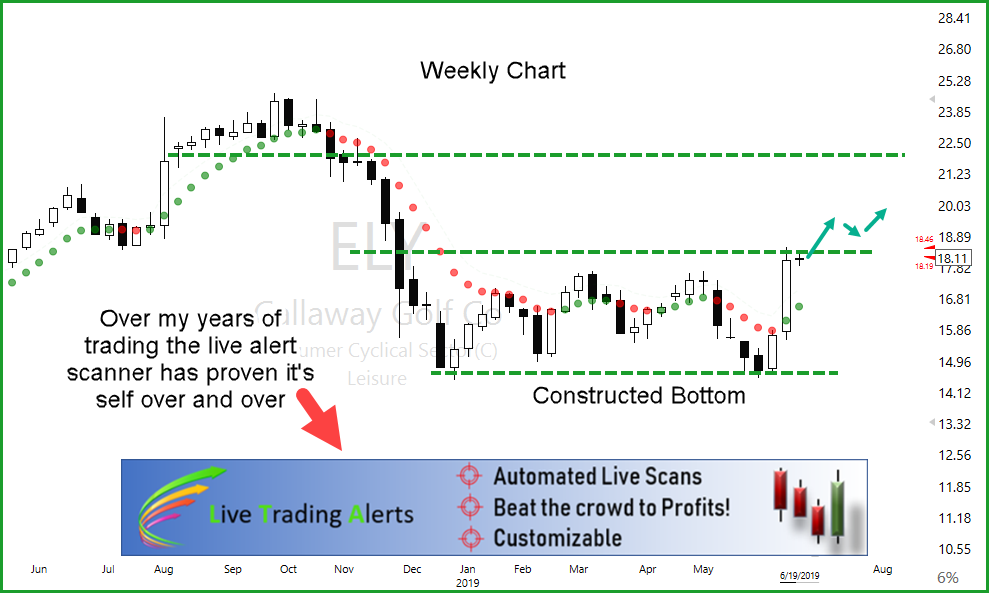
🍰 The LTA Alert Scanner and TC2000 are my tools of choice because they work!. Rick and the HRC Members kick off the trading room starting at 9:10 Eastern We review the market, and today’s trade ideas. ELY, SHOP, BX, MDR, ETSY, SPOT, LSCC, SBUX, CPRT.
✅ A Traders Edge In All Markets
The LTA Scanner can filter out charts that are trending, up or down and alert on charts that have Candlestick signals and patterns, western patterns and when indicators, such as MACD, Stochastics, RSI or Bollinger Bands have crossed or reaches the desired level. 😎 One of my favorites is the T-Line Band Scan. The right tools for the job.
We use The Worlds Best Trading Tools, TC2000 for charting, LTA-Live Trading Alerts for real-time price action, candle and candle patterns, and western patterns. The right tools for the right job.👍


Free YouTube Education • Subscription Plans • Private 2-Hour Coaching
DISCLAIMER: Investing / Trading involves significant financial risk and is not suitable for everyone. No communication from Hit and Run Candlesticks Inc, its affiliates or representatives is not financial or trading advice. All information provided by Hit and Run Candlesticks Inc, its affiliates and representatives are intended for educational purposes only. You are advised to test any new trading approach before implementing it. Past performance does not guarantee future results. Terms of Service