LTA – TC2000 Intergration

Wednesday, April 3, 2019, 1:30 pm LTA- Live Trading Alerts meeting.

Room #4 Login Here


Topics will include:

✅ 14 New Scans (V-Stop, T-Line Band, RSI, High Price Stock RBB) for example.

✅ TC2000 Integration

✅ Main App Font Sizing…for us folks going blind

✅ Features in the pipeline (ie Options data and easy Windows)

Testimonials from happy LTA users!

I have hit for over $300 this morning using your LTA scanner, I think I have found my niche!

Coach B.

Took 20% on WIX puts! Thank you LTA- Live Trading Alerts

Jerry G.

AMAZING!

Coach B.

Great tool, by the way.

Shankly

I love this scanner — made $460 this week on MYGN — right off the scanner !!

Bob S

Information about a chart, Price action, trend, patterns, and volume is the best information you can have about a chart. The LTA Live Trading Alerts Scanner delivers!

Bullish Display of Power

Display of Power

The first trading day of the second quarter the bulls put on a display of power charging through price resistance and breaking the last weeks chop zone.  Unfortunately, the bulls stopped just short of the next price resistance hurdle in all four of the major indexes.  It would be completely rational to think the momentum of yesterday bullishness would be enough to carry the index’s over this price barrier.  However, it’s also quite rational to think a little pause to take a breath or even some profit-taking might be in order.

With the DIA and SPY finally making a new high we technically in a much better position, assuming the bulls can hold this newly attained elevation.  The QQQ stopped short of a new high yesterday closing at price resistance while the IWM continues to languish in a downtrend.  Futures are currently flat this morning but keep an eye on the Durable Good Orders report at 8:30 AM Eastern as it could set the tone for the day.

On the Calendar

calendar

We have a significant decline in earnings reports today with just over 20 companies.  Notable earnings include GME, PLAY, NG & WBA.

Action Plan

After huge bullish one day rally where the Dow gained a whopping 329 points the futures indicate a more subdued open this morning.  As a matter of fact, US Futures trading in the red all night and have only begun to see positive prints in the pre-market pump.  Asian markets finish their trading day mixed but mostly higher overnight.  European markets are bullish across the board this morning after reporting stronger than expected factory activity overshadowing another failed Brexit vote.  Unless they can come to an agreement in the coming days the 5th largest economy will leave the bloc on April 12 with no deal.

Although yesterday was a great day for the market finally breaking a week-long chop zone the indexes charts find themselves with yet another price resistance hurdle just above.  Perhaps the sheer momentum of yesterday’s bullishness is enough to propel the indexes over the hurdle but we shouldn’t expect the bear to give up easily.  After such a big one day move it would not be at all surprising to see a little profit-taking to test overnight futures lows or pause the action to take a breath.  The Durable Goods Orders at 8:30 AM could set the tone for the day but the consensus estimate is expecting a decline in this potential market-moving number.

Trade Wisely,

Doug

Price Above T-Line

The SPY gapped over our Green T-Band Line and held pretty well yesterday on its way to challenge the $287 area providing the bulls can get another run put together. The 50-SMA has crossed over the 200-SMA (Golden Cross) and may put the fire back in the belly of the SPY. Price action has also put together a Bullish Inverted Head and Shoulders the past 6-7 months. The black and red dotted T-Line can provide traders with a clear path to whether the buyers or sellers are in control, if your in the trade should you be out or should you be buying. The SPY T-Line has flipped from red to green, now practice patience for the entry set up. If you need help with the T-Line, please let us know. Hi, this is Rick Saddler, the creator of the T-Line. Tonight Tuesday, April 2, 2019, is our member’s get together a webinar, and I will be sharing a few T-Line tricks with you.


HRC Road To Wealth Mentoring

Mentoring with Rick Saddler: The Road to Trading Wealth can take several different paths; it’s important to find what works for you. The Trend, Price Action, Candlesticks, Chart patterns, Support and Resistance, and Strategies is the map we use to stay on the Road To Trading Wealth. Patterns and Strategies such as The Rounded Bottom breakout, The Continuation Pattern, Trending, T-Line Bands, and the Red Green Strategies are a few of our favorites. Patterns like J-Hooks, Pop Out of The Box, The Oreo, The Fig Newton, Candlesticks are some of our favorite patterns. Read More

Hey, are you looking for the best money making tool in trading? Well, I found it and use it!! The Live Trading Alerts Scanner. I have about four terrific scans. Get it downloaded and I will be glad to work with you privately to get it set up.

Trade-Ideas for consideration: BHGE, XRAY, AXP, NBR, MO, WY, ATVI, IVZ, IPGP. Do your work, work your plan. Always have a plan/

Live Trading Alerts News

Save time reviewing hundreds of charts. ✅Find EXACTLY the right set up by being alerted for only those tickers that qualify.  ✅Stop “Chasing trades” by being alerted of the move (not finding out later.) ✅Eliminate “trouble pulling the trigger” (be sure when a ticker is moving.) ✅Stop “leaving money on the table” (manage your exits with lower-time alerts.) Stop “Predicting” by trading alerts that show the turn, not forecast it. ✅Stop ignoring the overall market (by watching alerts on DIA, SPY, IWM, QQQ.)  ✅Gain massive efficiency over flipping through charts (hoping to find them at just the right time) or waiting on someone to feed you trade ideas.

Rick’s Favorite Charting Software

Free YouTube Education  •  Subscription PlansPrivate 2-Hour Coaching

DISCLAIMER: Investing / Trading involves significant financial risk and is not suitable for everyone. No communication from Hit and Run Candlesticks Inc, its affiliates or representatives is not financial or trading advice. All information provided by Hit and Run Candlesticks Inc, its affiliates and representatives are intended for educational purposes only. You are advised to test any new trading approach before implementing it.  Past performance does not guarantee future results.  Terms of Service

Bullish Optimism

Optimism

Futures opened trading very bullish last night on optimism as the US/China trade negotiations resume in Washington DC today.  The good vibes were significantly enhanced during the night when better than expected Chinese manufacturing data came to light.  Not surprisingly, Asian markets closed sharply higher last night and European markets are strongly bullish this morning ahead of yet another Brexit vote.

Perhaps this is the bullish shot in the arm we have been waiting for to provide the momentum required to break through the index price resistance that has proved so stubborn over the last few weeks.  Keep in mind, we still have a full plate of economic and earnings data for the market to digest this morning that could either enhance or subdue how the market open.  Be careful to avoid chasing the morning open with the fear of missing out.  Watch and wait for price action to prove buyers will step in to support the gap.  Remember gaping into price resistance can produce those nasty pop and drop patterns so it’s wise to exercise a little patience this morning.

On the Calendar

calendar

We have 164 companies reporting on the first day of the 2nd quarter.  Among the notable reports CALM, DGLY & KODK.

Action Plan

Stronger than expected Chinese manufacturing data and optimism as the US and China resume trade negotiations today in Washington DC has futures signaling a substantial morning gap up open today.  Asian markets closed bullish across the board last night and European markets are also sharply higher this morning ahead of another Brexit vote.  We also have a busy Economic Calendar this morning Retail Sales, PMI Manufacturing, Business Inventories, ISM Mfg. Index and Construction Spending for the market to digest.

As I write this the Dow futures indicate a gap of more than 175 points but at one point it was more than 200 points.  If this bullishness holds, index charts will be gapping above some price resistance levels or will be very near then at the open.  Keep an eye on the US points this morning that has the possibility of enhancing or subduing the bullishness.  Technically this could be the burst fo bullish momentum to finally breakthrough the resistance above that has proved to be such a stubborn obstacle for the last few weeks.  With that said be careful not to chase the gap up open.  Let’s wait to see if the buyers support the gap because the last thing we would want to see is a pop and drop pattern.

Trade Wisley,

Doug

Pre-Market Sweet

Kellogg and Keebler near a deal and China report unexpected growth in March. It looks like a new fire has been lite under the market. Pre-market up 170 points plus while I am writing the blog. With positive trading today and a positive close the $287.00 area would make a nice target for the SPY. Friday price closed near the Green upper T-Line Band which suggests the buyers where bullish going into Friday’s close. The SPY closed Friday below red V-Stops, a breakout today would flip the dot to green. The near term on the SPY the bulls would love to capture $287.00 then $293.00ish, of course, the bulls will need to push through resistance and maintain a tradable trend. Stay cautious and nimble and remember an important key to trading success is profits, think base hits and the runs will come in.


HRC Road To Wealth Mentoring

Mentoring with Rick Saddler: The Road to Trading Wealth can take several different paths; it’s important to find what works for you. The Trend, Price Action, Candlesticks, Chart patterns, Support and Resistance, and Strategies is the map we use to stay on the Road To Trading Wealth. Patterns and Strategies such as The Rounded Bottom breakout, The Continuation Pattern, Trending, T-Line Bands, and the Red Green Strategies are a few of our favorites. Patterns like J-Hooks, Pop Out of The Box, The Oreo, The Fig Newton, Candlesticks are some of our favorite patterns. Read More

Hey, are you looking for the best money making tool in trading? Well, I found it and use it!! The Live Trading Alerts Scanner. I have about four terrific scans. Get it downloaded and I will be glad to work with you privately to get it set up.


Trade-Ideas for consideration: HD, CSCO, JNJ, ATVI, WAIR, NVDA, SNAP, YUMC, ZEN, DLTR, DHR. Do your work, work your plan. Always have a plan/

Live Trading Alerts News

Save time reviewing hundreds of charts. ✅Find EXACTLY the right set up by being alerted for only those tickers that qualify.  ✅Stop “Chasing trades” by being alerted of the move (not finding out later.) ✅Eliminate “trouble pulling the trigger” (be sure when a ticker is moving.) ✅Stop “leaving money on the table” (manage your exits with lower-time alerts.) Stop “Predicting” by trading alerts that show the turn, not forecast it. ✅Stop ignoring the overall market (by watching alerts on DIA, SPY, IWM, QQQ.)  ✅Gain massive efficiency over flipping through charts (hoping to find them at just the right time) or waiting on someone to feed you trade ideas.

Rick’s Favorite Charting Software

Free YouTube Education  •  Subscription PlansPrivate 2-Hour Coaching

DISCLAIMER: Investing / Trading involves significant financial risk and is not suitable for everyone. No communication from Hit and Run Candlesticks Inc, its affiliates or representatives is not financial or trading advice. All information provided by Hit and Run Candlesticks Inc, its affiliates and representatives are intended for educational purposes only. You are advised to test any new trading approach before implementing it.  Past performance does not guarantee future results.  Terms of Service

US/China Trade Optimism

US/China trade optimism inspired Asian markets to close higher and currently European markets are also feeling bullish ahead of another Brexit vote later this morning.  As a result, the US Futures are very happy this morning suggesting a 100 point gap up in the Dow at the open.  As great as that sounds be careful chasing the morning gap because of the significant resistance levels just above.  Let’s wait and is if buyers step in after the open supporting this gap.

If you have yet to take some profits this week, remember gaps are gifts and this morning may be a perfect time to reduce risk by taking some profits to the bank.  Be careful not to over-trade as the market tests resistance and keep in mind the bear are unlikely to give up easily.  However, the hopefulness of a US/China trade deal may be just enough to inspire the bulls to keep climbing.  Stay focused on price action and give consideration to the risk you carry into the weekend.

On the Calendar

calendar

On the last trading day of the first quarter we still have we still have companies more than 60 companies reporting.  A good thing because 2nd quarter earnings season will kick off in about three weeks.  Among those reporting BB and KMX are notable.

Action Plan

As US/China trade negotiators gave the markets a lift overnight stating the talks were productive but stopped short of providing any details.  Asian markets closed higher across the board on the trader optimism.  European markets are also higher across the board and later this morning the UK will once again vote on a Brexit plan that would have them leaving the EU by mid-May.  That of course could create a market reaction and currencies may see some fluctuation in reaction.

Currently US Futures are also suggesting a bullish open today but except the QQQ the indexes still have significant resistance levels above.  The bulls and bears have been pretty equally matched all week leaving behind indecisive candle patterns.  Perhaps the positive comments on the trade negotiations is enough to inspire the bulls but they will need some significant momentum to break the bearish resistance levels above.  Remember not to chase a morning gap into price resistance.  Wait and see if buyers step in supporting the gap.  Have a great weekend everyone.

Trade Wisely,

Doug

Going to The Beach House

Cold beer, fishing pole, I love my job

Fridays are a great day to count your money and head to the Beach House. Yesterday. The SPY had a little late day action closing off it’s low and still within the chop zone of the T-Line Bands. Note the Bull or Bear story is told once the price has broken one way or the other and confirmed. I hear this morning that China is upon trade news, this could be positive for the marker or is it already baked in the charts? We closed our (T) for a nice little base hit yesterday, still holding (KO) for 16% and XOP for 12%. Yesterday we had six trade ideas for consideration and today they all 6 look great! You can find them in a yesterdays blog post.


Hey, are you looking for the best money making tool in trading? Well, I found it and use it!! The Live Trading Alerts Scanner. I have about four terrific scans. Get it downloaded and I will be glad to work with you privately to get it set up.


HRC Road To Wealth Mentoring

Mentoring with Rick Saddler: The Road to Trading Wealth can take several different paths; it’s important to find what works for you. The Trend, Price Action, Candlesticks, Chart patterns, Support and Resistance, and Strategies is the map we use to stay on the Road To Trading Wealth. Patterns and Strategies such as The Rounded Bottom breakout, The Continuation Pattern, Trending, T-Line Bands, and the Red Green Strategies are a few of our favorites. Patterns like J-Hooks, Pop Out of The Box, The Oreo, The Fig Newton, Candlesticks are some of our favorite patterns.

Trade-Ideas for consideration: It’s Friday no trade ideas, have a fantastic weekend

Live Trading Alerts News

Save time reviewing hundreds of charts. ✅Find EXACTLY the right set up by being alerted for only those tickers that qualify.  ✅Stop “Chasing trades” by being alerted of the move (not finding out later.) ✅Eliminate “trouble pulling the trigger” (be sure when a ticker is moving.) ✅Stop “leaving money on the table” (manage your exits with lower-time alerts.) Stop “Predicting” by trading alerts that show the turn, not forecast it. ✅Stop ignoring the overall market (by watching alerts on DIA, SPY, IWM, QQQ.)  ✅Gain massive efficiency over flipping through charts (hoping to find them at just the right time) or waiting on someone to feed you trade ideas.

Rick’s Favorite Charting Software

Free YouTube Education  •  Subscription PlansPrivate 2-Hour Coaching

DISCLAIMER: Investing / Trading involves significant financial risk and is not suitable for everyone. No communication from Hit and Run Candlesticks Inc, its affiliates or representatives is not financial or trading advice. All information provided by Hit and Run Candlesticks Inc, its affiliates and representatives are intended for educational purposes only. You are advised to test any new trading approach before implementing it.  Past performance does not guarantee future results.  Terms of Service

Rounded Bottom Breakout

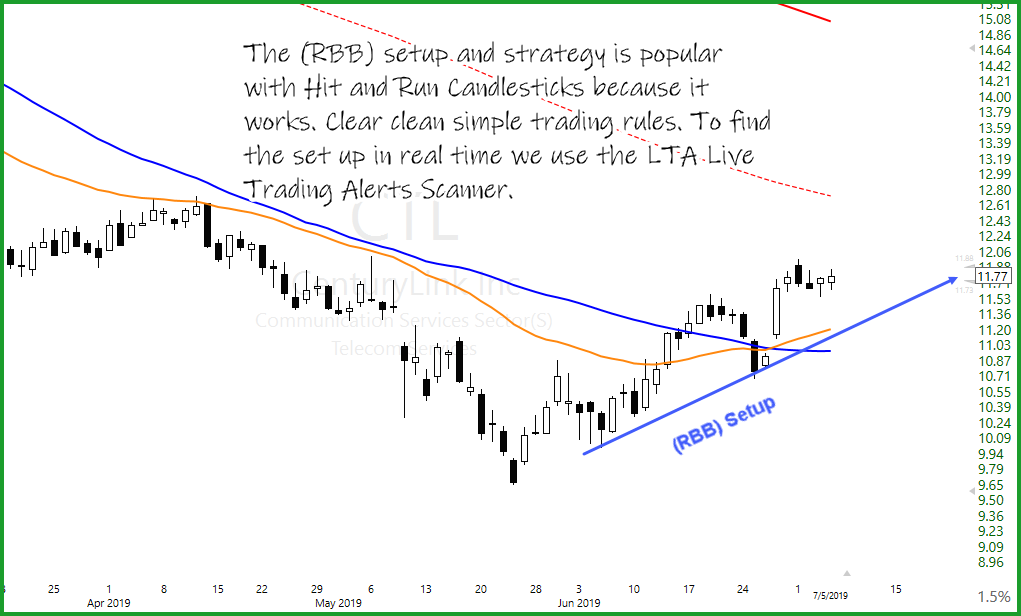
Automating Scanning and Alerting for the (RBB) Rounded Bottom Breakout. This short video shows how easy it is to have (RBB) Auto Alerts at you finger tips. LTA also has auto alerts for Trends, Pop Out of The Box, Continuation patterns, Candlesticks, T-Line Bands and so much more.

Testimonials from happy LTA users!

I have hit for over $300 this morning using your LTA scanner, I think I have found my niche!

Coach B.

Took 20% on WIX puts! Thank you LTA- Live Trading Alerts

Jerry G.

AMAZING!

Coach B.

Great tool, by the way.

Shankly

I love this scanner — made $460 this week on MYGN — right off the scanner !!

Bob S

Information about a chart, Price action, trend, patterns, and volume is the best information you can have about a chart. The LTA Live Trading Alerts Scanner delivers!

The Flag Has Not Moved

Pretty choppy day yesterday in the SPY, both the Buyers and Seller were only half trying to move the flag. Price action closed above the Red Lower T-Line Band and closed below the Green Upper T-Line Band. Our 34-ema trend line is on the bullish side of the dividing line; the conclusion is the SPY is still on the bullish side of the trend. The VIX has been feeling pretty good lately; now with a low/high – higher low in place and a possible bullish Inverted Head and Shoulder forming, this is a clue to be a little cautious. We bought (T) AT&T on the 19th currently up 25.5%, T was both an RBB and T-Line Band auto alert from LTA- Live Trading Alerts. (KO) Coke is another, entered on the 25th from the T-Line Band Auto Alert.

HRC Road To Wealth

The Road to Trading Wealth can take several different paths; it’s important to find what works for you. The Trend, Price Action, Candlesticks, Chart patterns, Support and Resistance, and Strategies is the map we use to stay on the Road To Trading Wealth. Patterns and Strategies such as The Rounded Bottom breakout, The Continuation Pattern, Trending, T-Line Bands, and the Red Green Strategies are a few of our favorites. Patterns like J-Hooks, Pop Out of The Box, The Oreo, The Fig Newton, Candlesticks are some of our favorite patterns.

Trade-Ideas for consideration: GG, PG, JNJ, WAIR, NVDA, CSCO

Live Trading Alerts News

Testimonial

Took 20% on WIX puts! Thank you LTA- Live Trading Alerts

Jerry G.

Testimonial

I have hit for over $300 this morning using your LTA scanner, I think I have found my niche!

Coach B.

Save time reviewing hundreds of charts. ✅Find EXACTLY the right set up by being alerted for only those tickers that qualify.  ✅Stop “Chasing trades” by being alerted of the move (not finding out later.) ✅Eliminate “trouble pulling the trigger” (be sure when a ticker is moving.) ✅Stop “leaving money on the table” (manage your exits with lower-time alerts.) Stop “Predicting” by trading alerts that show the turn, not forecast it. ✅Stop ignoring the overall market (by watching alerts on DIA, SPY, IWM, QQQ.)  ✅Gain massive efficiency over flipping through charts (hoping to find them at just the right time) or waiting on someone to feed you trade ideas.

Rick’s Favorite Charting Software

Free YouTube Education  •  Subscription PlansPrivate 2-Hour Coaching

DISCLAIMER: Investing / Trading involves significant financial risk and is not suitable for everyone. No communication from Hit and Run Candlesticks Inc, its affiliates or representatives is not financial or trading advice. All information provided by Hit and Run Candlesticks Inc, its affiliates and representatives are intended for educational purposes only. You are advised to test any new trading approach before implementing it.  Past performance does not guarantee future results.  Terms of Service

A Full Plate

Rumors of a US/China negotiations breakthrough, declining 10-year Treasury yields and busy earnings and economic calendars the market has a full plate this morning.  The question is will it be a satisfying meal or will it cause indigestion?  On the Economic Calendar the GDP according to consensus is expected to decline and Jobless Claims rise slightly at 8:30 AM Eastern.  One has to wonder if that could fuel growth concerns or if the numbers will come in better than expected to reduce those concerns.

The technical s of the index charts don’t provide much in the way of clarity either.  The QQQ remains the market leader holding on to a nice uptrend while the DIA and IWM struggle with resistance in a modest downtrend.  The SPY appears to want to break the tie but continues to hover just above support and below resistance with indecisive price action.  I think it’s safe to say anything is possible so plan accordingly.

On the Calendar

We have nearly 120 companies reporting earnings on the calendar today.  Notable reports include, ACN & QIWI.

Action Plan

Futures were looking lower last night as Asian markets reacted negatively to the declining 10-year treasury yield.  However, with the rumor of a US/China breakthrough in the trade negotiations European markets are up across the board and the US Futures have responded bullishly bouncing off their overnight lows.  As I write this Futures point to a flat open but with nearly 120 companies reporting earnings and a full economic calendar it’s anyone’s guess how we open trading today.

The consensus is suggesting a decline in the GDP number and a slight increase in Jobless Claims 8:30 AM Eastern.  It will be interesting to see if these two reports will add to or take away from the economic slowdown concerns.  The DIA and the IWM are still in technical down-trends under significant resistance levels even after the nice recovery off of yesterdays lows.  The SPY continues to hover between support and resistance and the QQQ remains the strongest of the indexes holding on to its uptrend.  With so many factors pushing and pulling the market today anything is possible.

Trade Wisely,

Doug