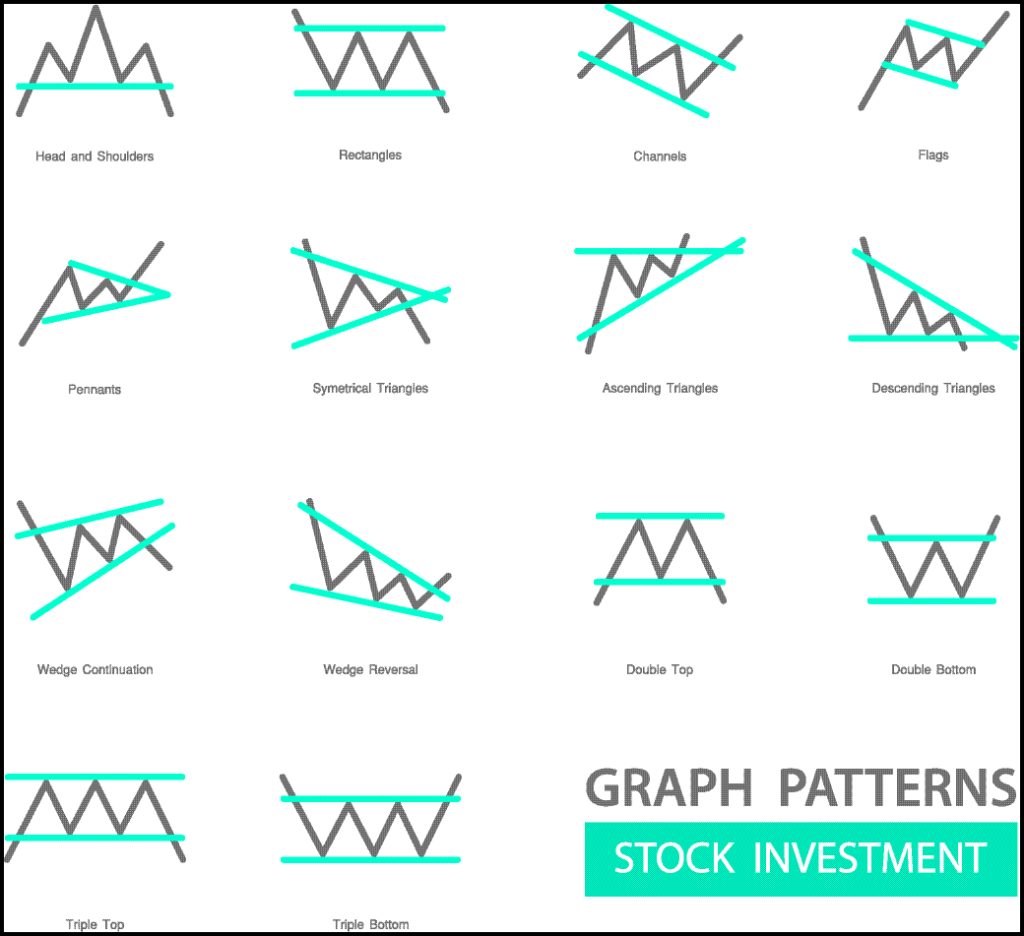
“The Trend is your friend” The key is to work with a trend that compliments your trading style. When the trend and your trading style come together as one, your engine will run smoother. Years ago, I discovered the power of the 34-EMA and the T-Line (8-EMA) when putting on the same chart. If the T-Line is below the 34-EMA, the trend is bearish. While watching for signs of a bullish reversal. This strategy using the T-Line and the 34-EMA can be used on indices, stocks, or ETF’s such as the SPY, DIA, IWM, VXX, AAPL, FDX, KO, and INTC to name a few. The SPY closed Friday’s candle and the T-Line below the 34-EMA suggesting the current trend is still negative, and the sellers have control. The trend is currently pointing at the 200-SMA with a possible bullish relief rally along the way.
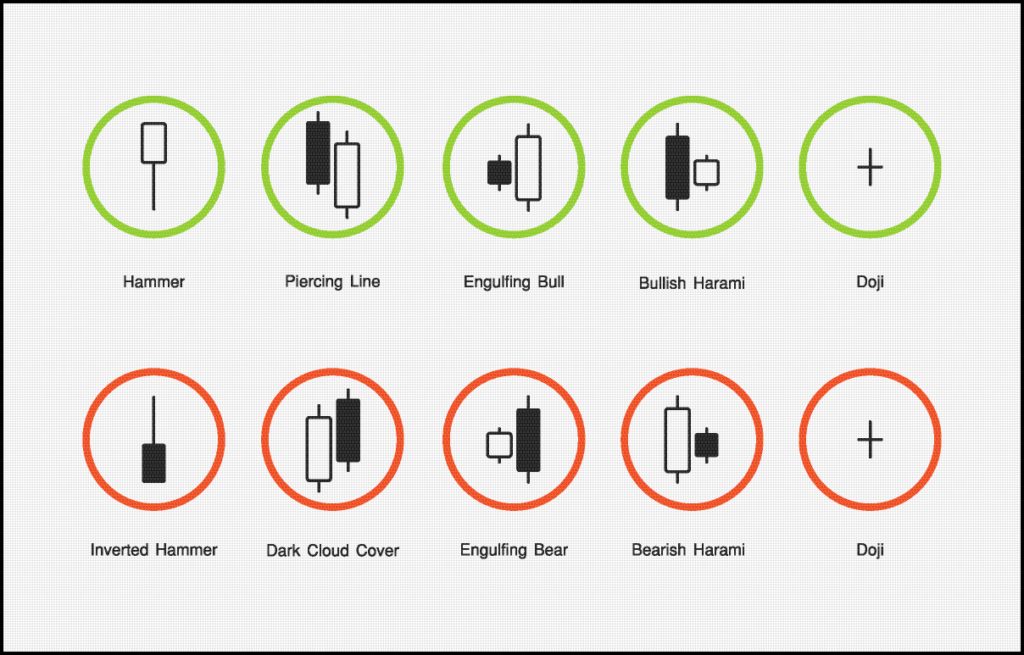
The LTA Scanner can filter out charts that are trending, up or down and alert on charts that have Candlestick signals and patterns, western patterns and when indicators, such as MACD, Stochastics, RSI or Bollinger Bands have crossed or reaches the desired level. The right tools for the job.
5/28/2019 Acton Plan
Stay
focused on trend long of short for a trade
85%
of all stocks follow the trend of the SP-500
Manage
current trades looking for base hits.
Welcome
small losses
Trade
smaller, less capital in a position
Fewer
positions
Trade
strong, stable charts, not one-day wonders
Trade
with the trend of the chart
A
trading plan for each trade.
Trades Ideas
Trade-Ideas will be sent out today using the APP throughout the APP. See App download buttons below.
We use 2 of The Worlds Best Trading Tools, TC2000 for charting, LTA-Live Trading Alerts for real-time price action, candle and candle patterns, and western patterns. The right tools for the right job.👍
DISCLAIMER: Investing / Trading involves significant financial risk and is not suitable for everyone. No communication from Hit and Run Candlesticks Inc, its affiliates or representatives is not financial or trading advice. All information provided by Hit and Run Candlesticks Inc, its affiliates and representatives are intended for educational purposes only. You are advised to test any new trading approach before implementing it. Past performance does not guarantee future results. Terms of Service
Friday’s big morning gap that ended up going nowhere as
volume quickly dried up heading into a 3-day weekend left behind more questions
than answers. While all four indexes remain
in downtrends the Friday gap left behind indecisive candle patterns on the DIA
and SPY while the QQQ printed a bearish engulfing just above key price
supports. With futures currently
pointing to flat or modestly lower open which way we go is anyone’s guess.
Although it would be nice to get some directional answers
today it’s possible we could see another day of light and choppy price action
as traders may have extended their holiday vacations through today. With the SPY and QQQ hovering near the midway
point between their 50-day and 200-day averages stay flexible and focused on the
price action for a directional clue. Remember
that currently downtrends are still in force at this time.
On the Calendar
We have less than 60 companies reporting earnings
today. Notable reports include BNS, BAH,
HEI, NIO, WDAY & YY.
Action Plan
Futures opened positive and remained positive most of the night
with Asian markets closing positive across the board as Trump concluded his
visit with Japan in hopes of striking a trade deal. Unfortunately, European markets are lower
this morning on fresh worries of Italy’s growing deficit. It would seem the Italian concerns are also
weighing on the US Futures as well in the pre-market, currently suggesting a
modestly lower open.
Friday’s price action seems to have left more questions than
answers with indecisive price action ahead of the 3-day holiday weekend. Although the QQQ finished Friday holding onto
key support levels it also left behind a concerning bearish engulfing pattern
as concerns that the trade war may transition into a tech war with China. Although hopeful for better price action today
it would not be abnormal to see struggle with light volume as many traders
extend their holiday vacation one more day.
Wild gaps continue to chop up traders accounts that try to
hold positions overnight. Thursday’s gap
down trapped long traders and those that held short positions overnight will this
morning fell the bite of the trap. I’ve
been warning that for a while that the current market condition favors day
traders has certainly been validated this week.
Now facing an uncertain holiday weekend traders have some
big decision to make. Hold positions into
the weekend rolling the dice for the Tuesday open or close positions to avoid
the risk? I for one choose the latter
and will slide into the weekend with my capital and weekly gains tucked safely away. After the morning rush we could see light and
choppy price action as trader’s head for the door to get an early start to the
weekend. Consider your risk carefully!
On the Calendar
We have a light day on the Earnings Calendar with only 13
companies reporting. Notable reports
include BKE, DXLG, FL, and HIBB.
Action Plan
This morning the futures are pointing to a significant gap which
I am very happy to see but I struggle to understand the bullishness. UK Prime Minister Theresa May resigned this
morning and European markets are responding higher on the news. Perhaps, the US markets see this as a signal
that Brexit will not happen. Yesterday’s
gap trapped those holding long positions and it looks like this morning we will
trap those holding short positions just before the long holiday weekend.
The markets wild movements have certainly confirmed my point
that swing traders have no edge and this is a day traders market. With the big gap up it is entirely possible
that a short squeeze rally could be triggered this morning. It’s also very possible the morning gap finds
no buyers ahead of the long uncertain weekend and a pop and drop pattern is the
result. After the morning rush I would
not be surprised to see the price action become very light and choppy as
traders shut down early to begin their holiday.
Stay focused on price action and consider the risk carefully you carry
into the weekend.
#1 Alert scanning tool in the world was the key to profiting 35% in ROKU, 34% in SPY Puts, and 51% in TZA yesterday. It’s Friday the start of a 3-day weekend Honoring the men and women who died while serving in the U.S military.
Yesterday the trading gods gapped us down out of and below the T-Line Bands to a $280.57 in the SPY before closing a bit higher at $282.14. The morning futures are pointing to a higher open. As of yesterday the recent low of May 13, is safe but will it last? The current trend is still weak, with price below the Bands and a bearish trend line above. The T-Line is below the 34-EMA, and the 17-EMA has breached the 34-EMA as well. The T2122 chart dropped to 10.6 yesterday triggering an oversold condition, and a relief rally is warranted. The VXX chart produced a Bull Kicker yesterday from a higher low pull back closing in the now bull trending bands, keep your eyes on the VXX chart, it can be very telling.
5/24/2019 Acton Plan
Ease
up on trades over the long weekend
Continue
to build a watchlist for the weeks ahead using the LTA Scanner.
Clean
up the Harley for a ride this weekend
Study
charts in the HRC trading room
Trade Ideas-No trades Ideas On Fridays
I hope everyone has had a profitable week, if so please let us know. If not we are here to help but we have to hear from you. Reach out to us we are here for you.
We use 2 of The Worlds Best Trading Tools, TC2000 for charting, LTA-Live Trading Alerts for real-time price action, candle and candle patterns, and western patterns. The right tools for the right job.👍
DISCLAIMER: Investing / Trading involves significant financial risk and is not suitable for everyone. No communication from Hit and Run Candlesticks Inc, its affiliates or representatives is not financial or trading advice. All information provided by Hit and Run Candlesticks Inc, its affiliates and representatives are intended for educational purposes only. You are advised to test any new trading approach before implementing it. Past performance does not guarantee future results. Terms of Service
I don’t know about you but I am becoming weary and
frustrated with the daily overnight gaps and this morning we have another big
one. Asian markets closed lower across the
board as the country stepped up their rhetoric increasing trade war tensions and
elevating market fears that this could go on and on. European markets are currently trading in red
across the board as well with their added political uncertainty.
As a result the US futures point to a Dow gap down of more
than 200 points at the open with the tech sector getting hit particularly
hard. As always we must be careful not
to chase the gap but wait patiently to see if sellers support the gap or if
this another bear trap as we’ve experienced several times during this downtrend. With all the overnight gaps and reversal
swing traders have little to no edge and although the price action has been
very challenging it currently favors experienced day traders. Be very careful and remember a big part of a
traders job is to protect your capital and if you have no trading edge then
that becomes job number one!
On the Calendar
On the Earnings Calendar we have over 50 companies reporting
results today. Notable reports include,
BKE, DXLG, FL & HIBB.
Action Plan
Another day another overnight gap and today it’s a doozie as
trade war tensions grow. Over the last
few days there has been a growing hope that the indexes could recover their
50-day moving averages. Unfortunitually,
today’s gap down confirms the failure a raises the odds of a retest of May lows
and the possibility of even a deeper selloff.
The current rhetoric coming from both countries suggests this stalemate in
negotiations could be long-lasting.
As with any large gap be careful not to chase it short. We must be patient making sure sellers
support the gap after the open. This
morning’s move certainly has the potential to create some panic selling so keep
an eye on the VIX if it begins to spike.
In the last couple of weeks we have also seen large morning gaps bring
in the bulls to defend the morning low creating a significant rally. Of course to this point those rallies have
not proved to hold but has it has made this market downtrend particularly
challenging for traders. Day traders
have the upper hand in the current market as the daily reversal gaps make it
nearly impossible for swing traders to have an edge.
Live Trading Alerts Scanner update v1.17.422 is available; We are still holding ROKU, SPY puts, TZA, XRX puts, GE, and PEP they were all brought to us via the LTA Scanner like a waiter brings a cold beer and Steak. The right tools for the right job.
It looks to me that the SPY still has a date with our pair of deuces $277.40 – $277.8. The Bears are defending the Blue Ice failure pattern pretty well; the T-Line Bands are being driven by a bear with price action below the red and green line. The T-Line is below the Volatility Dots, and yesterdays candle action closed below the T-Line. The T2122 chart (4wk New High/Low Ratio) has dropped to about 26, and it’s moving average is being pushed down as well. I have heard from many traders they are having trouble, so am I, remember to for trades that are working in your favor and the goes for the overall market, have you looked at IYT, IWM lately.
5/23/2019 Acton Plan
Manage the trades I am in
Don’t trade the first 30-min of the market, unless it is for a chart I already own
Trade smaller, less capital in a position
Fewer positions
Longer lunch (LOL)
Trade strong, stable charts, not one-day wonders
Trade with the trend of the chart
Trade for base hits
Stops, always have a stop plan
Ise the Scanner with built-in rules to find short and long trades
Trade Ideas
We are adding the following trade ideas to our watch-list. Be sure to check earnings dates. SE, ERY, DUG, SHOP, KO, PEP, GIS, LRCX, W, XRX Trend, Protective Stops, Base hits.
We use 2 of The Worlds Best Trading Tools, TC2000 for charting, LTA-Live Trading Alerts for real-time price action, candle and candle patterns, and western patterns. The right tools for the right job.👍
DISCLAIMER: Investing / Trading involves significant financial risk and is not suitable for everyone. No communication from Hit and Run Candlesticks Inc, its affiliates or representatives is not financial or trading advice. All information provided by Hit and Run Candlesticks Inc, its affiliates and representatives are intended for educational purposes only. You are advised to test any new trading approach before implementing it. Past performance does not guarantee future results. Terms of Service
No written blog today due to a power outage at my home. I had it almost completed when the power went out for a few minutes and everything was lost. Grrr. 😜
On the Calendar
On the earnings calendar we have several notable reports. They include AAP, CTRP, LOW, NTAP, SCVL, SMRT, TGT, VFC & VIPS.
We bought Roku a few days ago after the LTA scanner popped an alert yesterday we are up 21.1% What would you expect from the #1 Live Alert scanning tool in the World. I would be more than happy to teach how I use the LTA Stanner. Watch for a 4-hour clinic, coming soon.
The SPY closed
a bit higher than the day before but not over the 50-SMA and the $290.98 line
we talked about yesterday. Price action has not pushed through the T-Line Bands,
and the V-Stop Dots are red. The VXX still does not show much fear on the daily
chart other then it is set up with a low high and higher low all it needs is a
reason, the conditions are in place. The player, SPY, DIA, QQQ, IWM, SMA, IYT already
have 50-pounds of moving averages on top of them.
Acton Plan, Trade Toughts To Today
Manage
the trades I am in
Don’t
trade the first 30-min of the market, unless it is for a chart I already own
Trade
smaller, less capital in a position
Fewer
positions
Longer
lunch (LOL)
Trade
strong, stable charts, not one-day wonders
Trade
with the trend of the chart
Play
with base hits
Stops,
always have a stop plan
Trade Ideas
We are adding the following trade ideas to our watch-list. Be sure to check earnings dates. FAS, ERX, AMJ, XHB, PAYX, NWL, CNC, HES, Trend, Protective Stops, Base hits.
We use 2 of The Worlds Best Trading Tools, TC2000 for charting, LTA-Live Trading Alerts for real-time price action, candle and candle patterns, and western patterns. The right tools for the right job.👍
DISCLAIMER: Investing / Trading involves significant financial risk and is not suitable for everyone. No communication from Hit and Run Candlesticks Inc, its affiliates or representatives is not financial or trading advice. All information provided by Hit and Run Candlesticks Inc, its affiliates and representatives are intended for educational purposes only. You are advised to test any new trading approach before implementing it. Past performance does not guarantee future results. Terms of Service
A 90-day grace period added to the technology ban with
Huawei has the lifted the spirits of the futures market this morning and relieved
some of the strong selling pressure in the NASDAQ. Futures are pointing to more than a 100 point
gap up open in the Dow and the NASDAQ is showing at least a partial recovery of
yesterday’s rout. However there is still
significant technical damage in the charts and with US/China negotiations
stalled, repairing the damage could take some time.
Price action continues to be very challenging with what
seems almost daily overnight reversals and big gaps. Swing traders are likely finding it very
difficult to maintain an edge of any kind as the volatility favors the quick in
out of day trading avoiding the overnight risk.
Remember don’t fight the market and don’t trade just to have something
to do. Remain disciplined to your
trading plan and profit your capital until your edge returns.
On the Calendar
On the Earnings Calendar we have more than 70 companies
reporting with a big emphasis in retail for the rest of the week. Among the notables today, KSS, JWN, CRMT, EV,
HD, JCP, TJX, TOL and URBN,
Action Plan
After the close yesterday a 90 day grace period was added to
the Huawei blacklisting to relieve some pressure on the US tech companies. This exemption allows Googe to send software updates
to Huawei phones which use its Android operating system through August 19th. As a result NASDAQ futures are recovering substantially
this morning and lifting the spirits of the other major indexes as well.
Unfortunitually the divide between the US and China trade
negotiations seems to have grown and according to reports the trade war could
get worse before it gets better. Despite
that US futures are pointing to a positive open this morning but keep in mind
there is still significant technical damage in the charts that will likely take
some time to repair. The overnight reversals
and volatility continue to favor the very nimble day traders and making it
challenging for swing traders to matain an edge of any kind.
Futures are up this morning as this blog is being written. Looking at the SPY (weekly chart) it is clear to see price on a support and the 23.6 Fib line. (Not too surprised of a bounce and a test of the 50-SMA) The daily chart has the 200-SMA 2.3% below yesterdays close, and the daily Blue Ica failure is still in the game. Bullish price action would have to close above $289.20 for the buyers to be in control. In my humble opinion, anything less than $289.20 would keep the current downtrend intact. The T2122 chart is now in an oversold area; buyers are starting to peck around, but will they be able to give us a solid close in the next day or so over $289.20? Remember base hits and protective stops. Set a plan 2:1 minimum and when long buy near support and when shorting buy near resistance. The market of late has been challenging for even the best of traders, ask them what their tricks are to survive.
Trade Ideas
We are adding the following trade ideas to our watch-list. Be sure to check earnings dates. COST, SYF, PEP, BX, AXP, LMT, MA, MET. Trend, Protective Stops, Base hits.
We use 2 of The Worlds Best Trading Tools, TC2000 for charting, LTA-Live Trading Alerts for real-time price action, candle and candle patterns, and western patterns. The right tools for the right job.👍
DISCLAIMER: Investing / Trading involves significant financial risk and is not suitable for everyone. No communication from Hit and Run Candlesticks Inc, its affiliates or representatives is not financial or trading advice. All information provided by Hit and Run Candlesticks Inc, its affiliates and representatives are intended for educational purposes only. You are advised to test any new trading approach before implementing it. Past performance does not guarantee future results. Terms of Service