
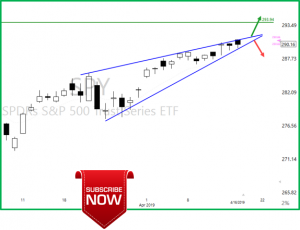
Another higher low for the SPY, the high had trouble, but the low was higher. Yesterday (Tuesday) was the 12th day above the T-Line Band. The SPY chart does look like it’s determined to challenge the $293.934 September high. Seriously the wall of worry is starting to get to traders, let’s keep it simple: Stay with the charts that are trending and the trend makes sense. Use trend lines and price action (Candlesticks) to determine if the trade is still in your favor. Become a base hitter by pulling off profits as price moves in your direction.
You can see from the SPY chart (above) the trend channel is narrowing as price moves closer to the SPY all-time high. As price narrows, I will be watching for a decisive break one way or another (Bullish or Bearish). Usually, when price narrows and builds pressure, a move is in the works.
✅ Trade-Ideas for consideration: NBR, WDC, RIOT, STX, UCO, HPQ, TIF, CAT, <AR, XOP, UTX. Let the LTA Scanner do you work for you


Free YouTube Education • Subscription Plans • Private 2-Hour Coaching
DISCLAIMER: Investing / Trading involves significant financial risk and is not suitable for everyone. No communication from Hit and Run Candlesticks Inc, its affiliates or representatives is not financial or trading advice. All information provided by Hit and Run Candlesticks Inc, its affiliates and representatives are intended for educational purposes only. You are advised to test any new trading approach before implementing it. Past performance does not guarantee future results. Terms of Service


Comments are closed.