
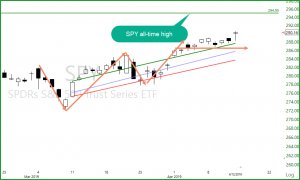
Is the SPY determined to hit $293.94 or what? The buyers seem to be on a mission as you can clearly see in the SPY chart to challenge the SPY all-time high and the sellers seem ok with this as well. Friday ended the day with the 10th day in a row above the T-Line and the T-Line High Line. Friday’s candle does open the door for a possible Hangman but let’s not predict, let’s wait for the candle to form and confirm. The trend is still bullish, and price action still suggests the bulls are in control. The T-Line Bands (on the chart they are the GREEN, BLUE and RED lines) have proved to be a fantastic tool for trend, great trading patterns, and profits. The LTA Live Trading Alert Scanner has this scan built into it, and I love it! If you would like to test drive the LTA Scanner for a month and have me (Rick Saddler) personally work with you to set it up click this link and let’s plan a date. Test LTA Drive Here
✅ Trade-Ideas for consideration: CMCSA, V, CSCO, ZAYO, MDLZ, TGT, ORCL, INFN, ECA, SM, NSC, OLED. Let the LTA Scanner do you work for you


Free YouTube Education • Subscription Plans • Private 2-Hour Coaching
DISCLAIMER: Investing / Trading involves significant financial risk and is not suitable for everyone. No communication from Hit and Run Candlesticks Inc, its affiliates or representatives is not financial or trading advice. All information provided by Hit and Run Candlesticks Inc, its affiliates and representatives are intended for educational purposes only. You are advised to test any new trading approach before implementing it. Past performance does not guarantee future results. Terms of Service


Comments are closed.