Thank You, Mr. Fed,

💲 You really gotta love the business of trading, while sitting in the doctor’s office yesterday. I bought the GDX Sept. $25.50 Calls, up nicely today. ROKU had a bullish Pop Out of The Box pattern yesterday up 22% yesterday and looks like we get more today. SNAP is still trending currently up 25.7%.

All buys and closes announced in the HRC Live Trading Room, be sure to tune in starting at 9:10 Eastern when I’ll review the market, trade ideas.

Have good trading day – Rick

Pre-Market Thoughts

Thank you, Mr. Fed, and the market, thanks to you. It seems based on the market action it is pleased with the remarks from Mr. Powell. The SPY held well yesterday and looks to be gapping up today. (Remember gaps can be gifts) And profiting or some profiting into strength has worked great for my trading strategy over the years; we call that base hits. The new number for the SPY to beat is $294.95, beat means breakout and hold. A great way to follow the trend of the SPY is with price action (candlesticks) and the T-Line chain. The VIX is still trending down based on the price leading the T-Line chain down. Two charts I have on one of my screens is the VXX and FNGU chart, they are helpful with being one with the market.

Trade Ideas

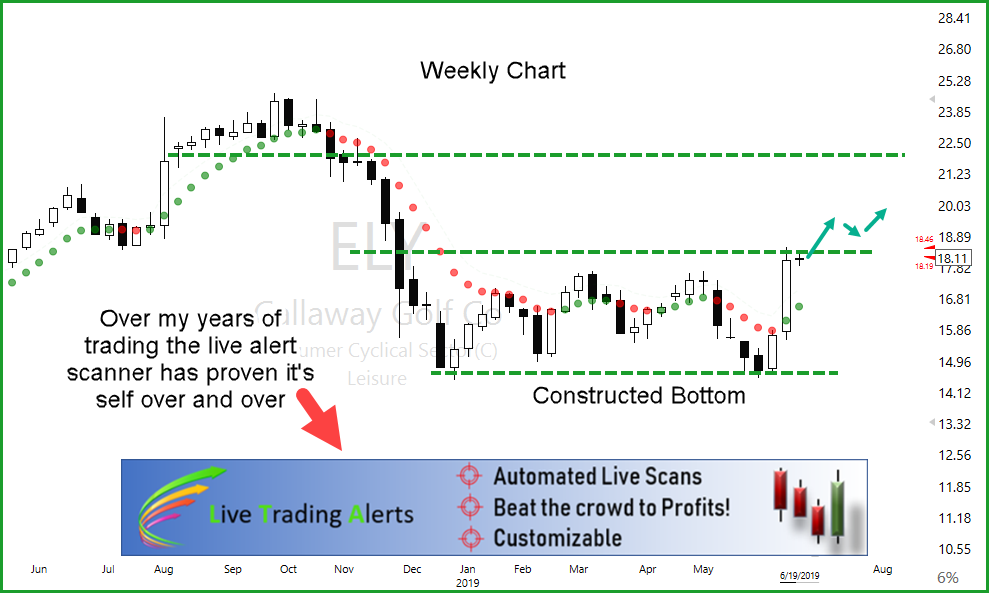
🎯 ELY is setting up; ELY Callaway has gapped up over resistance recently and currently forming a continuation chart pattern. There is always a possible entry on the building of the chart pattern, but the money and the bullishness starts when price action is above $18.30. Remember to wait for the (QEP) Quality Entry Pattern for best results.
🍰 The LTA Alert Scanner and TC2000 are my tools of choice because they work!. Rick and the HRC Members kick off the trading room starting at 9:10 Eastern We review the market, and today’s trade ideas. ELY, SHOP, BX, MDR, ETSY, SPOT, LSCC, SBUX, CPRT.

✅ A Traders Edge In All Markets

The LTA Scanner can filter out charts that are trending, up or down and alert on charts that have Candlestick signals and patterns, western patterns and when indicators, such as MACD, Stochastics, RSI or Bollinger Bands have crossed or reaches the desired level. 😎 One of my favorites is the T-Line Band Scan. The right tools for the job.

We use The Worlds Best Trading Tools, TC2000 for charting, LTA-Live Trading Alerts for real-time price action, candle and candle patterns, and western patterns. The right tools for the right job.👍

Free YouTube Education  •  Subscription PlansPrivate 2-Hour Coaching

DISCLAIMER: Investing / Trading involves significant financial risk and is not suitable for everyone. No communication from Hit and Run Candlesticks Inc, its affiliates or representatives is not financial or trading advice. All information provided by Hit and Run Candlesticks Inc, its affiliates and representatives are intended for educational purposes only. You are advised to test any new trading approach before implementing it.  Past performance does not guarantee future results.  Terms of Service

SNAP closed ½ 31%

💲 From our June 11th blog post: SNAP popped, and we closed ½ for 31% yesterday. CMCS we closed for a small profit because of the long upper wick, we will buy it back on a qualified buy pattern. Roku doing ok and GE hade a good day but really needs to break out of $10.50. LULU broke out yesterday and looking great, up 3-days need a little rest before buy now. Note the charts I look at have nothing to do with what the Fed may or may not do they are all based on the charts themselves. All buys and closes announced in HRC Live Trading Room, be sure to tune in starting at 9:10 Eastern when I’ll review the markets, trade ideas.

Have good trading day – Rick

Pre-Market Thoughts

Big day with the Feds (announcement @ 2:00 pm Eastern) and I suspect we will see a little volatility as well. I personally don’t think chasing the market or charts today is the wise thing to do, let the dust settle wait for the quality chart patterns, wait for your favorite charts to come back to you, so you have more control. $291.10 was cleared by the spy which such a bullish tone and produced a J-J hook continuation pattern. I still think any consolidation above $287.70 remains bullish if price action (the candlesticks) play their part right. The VIX is still not showing any fear and still trading below a down trending T line.

  1. ✅ Be patient. Know what you want and be patient
  2. ✅ Always plan your trade out
  3. Use our base hit strategy, sell into strength
  4. Buy close to your stop and support
  5. USE the LTA Trade Alert Scanner to find the winners and use Promo Code: Privilege for a $50.00 discount

Trade Ideas

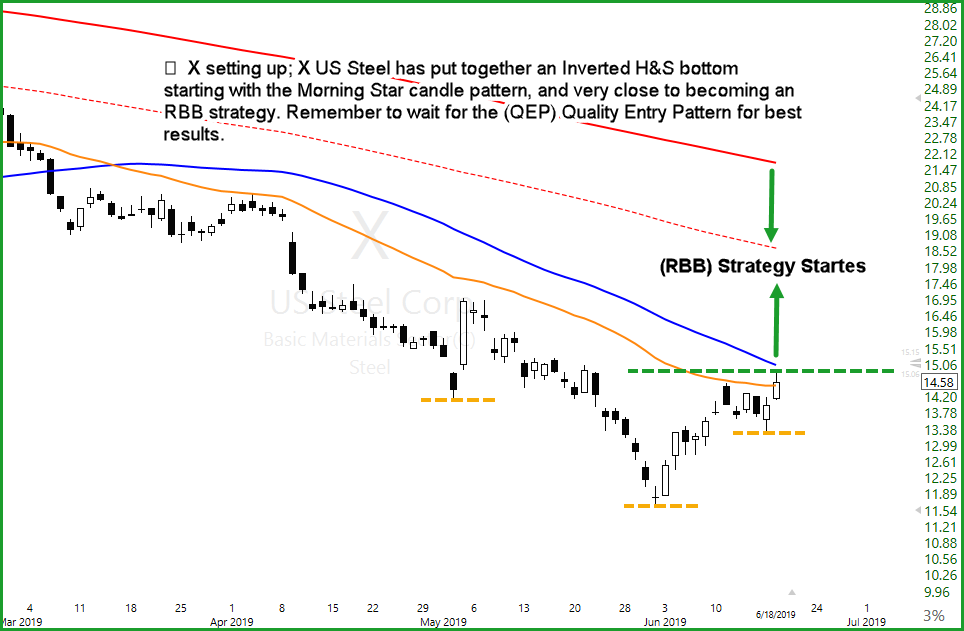
🎯 X setting up; X US Steel has put together an Inverted H&S bottom starting with the Morning Star candle pattern, and very close to becoming an RBB strategy. Remember to wait for the (QEP) Quality Entry Pattern for best results.

🍰 The LTA Alert Scanner and TC2000 are my tools of choice because they work!. Rick and the HRC Members kick off the trading room starting at 9:10 Eastern We review the market, and today’s trade ideas. KL, MGM, X, BA, CTL, HON, AUY, MRO, EGO, AMD

✅ A Traders Edge In All Markets

The LTA Scanner can filter out charts that are trending, up or down and alert on charts that have Candlestick signals and patterns, western patterns and when indicators, such as MACD, Stochastics, RSI or Bollinger Bands have crossed or reaches the desired level. 😎 One of my favorites is the T-Line Band Scan. The right tools for the job.

We use The Worlds Best Trading Tools, TC2000 for charting, LTA-Live Trading Alerts for real-time price action, candle and candle patterns, and western patterns. The right tools for the right job.👍

Free YouTube Education  •  Subscription PlansPrivate 2-Hour Coaching

DISCLAIMER: Investing / Trading involves significant financial risk and is not suitable for everyone. No communication from Hit and Run Candlesticks Inc, its affiliates or representatives is not financial or trading advice. All information provided by Hit and Run Candlesticks Inc, its affiliates and representatives are intended for educational purposes only. You are advised to test any new trading approach before implementing it.  Past performance does not guarantee future results.  Terms of Service

SMAR up 11%

💲 On June 11th we posted SMAR here in the blog, at the close yesterday it was up 11%. Friday held ROKU back followed by a Harami yesterday, time will tell. AIG has yet to find buyers to break it out, keep stops on. GE has broken out of a wedge, and the last few days has pulled back and tested. Yesterday we picked up a little CMCSA, nice breakout of the T-Line Bands. All buys and closes announced in HRC Live Trading Room, be sure to tune in starting at 9:10 Eastern when I’ll review the markets, trade ideas.

Pre-Market Thoughts

Geezs yesterday was boring, and I don’t expect much more from today, it seems traders and investors are waiting on the FED decision Wednesday. On the SPY between $291.10 and $287.70 is just noise, above the $291.10 the bulls have a chance to challenge the May high. Below $287.70 we could see a test of $282.20, which is the 50% retracement. The VXX chart still suggests no fear and has traded below the T-Line for the past 10-days. Above $28.30 would produce a little fear and volatility in the market.

  1. ✅ Be patient. Know what you want and be patient
  2. ✅ Always plane your trade out
  3. Use our base hit strategy, sell into strength
  4. Buy close to your stop and support
  5. USE the LTA Trade Alert Scanner to find the winners

Trade Idea With Chart

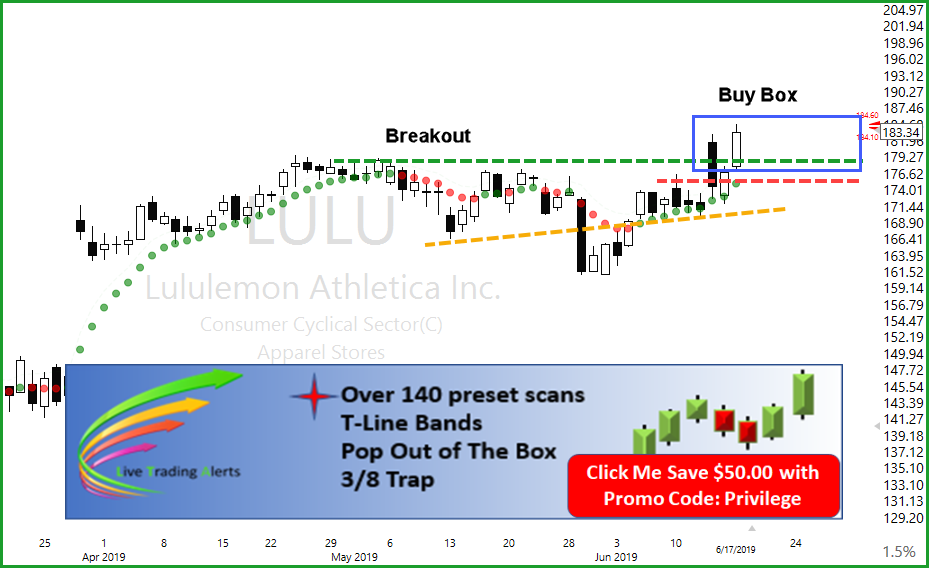
🎯 LULU breaking out; LULU found support in late May and took about 13 days to work itself back to challenge the top. Yesterday LULU broke out and held well at the close. Above $178.00, we are bullish and will wait for a qualified entry pattern and price action.

🍰 The LTA Alert Scanner and TC2000 are my tools of choice because they work!. Rick and the HRC Members kick off the trading room starting at 9:10 Eastern when we review the markets, trade ideas, and PFE.

✅✅ Other charts we plan to cover in the trading room, 9:10 am Central: ACHN, LULU, SBGI, ARWR, BABA, CMCSA

✅ A Traders Edge In All Markets

The LTA Scanner can filter out charts that are trending, up or down and alert on charts that have Candlestick signals and patterns, western patterns and when indicators, such as MACD, Stochastics, RSI or Bollinger Bands have crossed or reaches the desired level. 😎 One of my favorites is the T-Line Band Scan. The right tools for the job.

We use The Worlds Best Trading Tools, TC2000 for charting, LTA-Live Trading Alerts for real-time price action, candle and candle patterns, and western patterns. The right tools for the right job.👍

Free YouTube Education  •  Subscription PlansPrivate 2-Hour Coaching

DISCLAIMER: Investing / Trading involves significant financial risk and is not suitable for everyone. No communication from Hit and Run Candlesticks Inc, its affiliates or representatives is not financial or trading advice. All information provided by Hit and Run Candlesticks Inc, its affiliates and representatives are intended for educational purposes only. You are advised to test any new trading approach before implementing it.  Past performance does not guarantee future results.  Terms of Service

Fed Focus the Next Two Days

💲 Traders focus will likely be on the Fed meeting starting Tuesday. AIG, A trade we have been holding setting up nicely with a pullback in the T-Line bands. With the Thursday Bullish Engulf and the Doji on Friday, we are ready. Trading requires a level of trading education that most people just wanting a stock pick and to follow, likely does not have that level of education in trading. Having the right education, tools, and an understanding of Candlesticks signals make all the difference in the world. The LTA Live Trading Alert Scanner and the Hit and Run family is the best of the best. All buys and closes announced in HRC Live Trading Room, be sure to tune in starting at 9:10 Eastern when I’ll review the markets, trade ideas.

I would suspect the next day and a half will be much like the last week, choppy and boring. I think a large number of traders are on the sidelines waiting to hear the Fed attitude on a rate cut/hike in June, July, or later.  The SPY still has a Shooting Star and a Bearish Engulf staring at us, but the bulls have done a great job in containing any sell-off. The sideways move the last three days has allowed the T-Line to catch up to the price; this could be very helpful for the bullish scenario. The bearish scenario is easy; we close below the T-Line we will look for lower support. The VXX is still trading under the T-Line (No Fear) and still under the lowest T-Line band, (still no Fear). If the VXX can get over $28.30, we could see the (Fear).

👉 Friday, June 14, we didn’t do much of anything with trading, we flew to Florida and enjoyed some beach time for Fathers, stay tuned. A relaxing traders life.

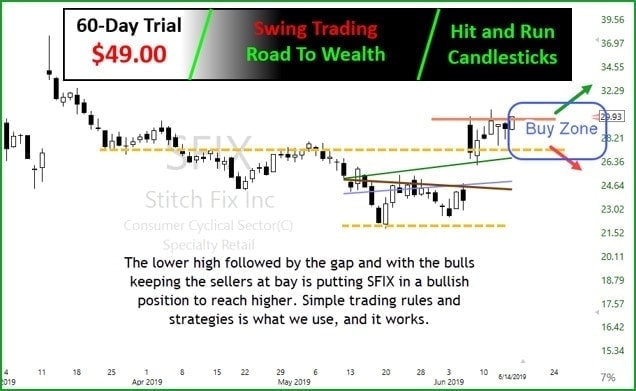
🎯 SFIX is one for the watchlist;  The lower high followed by the gap and with the bulls keeping the sellers at bay is putting SFIX in a bullish position to reach higher. Simple rules and strategies are what we use, and it works.

🍰 The LTA Alert Scanner and TC2000 are my tools of choice because they work!. Rick and the HRC Members kick off the trading room starting at 9:10 Eastern when we review the markets, trade ideas, and PFE. ✅✅ Other charts we plan to cover is: SFIX, URBN, SKK, FB, VAG, SHOP, AAPL, TTD, YY

✅ A Traders Edge In All Markets

The LTA Scanner can filter out charts that are trending, up or down and alert on charts that have Candlestick signals and patterns, western patterns and when indicators, such as MACD, Stochastics, RSI or Bollinger Bands have crossed or reaches the desired level. Hey, check out the NEW BULL PERFECT TREND ALERT. The right tools for the job.

Acton Plan

  1. ✅ Be patient. Know what you want and be patient
  2. ✅ Always plane your trade out
  3. Use our base hit strategy, sell into strength
  4. Buy close to your stop and support
  5. USE the LTA Trade Alert Scanner to find the winners

We use 2 of The Worlds Best Trading Tools, TC2000 for charting, LTA-Live Trading Alerts for real-time price action, candle and candle patterns, and western patterns. The right tools for the right job.👍

Free YouTube Education  •  Subscription PlansPrivate 2-Hour Coaching

DISCLAIMER: Investing / Trading involves significant financial risk and is not suitable for everyone. No communication from Hit and Run Candlesticks Inc, its affiliates or representatives is not financial or trading advice. All information provided by Hit and Run Candlesticks Inc, its affiliates and representatives are intended for educational purposes only. You are advised to test any new trading approach before implementing it.  Past performance does not guarantee future results.  Terms of Service

How About Those St Louis Blues

💲 Congratulations – St. Louis Blues “Stanley Cup Winners!” No trades were closed yesterday 6/12/19.  We did PFE Sept. $41.00 Calls and explained in the trading room in detail why we did. Having the right tools and an understanding of Candlesticks signals make all the difference in the world. The LTA Live Trading Alert Scanner and the Hit and Run family is the best of the best. All buys and closes announced in HRC Live Trading Room, be sure to tune in starting at 9:10 Eastern when I’ll review the markets, trade ideas.

It looks as if the futures are a little bullish this morning and may try to challenge the @289.25 line or the top of the Doji yesterday. A positive close over $289.25 could put a spark in one of the bull’s eyes; the other eye will be on that Bearish Engulf that will want to defend the current top.  Bullish Follow-though at the close will be important to be overly long. Fed talk coming up will be an important factor in price action, trading until then could be a little erratic and sloppy. The VXX is still under the T-Line (No Fear) and still under the lowest T-Line Channel we use (still no Fear). If the VXX can get over $28.30, we could see the (Fear).

👉 Yesterday Tuesday, June 12/19, we did not close any trades, but we did buy PFE, PFE Sept. $41.00 Calls and explained in the trading room in detail why we did.

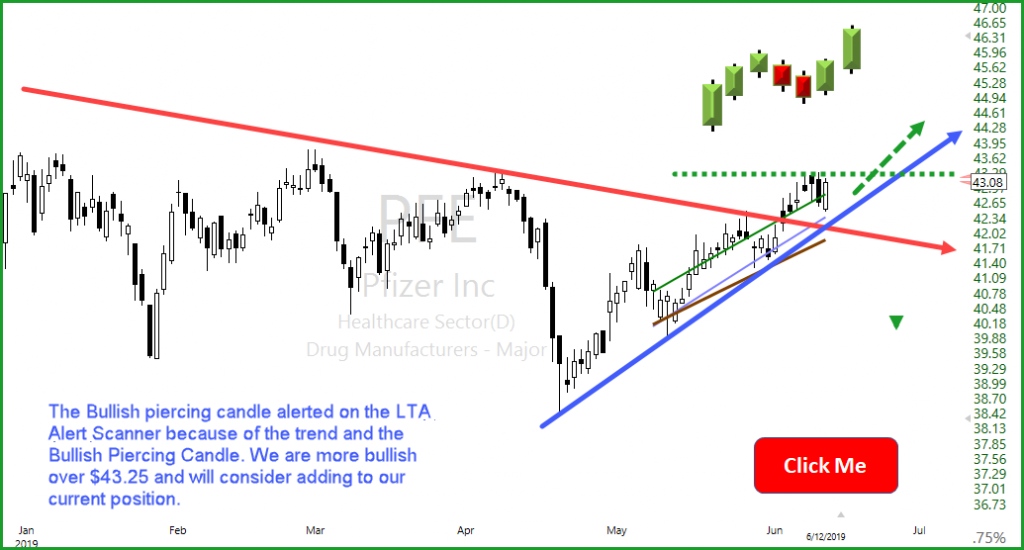
🎯 PFE is one for the watchlist; We did buy it yesterday as it was posting a T-Line Band Alert and a Piercing Candle on the LTA Alert Scanner. (see chart below) An Inside day today and a qualified chart pattern above $43.25. 🍰 The LTA Alert Scanner and 🍰 TC2000 are my tools of choice because they work!. Rick and the HRC Members kick off the trading room starting at 9:10 Eastern when we review the markets, trade ideas, and PFE. Other charts we plan to cover is: TNDN, SNAP, SHOP, PFE, MNST and BABA

✅ A Traders Edge In All Markets

The LTA Scanner can filter out charts that are trending, up or down and alert on charts that have Candlestick signals and patterns, western patterns and when indicators, such as MACD, Stochastics, RSI or Bollinger Bands have crossed or reaches the desired level. Hey, check out the NEW BULL PERFECT TREND ALERT. The right tools for the job.

Acton Plan

  1. ✅ Be patient. Know what you want and be patient
  2. ✅ Always plane your trade out
  3. Use our base hit strategy, sell into strength
  4. Buy close to your stop and support
  5. USE the LTA Trade Alert Scanner to find the winners

We use 2 of The Worlds Best Trading Tools, TC2000 for charting, LTA-Live Trading Alerts for real-time price action, candle and candle patterns, and western patterns. The right tools for the right job.👍

Free YouTube Education  •  Subscription PlansPrivate 2-Hour Coaching

DISCLAIMER: Investing / Trading involves significant financial risk and is not suitable for everyone. No communication from Hit and Run Candlesticks Inc, its affiliates or representatives is not financial or trading advice. All information provided by Hit and Run Candlesticks Inc, its affiliates and representatives are intended for educational purposes only. You are advised to test any new trading approach before implementing it.  Past performance does not guarantee future results.  Terms of Service
CRON Up 32.7%

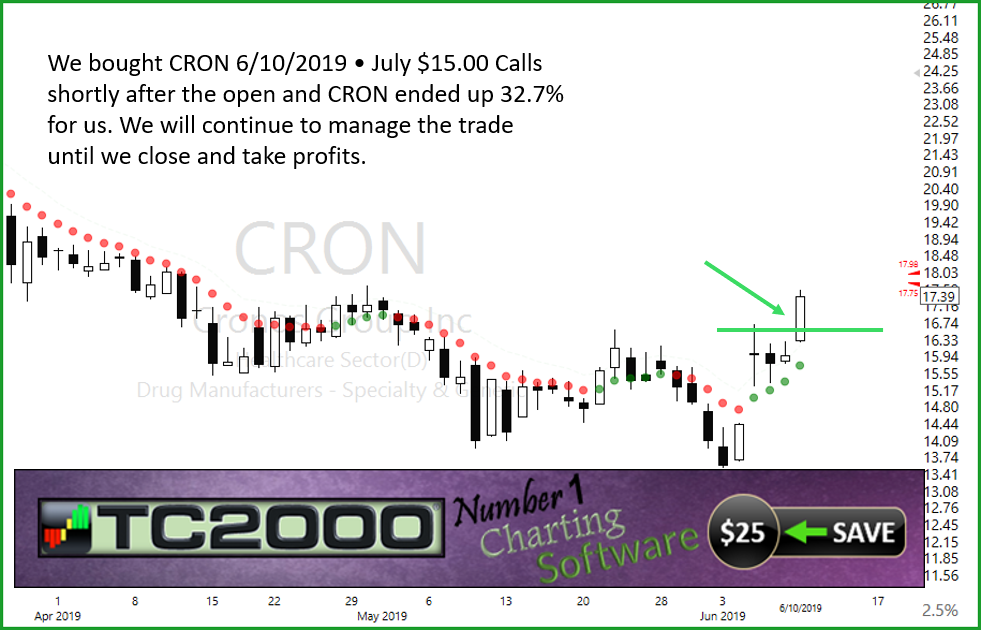
💲 Thank you for reading our blog! Yesterday I posted about CRON and that we were stalking CRON for a trade. We bought CRON soon after the open and when the market closed our 😎 CRON trade was up 32.7%. 👀 The LTA Live Trading Alert Scanner and the Hit and Run family is the best of the best. All buys and closes announced in HRC Live Trading Room, be sure to tune in starting at 9:10 Eastern when I’ll review the markets, trade ideas.

👀 The SPY closed another 1.32% and above the 50-SMA, the 5th day for higher lows and higher highs. In a yesterdays blog post I had written the close is what counts” and over $289.20 would be amazing, well the high was over $289.20, but the close was below and yesterday’s candle was a Shooting Star, A Shooting Star at resistance and after being up five days in a row.  Could the Shouting Star be a warning sign for a little profit taking within a day or two? And let’s think about the 50-SMA, the price has closed and rallied above the 50-SMA without a test as of yet. The only thing I can say is “don’t run with scissors” The VXX is hanging out near a support line, but the price did not close like there was much fear, perhaps the fear comes in a day or two.

👉 CRON popped for us closing up 32.7% in the first day. We will manage the trade based on our rules and what we teach in the trading room.👇

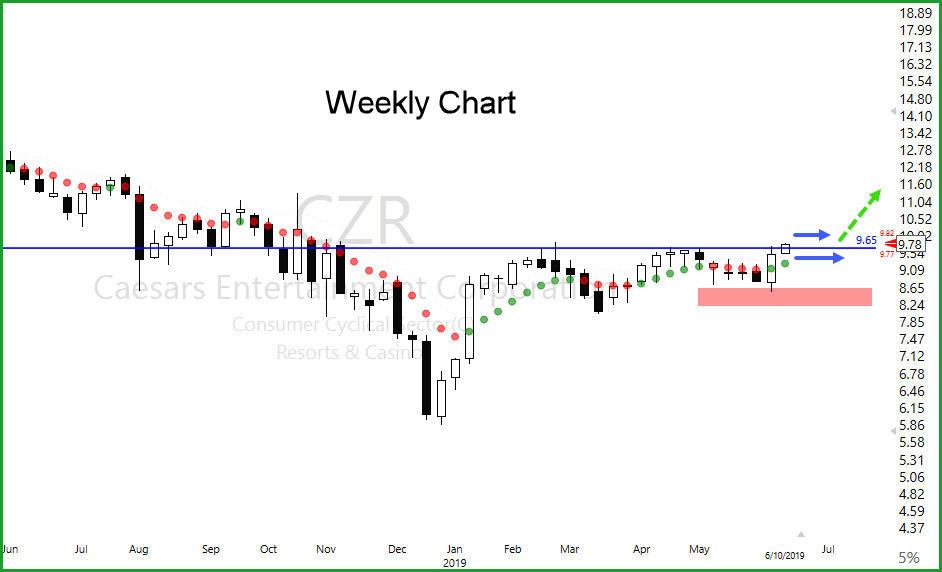
🎯 CZR is another chart we are stalking this week on our watchlist; The weekly chart has constructed a bottom followed by a Bullish Engulf and follow-through over $9.65 with a qualified chart pattern we could be tempted. CZR alerted yesterday on the

#1 Tool in my toolbox “The LTA Live Trading Alert Scanner? Members are sure to be in the trading room about 9:10 Eastern when I review the markets, trade ideas, and CZR. WYNN, KMX, QCOM, ARCC, AIG, ROKU, SMAR are also on our list.

✅ A Traders Edge In All Markets

The LTA Scanner can filter out charts that are trending, up or down and alert on charts that have Candlestick signals and patterns, western patterns and when indicators, such as MACD, Stochastics, RSI or Bollinger Bands have crossed or reaches the desired level. Hey, check out the NEW BULL PERFECT TREND ALERT. The right tools for the job.

Acton Plan

  1. ✅ Trade smart and think about price action
  2. Use our base hit strategy, sell into strength
  3. Buy close to your stop and support
  4. USE the LTA Trade Alert Scanner to find the winners

We use 2 of The Worlds Best Trading Tools, TC2000 for charting, LTA-Live Trading Alerts for real-time price action, candle and candle patterns, and western patterns. The right tools for the right job.👍

Free YouTube Education  •  Subscription PlansPrivate 2-Hour Coaching

DISCLAIMER: Investing / Trading involves significant financial risk and is not suitable for everyone. No communication from Hit and Run Candlesticks Inc, its affiliates or representatives is not financial or trading advice. All information provided by Hit and Run Candlesticks Inc, its affiliates and representatives are intended for educational purposes only. You are advised to test any new trading approach before implementing it.  Past performance does not guarantee future results.  Terms of Service
Profits On MCD

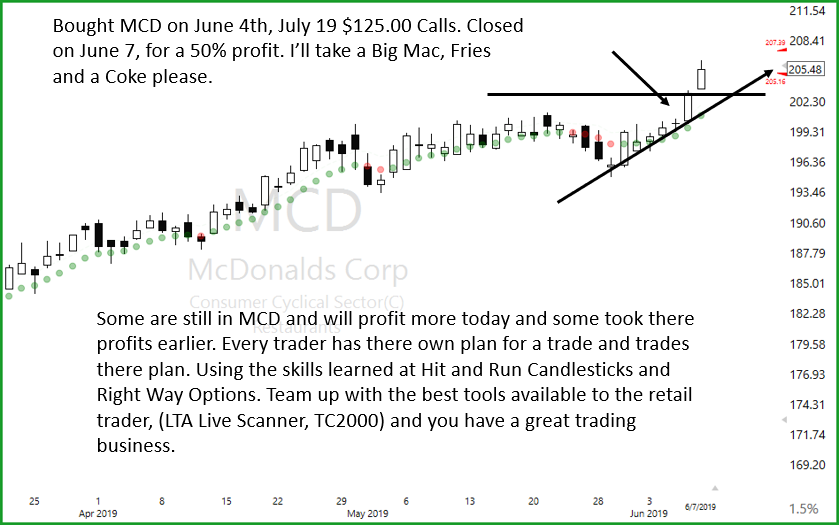
💲 Another great day this past Friday closed out the last ½ of MCD for a 50.9% base hit or $410.00. Knowing how to make sense of a chart, the LTA Live Trading Alert Scanner and the Hit and Run family is the best of the best. All buys and closes announced in HRC Live Trading Room, be sure to tune in starting at 9:10 Eastern when I’ll review the markets, trade ideas.

👀 The Bull did it’s a thing again on Friday, gapping and closing above the 50-SMA followed by four higher closes (AMAZING). We have added a resistance line because of the multiple touches between the buys and sellers at $289.20. There is no question the 👈Bulls have had a great run, and we may even see more of it today, the close is what will count. Over the 50-SMA was major and the bull deserves a rest but not required. A close over $289.20 would be another amazing day, and unfortunately, the FOMO (Fear of Missing Out) sickness will hit many swing traders, let’s not forget the 3-day rule, plan your trades and wait for the trap to work. Price in the VXX 15-Min chart is still trading below the T-Line Red Dots, and the FNGU 15-Min chart is trading above the T-Line Green Dots. At Friday’s close.

👉Bought MCD on June 4th, July 19 $125.00 Calls. Closed on June 7, for a 💲 50% profit. 😎 I’ll take a Big Mac, Fries, and a Coke, please.

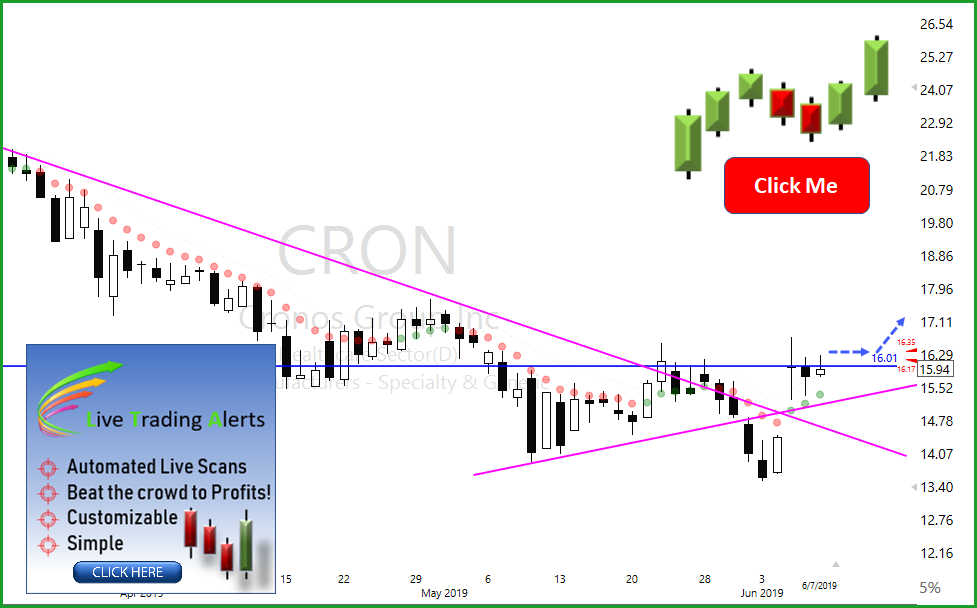
🎯 CRON is one we are stalking this week on our watchlist; If you look at a 3-day chart, you can see the Double Bottom and Bullish Engulf. We are bullish on CRON over $16.00 with a qualified chart pattern. CRON alerted a couple of times last week on the #1 Tool in my toolbox “The LTA Live Trading Alert Scanner? Members are sure to be in the trading room about 9:10 Eastern when I review the markets, trade ideas, and CRON.

Download TC2000 and trade t the T-Line T-Bands, Red/Green Trendicator

A Traders Edge In All Markets

The LTA Scanner can filter out charts that are trending, up or down and alert on charts that have Candlestick signals and patterns, western patterns and when indicators, such as MACD, Stochastics, RSI or Bollinger Bands have crossed or reaches the desired level. Hey, check out the NEW BULL PERFECT TREND ALERT. The right tools for the job.

Acton Plan

  1. Don’t fall into the (FOMO) trap: The Fear of Missing Out
  2. Use our base hit strategy, sell into strength
  3. Buy close to your stop and support
  4. USE the LTA Trade Alert Scanner to find the winners

We use 2 of The Worlds Best Trading Tools, TC2000 for charting, LTA-Live Trading Alerts for real-time price action, candle and candle patterns, and western patterns. The right tools for the right job.👍

Free YouTube Education  •  Subscription PlansPrivate 2-Hour Coaching

DISCLAIMER: Investing / Trading involves significant financial risk and is not suitable for everyone. No communication from Hit and Run Candlesticks Inc, its affiliates or representatives is not financial or trading advice. All information provided by Hit and Run Candlesticks Inc, its affiliates and representatives are intended for educational purposes only. You are advised to test any new trading approach before implementing it.  Past performance does not guarantee future results.  Terms of Service
Friday SPY Nearing 50-SMA

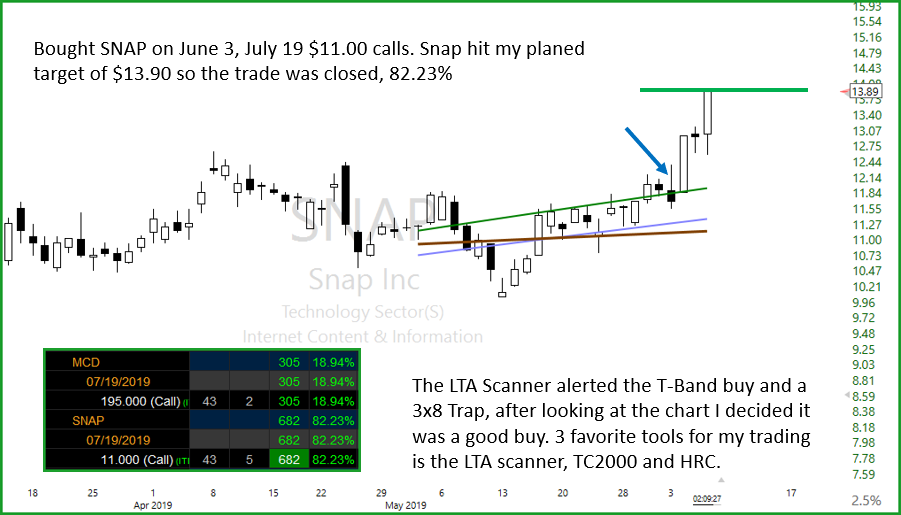
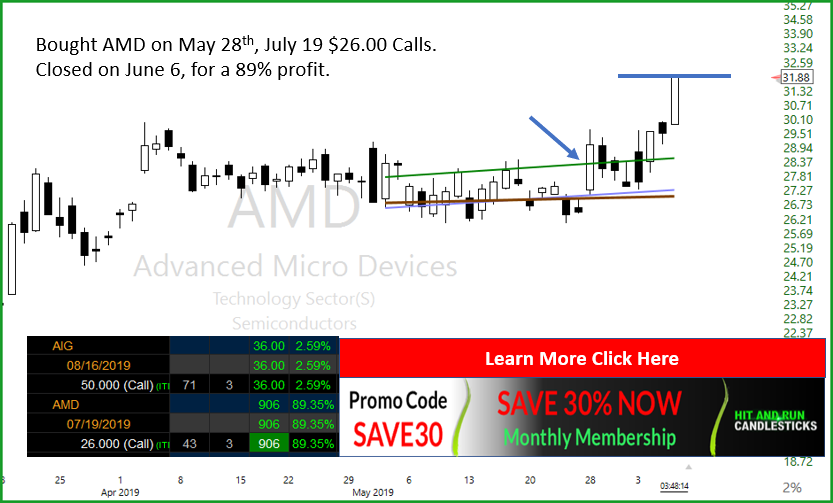
💲 Yesterday 6/6/19 we closed AMD for an 89% win and SNAP for 82% win. AIG has a small gain and MCD we are holding at an 18% gain; we did close ½ MCD yesterday near the close (love the base hits). All buys and closes are announced in HRC Live Trading Room, Be sure to tune in starting at 9:10 Eastern when I’ll review the markets, trade ideas.

Another fine day in the market for Thursday even with the nail biters waiting for the Friday Jobs number. Good or bad? Your guess is a good as mine; we will know after the blog is posted. The SPY weekly chart has printed a near Bullish Engulf. Follow through over $284.80, challenge and win the pin of the 50-day SMA would suggest the bulls are back in town. Anything short of closing over the 50-SMA or a weak candle by the end of the day would but a possible Blue Ice Failure on the table. With as much as the SPY has rallied, you would think a little profit taking would be in order. The VXX pre-market is not giving any clues just yet, and the FNGU (FANG) chart is showing a nice little gap, so much can happen in a day of trading.

👉 The two charts below 👇 are AMD and SNAP both closed yesterday for 89% and 82%. I thought you might find them educational and helpful; please feel free to ask questions about them in the trading room if you like.

🎯 It’s Friday, and I don’t post trade ideas on Friday, but we do cover trades and the market in the trading room starting at 9:10 am “The LTA Live Trading Alert Scanner, and TC2000 are my #1 tools I trade with? Members, be sure to be in the trading room about 👉9:10 Eastern when I review the markets, and your trade ideas.

Download TC2000 and trade t the T-Line T-Bands, Red/Green Trendicator

A Traders Edge In All Markets

The LTA Scanner can filter out charts that are trending, up or down and alert on charts that have Candlestick signals and patterns, western patterns and when indicators, such as MACD, Stochastics, RSI or Bollinger Bands have crossed or reaches the desired level. Hey, check out the NEW BULL PERFECT TREND ALERT. The right tools for the job.

6/7/2019 Acton Plan

  1. Friday is payday, clean up the dead wood and count your money
  2. Use our base hit strategy, sell into strength
  3. Grow rich trading base hits
  4. USE the LTA Trade Alert Scanner to find the winners

We use 2 of The Worlds Best Trading Tools, TC2000 for charting, LTA-Live Trading Alerts for real-time price action, candle and candle patterns, and western patterns. The right tools for the right job.👍

Free YouTube Education  •  Subscription PlansPrivate 2-Hour Coaching

DISCLAIMER: Investing / Trading involves significant financial risk and is not suitable for everyone. No communication from Hit and Run Candlesticks Inc, its affiliates or representatives is not financial or trading advice. All information provided by Hit and Run Candlesticks Inc, its affiliates and representatives are intended for educational purposes only. You are advised to test any new trading approach before implementing it.  Past performance does not guarantee future results.  Terms of Service

AIG Morning Star Sweet Spot

Yesterday 6/5/19 we closed BABA for a small loss and 💲 closed KO for 50% profit a good day all in all AIG, AMD, and SNAP held well into yesterdays close. We will monitor them carefully. We also picked up a little MCD near the close yesterday. All buys and closes are announced in HRC Live Trading Room Be sure to tune in starting at 9:10 Eastern when I’ll review the markets, trade ideas.

The SPY had another Bullish day yesterday trying to defy gravity (don’t bet on that for too long we are very overextended) We had a target line drawn for the SPY and missed it by .01. The number for the bulls to beat now is $284.20, followed by a $285.70. I would expect a little profit taking and backfilling before these numbers can be challenged. On a profit-taking pullback, I will be using $278.90 as support. The VXX is a little active this morning, and I did discuss the VXX and the intraday candles yesterday near the close in the HRC Trading Room.

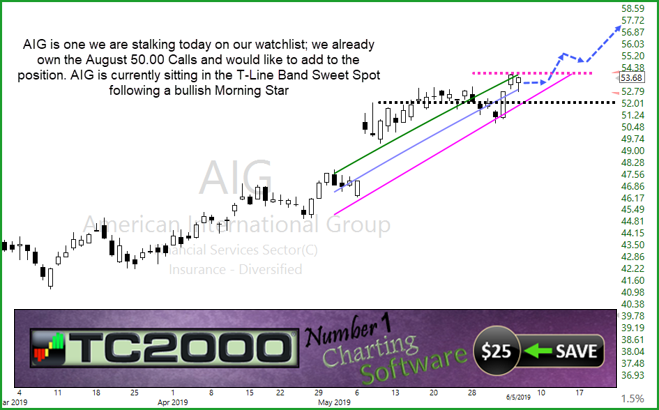
🎯 AIG is one we are stalking today on our watchlist; we already own the August 50.00 Calls and would like to add to the position. AIG is currently sitting in the T-Line Band Sweet Spot following a bullish Morning Star Signal. AIG also has been alerting on the #1 Tool in my toolbox “The LTA Live Trading Alert Scanner?

Members, be sure to be in the trading room about 9:10 Eastern when I review the markets, trade ideas, and AIG, SPWR, ROKU, SHOP, OKTA, CSX, HON, SNAP, CRON

A Traders Edge In All Markets

The LTA Scanner can filter out charts that are trending, up or down and alert on charts that have Candlestick signals and patterns, western patterns and when indicators, such as MACD, Stochastics, RSI or Bollinger Bands have crossed or reaches the desired level. Hey, check out the NEW BULL PERFECT TREND ALERT. The right tools for the job.

6/6/2019 Acton Plan

  1. Monitor the VXX for signs of fear
  2. Use our base hit strategy, sell into strength
  3. Grow rich trading base hits
  4. USE the LTA Trade Alert Scanner to find the winners

We use 2 of The Worlds Best Trading Tools, TC2000 for charting, LTA-Live Trading Alerts for real-time price action, candle and candle patterns, and western patterns. The right tools for the right job.👍

Free YouTube Education  •  Subscription PlansPrivate 2-Hour Coaching

DISCLAIMER: Investing / Trading involves significant financial risk and is not suitable for everyone. No communication from Hit and Run Candlesticks Inc, its affiliates or representatives is not financial or trading advice. All information provided by Hit and Run Candlesticks Inc, its affiliates and representatives are intended for educational purposes only. You are advised to test any new trading approach before implementing it.  Past performance does not guarantee future results.  Terms of Service
ROKU 3×8 Trap Setup

Yesterday 6/4/19 we closed ½ of SNAP for a sweet 27% base hit as the market began to draw to an end. We also picked up a little BABA ending the day up 11% based on the 60-min chart and an (RBB) Rounded Bottom Breakout. AIG and KO and AMD are doing fine and holding well.

POW! What a great day yesterday, price action took out our $280.10 line and pre-market today have already tagged our $282.50 line. Yesterday’s price action as great as it was, the SPY chart is still in a downtrend. When price closed over the downtrend line and constructed a bottom we will have a ton of nice long charts to choose from, but first thing first. The bulls will need to challenge the $283.00 line followed by $286.00. By following the 3×8 Trap, you will be able to see when the 3-EMA is above the T-Line, that will be a sign the SPY is in a bullish direction. At the close of yesterday, the trend is still down.

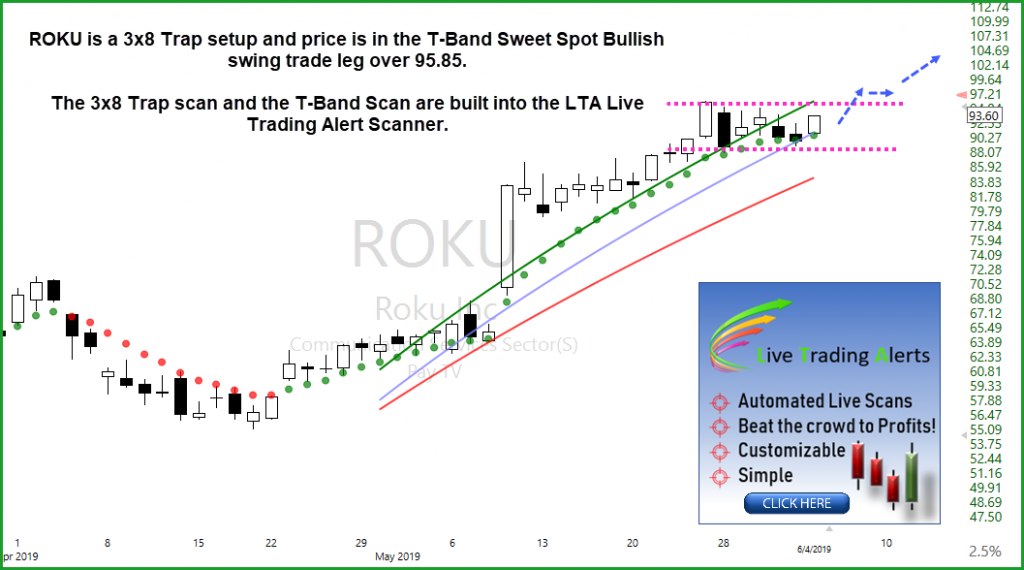
🎯 ROKU is one we are stalking today on our watchlist, ROKU is in a T-Line Run and yesterday was triggering on the LTA Scanner as a 3×8 Trap, and the LTA T-Line Band alert was going off “Sweet Spot-Sweet-Spot.” Members, be sure to be in the trading room about 9:10 Eastern when I’ll review the markets, trade ideas, and ROKU. More trade Ideas we will consider FSLR, CECE, LMT, AIG.

A Traders Edge In All Markets

The LTA Scanner can filter out charts that are trending, up or down and alert on charts that have Candlestick signals and patterns, western patterns and when indicators, such as MACD, Stochastics, RSI or Bollinger Bands have crossed or reaches the desired level. Hey, check out the NEW BULL PERFECT TREND ALERT. The right tools for the job.

6/5/2019 Acton Plan

  1. Plan relief rally trades
  2. Use our base hit strategy
  3. Fight the urge to predict a bottom
  4. Grow rich trading base hits
HRC Monthly service only $110 with this promo code: SAVE50

We use 2 of The Worlds Best Trading Tools, TC2000 for charting, LTA-Live Trading Alerts for real-time price action, candle and candle patterns, and western patterns. The right tools for the right job.👍

Free YouTube Education  •  Subscription PlansPrivate 2-Hour Coaching

DISCLAIMER: Investing / Trading involves significant financial risk and is not suitable for everyone. No communication from Hit and Run Candlesticks Inc, its affiliates or representatives is not financial or trading advice. All information provided by Hit and Run Candlesticks Inc, its affiliates and representatives are intended for educational purposes only. You are advised to test any new trading approach before implementing it.  Past performance does not guarantee future results.  Terms of Service