IPXL – Bullish Continuation Pattern

IPXL – Bullish Continuation Pattern

IPXL – Bullish Continuation Pattern IPXL (Impax Laboratories Inc.) IPXL Has been trending and now has produced a Bullish Continuation Pattern. Commonly called a J-Hook. IPXL popped off the 34-EMA on big volume and consolidating Bullishly ever since. Yesterdays candle (price action) was a clue that the Bulls are starting to take notice again Good Trading – Hit and Run Candlesticks Learn more about Hit and Run Candlesticks, and today's trade idea and plan plus the 10 or more members trade ideas, starting at 8:45 EST AM every morning with the HOG and then Rick at 9:10 EST. Every day we teach and trade using the T-Line, Candlesticks, Support and Resistance, Trends, chart patterns and continuation patterns.  ►Trade Updates – Hit and Run Candlesticks  Friday we took on a new long, and by the end of the day we are up 5.88% (Love it) Are you having trouble putting together a winning trade? Not sure what scans to use? So near to having multiple winning trades, but something always goes wrong. Maybe a couple hours with a trading coach could make all the difference in the world. Hit and Run Candlesticks has 4 trading coaches – Learn More about the Coaches With on-demand recorded webinars, eBooks, and videos, member and non-member eLearning, plus the Live Trading Rooms, there is no end your trading education here at the Hit and Run Candlesticks, Right Way Options, Strategic Swing Trade Service and Trader Vision.  ► CONN - You would be up about 7.82% or $170.00  If you bought 100 shares when we posted to our members on September 8. Hit and Run Candlesticks members practice trade management and trade planning with Price and Candlesticks, The T-line, Trend, Trend Lines, Chart Patterns, Support, and Resistance.   
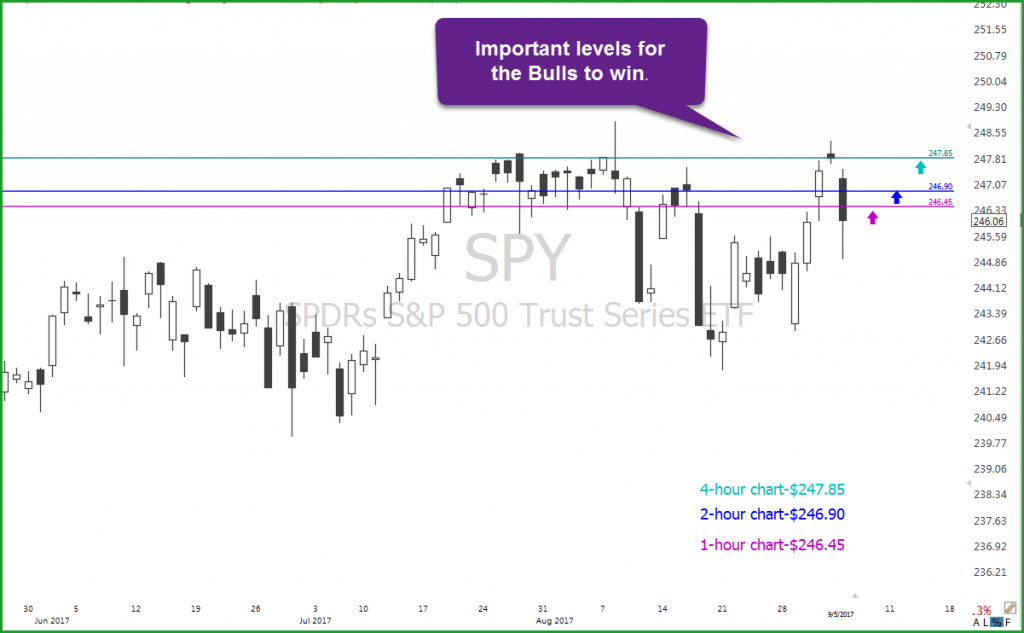
► Eyes On The Market (SPY)  WOW! What a day yesterday and a very nice Bullish Cup has formed. The Bulls put the Bears in their place yesterday with a gap and follow through on good volume. The T-Line has turned up and is up over its past 20-days. Continuation patterns will be the money making patterns to trade with IMHO ► What is a Trade Idea Watch-list? A trade idea watchlist is a list of stocks that we feel will move in our desired direction over a swing trader's time frame.  That time could be one to 15 days for example. From that watch list, we wait until price action meets our conditions for a trade. Rick’s personal trade ideas for the day MEMBERS ONLY  Start your education with wealth and the rewards of a Swing Traders Life – Click Here.  Investing and Trading involve significant financial risk and are not suitable for everyone. No communication from Hit and Run Candlesticks Inc. is financial or trading advice. All information is intended for Educational Purposes Only. Terms of Service.  Rick Saddler is not a licensed financial adviser nor does he offer trade recommendations or advice to anyone except for the trading desk of Hit and Run Candlesticks Inc.IPXL (Impax Laboratories Inc.) IPXL Has been trending and now has produced a Bullish Continuation Pattern. Commonly called a J-Hook. IPXL popped off the 34-EMA on big volume and consolidating Bullishly ever since. Yesterdays candle (price action) was a clue that the Bulls are starting to take notice again

Good Trading – Hit and Run Candlesticks

Learn more about Hit and Run Candlesticks, and today’s trade idea and plan plus the 10 or more members trade ideas, starting at 8:45 EST AM every morning with the HOG and then Rick at 9:10 EST. Every day we teach and trade using the T-Line, Candlesticks, Support and Resistance, Trends, chart patterns and continuation patterns.

Trade Updates – Hit and Run Candlesticks

Friday we took on a new long, and by the end of the day we are up 5.88% (Love it)

Are you having trouble putting together a winning trade? Not sure what scans to use? So near to having multiple winning trades, but something always goes wrong. Maybe a couple hours with a trading coach could make all the difference in the world. Hit and Run Candlesticks has 4 trading coachesLearn More about the Coaches

With on-demand recorded webinars, eBooks, and videos, member and non-member eLearning, plus the Live Trading Rooms, there is no end your trading education here at the Hit and Run Candlesticks, Right Way Options, Strategic Swing Trade Service and Trader Vision.

Click Here - Try Us Out 3-Months


CONN - You would be up about 7.82% or $170.00

If you bought 100 shares when we posted to our members on September 8. Hit and Run Candlesticks members practice trade management and trade planning with Price and Candlesticks, The T-line, Trend, Trend Lines, Chart Patterns, Support, and Resistance.


Eyes On The Market (SPY)

WOW! What a day yesterday and a very nice Bullish Cup has formed. The Bulls put the Bears in their place yesterday with a gap and follow through on good volume. The T-Line has turned up and is up over its past 20-days. Continuation patterns will be the money making patterns to trade with IMHO

What is a Trade Idea Watch-list?

A trade idea watchlist is a list of stocks that we feel will move in our desired direction over a swing trader's time frame.  That time could be one to 15 days for example. From that watch list, we wait until price action meets our conditions for a trade.

Rick’s personal trade ideas for the day MEMBERS ONLY

Start your education with wealth and the rewards of a Swing Traders Life – Click Here.


Investing and Trading involve significant financial risk and are not suitable for everyone. No communication from Hit and Run Candlesticks Inc. is financial or trading advice. All information is intended for Educational Purposes Only. Terms of Service.

Rick Saddler is not a licensed financial adviser nor does he offer trade recommendations or advice to anyone except for the trading desk of Hit and Run Candlesticks Inc.


YRCW – Bullish PBO With The T-Line

YRCW – Bullish PBO With The T-Line

YRCW – Bullish PBO With The T-LineYRCW (YRC Worldwide Inc. After pulling back to major moving average support price rallied and now a Bullish PBO with the T-Line. The T-Line is near price action support, and the pullback has not been aggressive.  YRCW is a perfect candidate for the planned trade watch list.

Let’s all take a moment for our trading friends in Florida, Texas and the events of September 11, 2011

Learn more about Hit and Run Candlesticks, and today’s trade idea and plan plus the 10 or more members trade ideas, starting at 8:45 EST AM every morning with the HOG and then Rick at 9:10 EST. Every day we teach and trade using the T-Line, Candlesticks, Support and Resistance, Trends, chart patterns and continuation patterns.

Trade Updates – Hit and Run Candlesticks

Friday we took on a new long, and by the end of the day we are up 5.88% (Love it)

Are you having trouble putting together a winning trade? Not sure what scans to use? So near to having multiple winning trades, but something always goes wrong. Maybe a couple hours with a trading coach could make all the difference in the world. Hit and Run Candlesticks has 4 trading coachesLearn More about the Coaches

With on-demand recorded webinars, eBooks, and videos, member and non-member eLearning, plus the Live Trading Rooms, there is no end your trading education here at the Hit and Run Candlesticks, Right Way Options, Strategic Swing Trade Service and Trader Vision.


ARWR – You would be up about 69.2% or $127.00

If you bought 100 shares when we posted to our members on August 7. Hit and Run Candlesticks members practice trade management and trade planning with Price and Candlesticks, The T-line, Trend, Trend Lines, Chart Patterns, Support, and Resistance.


Eyes On The Market (SPY)

On the SPY price formed a Doji on the T-Line. The last 8 bars created a Bullish Run and a Bullish Pullback. $247.30 will be a number the Bulls want to beat and hold this week. Above $246.30 the Bulls will have the ability to advance and test the Highs. Note the 34-EMA is trending in a Bullish fashion.  There is no doubt we have to trade with volatility and chop.  Just remember you are the boss, you make the trade choices and rules.

What is a Trade Idea Watch-list?

A trade idea watchlist is a list of stocks that we feel will move in our desired direction over a swing trader’s time frame.  That time could be one to 15 days for example. From that watch list, we wait until price action meets our conditions for a trade.

Rick’s personal trade ideas for the day MEMBERS ONLY

Start your education with wealth and the rewards of a Swing Traders Life – Click Here.


Investing and Trading involve significant financial risk and are not suitable for everyone. No communication from Hit and Run Candlesticks Inc. is financial or trading advice. All information is intended for Educational Purposes Only. Terms of Service.

Rick Saddler is not a licensed financial adviser nor does he offer trade recommendations or advice to anyone except for the trading desk of Hit and Run Candlesticks Inc.


YNDX Is Forming A Bullish J-Hook Pattern

YNDX Is Forming A Bullish J-Hook Pattern

YNDX Is Forming A Bullish J-Hook PatternYNDX (Yandex N.V.) Is forming a Bullish J-Hook Pattern with the big September 1 candle followed by the lower highs then a higher high. The 34-EMA has maintained its trend after price gapped on July 13 and went crazy all over the place. The organization seems to be coming back in with the last 7 bars. Take a look at the 2-3-4-5 day charts.

Good Trading – Hit and Run Candlesticks

Learn more about Hit and Run Candlesticks, and today’s trade idea and plan plus the 10 or more members trade ideas, starting at 8:45 EST AM every morning with the HOG and then Rick at 9:10 EST. Every day we teach and trade using the T-Line, Candlesticks, Support and Resistance, Trends, chart patterns and continuation patterns.

Trade Updates – Hit and Run Candlesticks

No changes from yesterday.

3 Full Months • Learn and Earn $212.50 • Learn to trade from the best


Full 100% 3-month membership to Hit and Run Candlesticks for $212.50 (Only $70.83 per month) Take what you learn and turn it into extra income or work from home and enjoy the lifestyle while earning an income and creating wealth. Hey, we post charts that thousands make their entire subscription fee back the first day.

Are you having trouble putting together a winning trade? Not sure what scans to use? So near to having multiple winning trades, but something always goes wrong. Maybe a couple hours with a trading coach could make all the difference in the world. Hit and Run Candlesticks has 4 trading coachesLearn More about the Coaches

With on-demand recorded webinars, eBooks, and videos, member and non-member eLearning, plus the Live Trading Rooms, there is no end your trading education here at the Hit and Run Candlesticks, Right Way Options, Strategic Swing Trade Service and Trader Vision.


NLNK - You would be up about 74.58% or $581.00

If you bought 100 shares when we posted to our members on September 7. Hit and Run Candlesticks members practice trade management and trade planning with Price and Candlesticks, The T-line, Trend, Trend Lines, Chart Patterns, Support, and Resistance.


Eyes On The Market (SPY)

Price and the T-Line – The T-Line (8-EMA) has been one of the most important tools in my trading tool box for a long time. And to this day it’s the only rival is price action itself. To keep this short; The T-Line will hold the lows (support) on a Bullish chart only giving way for very short periods of time or the time it takes to create a pattern. The same can be said for the Bearish side. I will ask myself, what is price doing compared to the T-Line and what is the T-Line doing compared to Price?  Another little tool I use along with the T-Line is the 34-EMA when using the 2 moving averages together, you can get an idea whether the leader is the Bull or the Bear or even the wondering weezel.

What is a Trade Idea Watch-list?

A trade idea watchlist is a list of stocks that we feel will move in our desired direction over a swing trader's time frame.  That time could be one to 15 days for example. From that watch list, we wait until price action meets our conditions for a trade.

Rick’s personal trade ideas for the day MEMBERS ONLY

Start with 3-months, see and feel the rewards of a Swing Traders Life – Click Here.

Investing and Trading involve significant financial risk and are not suitable for everyone. No communication from Hit and Run Candlesticks Inc. is financial or trading advice. All information is intended for Educational Purposes Only. Terms of Service.

Rick Saddler is not a licensed financial adviser nor does he offer trade recommendations or advice to anyone except for the trading desk of Hit and Run Candlesticks Inc.


ZUMZ Printed A Bullish Engulf Reversal Pattern

ZUMZ Printed A Bullish Engulf Reversal Pattern

ZUMZ Printed A Bullish Engulf Reversal PatternZUMZ (Zombies Inc) Printed a Bullish Morning Star reversal pattern that ran for a couple of days before pulling back to a (PBO) Pull Back Opportunity. Also a J-Hook continuation pattern in our Rounded Bottom Breakout pattern/strategy? Over $13.40 I see a couple 15% swing trades if planned and traded correctly.

Good Trading – Hit and Run Candlesticks

Learn more about Hit and Run Candlesticks, and today’s trade idea and plan plus the 10 or more members trade ideas, starting at 8:45 EST AM every morning with the HOG and then Rick at 9:10 EST. Every day we teach and trade using the T-Line, Candlesticks, Support and Resistance, Trends, chart patterns and continuation patterns.

Trade Updates – Hit and Run Candlesticks

No trades the last few days due to pers

onal reasons, but we are still holding. IDXG for 18.65% and MNKD up 16.60% and X

up 13.4% for a cool $3955.00

Full 100% 3-month membership to Hit and Run Candlesticks for $212.50 (Only $70.83 per month)Click Here To Get Started

Take what you learn and turn it into extra income or work from home and enjoy the lifestyle while earning an income and creating wealth. Hey, we post charts that thousands make their entire subscription fee back the first day.

Are you having trouble putting together a winning trade? Not sure what scans to use? So near to having multiple winning trades, but something always goes wrong. Maybe a couple hours with a trading coach could make all the difference in the world. Hit and Run Candlesticks has 4 trading coachesLearn More about the Coaches

With on-demand recorded webinars, eBooks, and videos, member and non-member

eLearning, plus the Live Trading Rooms, there is no end your trading education here at the Hit and Run Candlesticks, Right Way Options, Strategic Swing Trade Service and Trader Vision.


DVAX - You would be up about 323% or $11,640.00

If you bought 100 shares when we posted to our members on May 30. Holding it or trading it or swing trading it several times. Hit and Run Candlesticks members practice trade management and trade planning with Price and Candlesticks, The T-line, Trend, Trend Lines, Chart Patterns, Support, and Resistance.


Eyes On The Market (SPY)

The SPY is coming out of its August 21 low with a Low High – Higher Low and A Higher High pattern with The T-Line back over the 34-ema. A solid Belthold on August 29 leads this recent run. The current evidence indicates the Bulls are doing the driving. Driving a bit crazy …yes! Choppy and no real conviction but they are driving. Yesterday I posted a chart of the SPY with 3 numbers that were important for the Bulls to win over. (You can see

this on yesterday’s Trade Idea blog).


What is a Trade Idea Watch-list?

A trade idea watchlist is a list of stocks that we feel will move in our desired direction over a swing trader's time frame.  That time could be one to 15 days for example. From that watch list, we wait until price action meets our conditions for a trade.

Rick’s personal trade ideas for the day MEMBERS ONLY

Start your education with wealth and the rewards of a Swing Traders Life – Click Here.


Investing and Trading involve significant financial risk and are not suitable for everyone. No communication from Hit and Run Candlesticks Inc. is financial or trading advice. All information is intended for Educational Purposes Only. Terms of Service.

Rick Saddler is not a licensed financial adviser nor does he offer trade recommendations or advice to anyone except for the trading desk of Hit and Run Candlesticks Inc.


Sorry Another day without Trade Ideas

Sorry Another day without Trade Ideas

My little visit with the surgeon went well, but it will take another day before I can do any stock picking, mostly because of the stupid pills they have me on. I have posted a chart below of the Daily SPY with lines and markers of critical levels for the Bulls to win.  Trade Your Money Smart!

What is your favorite chart pattern?

What is your favorite chart pattern?

(It’s Friday) What is your favorite chart pattern? Why? Can you explain it? Or is it just your favorite because others use it? I am very serious, if you are trading a pattern or a strategy can you truly explain it, in words to someone else, not just in your head and to yourself. Give it a try..the better you get at it, the better trader you will become.

A personal trade plan is essential to trading wealth and Fridays are a good day to evaluate your trade plan. Do you have a 12-month goal? Do you know how much per trade, per week so you need to meet the 12-month goal? Do you know what trade set ups are best for you? We have found from our coaching that those that live by a trade plan profit more money and have a much higher success rate of increasing their wealth.

Friday is the day we count our money and reflect on our weeks trading. How did we do? How can we improve? Take time today to pause on trading and consider education. Reevaluate your trading goals, are your goals on track?

Good Trading – Hit and Run Candlesticks


Learn more about Hit and Run Candlesticks, and today’s trade idea and plan plus the 10 or more members trade ideas, starting at 9:10 EST AM every morning. Every day we teach and trade using the T-Line, Candlesticks, Support and Resistance, Trends, chart patterns and continuation patterns.


►Trade  Updates – Hit and Run Candlesticks –We closed ½ of our MNKD trade for 25.29%

FACT ◙ The More You Learn The More You Earn ◙ 3-Month HRC Membership $212.50 ◙ Cancel Any TimeCLICK ON ME


Are you having trouble putting together a winning trade? Not sure what scans to use? So near to having multiple winning trades, but something always goes wrong. Maybe a couple hours with a trading coach could make all the difference in the world. Hit and Run Candlesticks has 4 trading coachesLearn More about the Coaches

With on-demand recorded webinars, eBooks, and videos, member and non-member eLearning, plus the Live Trading Rooms, there is no end your trading education here at the Hit and Run Candlesticks, Right Way Options, Strategic Swing Trade Service and Trader Vision.


Eyes on The Market

The SPY has had a great 3 days of Bullishness, the T-Line is back over the 34-EMA and a Bullish breakout is very possible. But I suspect we will need a little pullback and a new running start. The Reversal pattern on the SPY is a work of are; Low, High, Higher Low, Belthold, Bullish follow through.

What is a Trade Idea Watch-list?

A trade idea watchlist is a list of stocks that we feel will move in our desired direction over a swing trader's time frame.  That time could be one to 15 days for example. From that watch list, we wait until price action meets our conditions for a trade.

Rick’s personal trade ideas for the day MEMBERS ONLY

Start your education with wealth and the rewards of a Swing Traders Life – Click Here


Investing and Trading involve significant financial risk and are not suitable for everyone. No communication from Hit and Run Candlesticks Inc. is financial or trading advice. All information is intended for Educational Purposes Only. Terms of Service.

Rick Saddler is not a licensed financial adviser nor does he offer trade recommendations or advice to anyone except for the trading desk of Hit and Run Candlesticks Inc.


Bullish Morning Star Shows Bullish Follow Through

Bullish Morning Star Shows Bullish Follow Through

Bullish Morning Star Shows Bullish Follow Through CHRS (Coherus BioScience) has printed a double bottom with a Bullish Morning Star that is showing Bullish follow through. Price has pulled back from a Shooting Star to test the 50-SMA it Bullishly broke through. Today we are looking at a Pop Out of the Box within a Rounded Bottom Breakout.

Good Trading – Hit and Run Candlesticks

Learn more about Hit and Run Candlesticks, and today’s trade idea and plan plus the 10 or more members trade ideas, starting at 8:45 EST AM every morning with the HOG and then Rick at 9:10 EST. Every day we teach and trade using the T-Line, Candlesticks, Support and Resistance, Trends, chart patterns and continuation patterns.

Trade Updates – Hit and Run Candlesticks

We added 1 new long yesterday and closed out AMZN short for a profit and closed our TVIX for a 3.6% loss.


Full 100% 3-month membership to Hit and Run Candlesticks for $212.50 (Only $70.83 per month) Take what you learn and turn it into extra income or work from home and enjoy the lifestyle while earning an income and creating wealth. Hey, we post charts that thousands make their entire subscription fee back the first day.3-Months $212.50 Cancel Anytime


Are you having trouble putting together a winning trade? Not sure what scans to use? So near to having multiple winning trades, but something always goes wrong. Maybe a couple hours with a trading coach could make all the difference in the world. Hit and Run Candlesticks has 4 trading coachesLearn More about the Coaches

With on-demand recorded webinars, eBooks, and videos, member and non-member eLearning, plus the Live Trading Rooms, there is no end your trading education here at the Hit and Run Candlesticks, Right Way Options, Strategic Swing Trade Service and Trader Vision.


GRUB - You would be up 28.43% or $1246.00

If you bought 100 shares when we posted to our members on May 30. Hit and Run Candlesticks members practice trade management and trade planning with Price and Candlesticks, The T-line, Trend, Trend Lines, Chart Patterns, Support, and Resistance.


Eyes On The Market (SPY)

Yesterday, Wednesday, August 31, the Bulls were in the mood to run over a few Bears. The Bullish Belthold had great follow through which led to a close over the big 3 moving averages and the $245.60 line. There are still traps the Bull can fall into before a new breakout so trade wise. Listen to what price is telling you.

What is a Trade Idea Watch-list?

A trade idea watchlist is a list of stocks that we feel will move in our desired direction over a swing trader's time frame.  That time could be one to 15 days for example. From that watch list, we wait until price action meets our conditions for a trade.

Rick’s personal trade ideas for the day MEMBERS ONLY

Start your education with wealth and the rewards of a Swing Traders Life – Click Here.


Investing and Trading involve significant financial risk and are not suitable for everyone. No communication from Hit and Run Candlesticks Inc. is financial or trading advice. All information is intended for Educational Purposes Only. Terms of Service.

Rick Saddler is not a licensed financial adviser nor does he offer trade recommendations or advice to anyone except for the trading desk of Hit and Run Candlesticks Inc.


Technical Difficulties

Technical Difficulties

Please except our apologies we are experiencing technical problems causing us not to get any of our trade ideas sent out.

Good Trading – Hit and Run Candlesticks

Learn more about Hit and Run Candlesticks, and today’s trade idea and plan plus the 10 or more members trade ideas, starting at 9:10 EST AM every morning. Every day we teach and trade using the T-Line, Candlesticks, Support and Resistance, Trends, chart patterns and continuation patterns.

Trade Updates – Hit and Run Candlesticks

We sold the second ½ of JNUG for a 19.03% profit – I love my job! We also bought MNKD; yesterdays featured trade idea.

We are offering a Full 100% 3-month membership to Hit and Run Candlesticks for $212.50 (Only $70.83 per month) Take what you learn and turn it into extra income or work from home and enjoy the lifestyle while earning an income and creating wealth. Hey, we post charts that thousands make their entire subscription fee back the first day.Swing Trading -Learn More


Are you having trouble putting together a winning trade? Not sure what scans to use? So near to having multiple winning trades, but something always goes wrong. Maybe a couple hours with a trading coach could make all the difference in the world. Hit and Run Candlesticks has 4 trading coachesLearn More about the Coaches

With on-demand recorded webinars, eBooks, and videos, member and non-member eLearning, plus the Live Trading Rooms, there is no end your trading education here at the Hit and Run Candlesticks, Right Way Options, Strategic Swing Trade Service and Trader Vision.


ALRM - You would be up 9% or $369.00

If you bought 100 shares when we posted to our members on August 14. Hit and Run Candlesticks members practice trade management and trade planning with Price and Candlesticks, The T-line, Trend, Trend Lines, Chart Patterns, Support, and Resistance.


Eyes On The Market (SPY)

Yesterday, Tuesday, August 29, the Bulls found themselves holding the cards and pretty much op

ened a can whoop-ass on the bears. Closing yesterday with a Bullish Belt Hold above the 50-SMA.  So what’s next? Well, the Bull needs to show strength (follow through) sooner rather than later. Yesterday’s Belthold does not change trading 101; price still needs to close over the resistant line $245.45. I did lower it because of the chart pattern.


What is a Trade Idea Watch-list?

A trade idea watchlist is a list of stocks that we feel will move in our desired direction over a swing trader's time frame.  That time could be one to 15 days for example. From that watch list, we wait until price action meets our conditions for a trade.

Rick’s personal trade ideas for the day MEMBERS ONLY

Start your education with wealth and the rewards of a Swing Traders Life – Click Here.


Investing and Trading involve significant financial risk and are not suitable for everyone. No communication from Hit and Run Candlesticks Inc. is financial or trading advice. All information is intended for Educational Purposes Only. Terms of Service.

Rick Saddler is not a licensed financial adviser nor does he offer trade recommendations or advice to anyone except for the trading desk of Hit and Run Candlesticks Inc.


Shorting The Blue Ice

Shorting The Blue Ice

In tonight’s e-Learning 8-29-2017 we will discuss the current state of the market, and Finding and trading the Blue Ice Short from the 50-SMA to the 200-SMA.

The recipe for a winning trade is to follow your plan and the best tools for you. We feel a few of the best tools are: Price Action, Candlesticks, Support and Resistance, Trend Lines, Chart Patterns.

Thank you, Ed Carter

For taking an idea and making it work. Ed created a PCF scan for TC2000 that I have been using to narrow my search and look for a specific chart pattern. Sorry, it’s not the Golden Goose, you still have to do the work.

Shorting The Blue Ice – TC2000 Code

This scan looks for a stock that has failed the Blue Ice (50-SMA) with the idea of follow through to the 200-SMA. Note there is a high probability of minor relief rallies.

ABS(XAVGC8 – AVGC200) / XAVGC8 > .10 AND

C > AVGC200 AND

C < AVGC50 AND

C > 10 AND

( (H5 > AVGC50.5) OR

(H4 > AVGC50.4) OR

(H3 > AVGC50.3) OR

(H2 > AVGC50.2) OR

(H1 > AVGC50.1) )

►Shorting The Blue Ice – TOS Code

#Blue Ice Failure 

Written by Rick Saddler 

Converted to TOS by Ed Carter 

def XAVGC8 = ExpAverage(close, 8); 

def AVGC50 = Average(close, 50); 

def AVGC200 = Average(close, 200); 

def C = close; 

def H = high; 

plot BlueIceFail = ( 

AbsValue(XAVGC8 – AVGC200) / XAVGC8 > .10 and 

C > AVGC200 and 

C < AVGC50 and 

C > 10 and 

( (H[5] > AVGC50[5]) or 

  (H[4] > AVGC50[4]) or 

  (H[3] > AVGC50[3]) or 

  (H[2] > AVGC50[2]) or 

  (H[1] > AVGC50[1] )) 

); 

Are you having trouble putting together a winning trade? Not sure what scans to use? So near to having multiple winning trades, but something always goes wrong. Maybe a couple hours with a trading coach could make all the difference in the world. Hit and Run Candlesticks has 4 trading coachesLearn More about the Coaches

With on-demand recorded webinars, eBooks, and videos, member and non-member eLearning, plus the Live Trading Rooms, there is no end your trading education here at the Hit and Run Candlesticks, Right Way Options, Strategic Swing Trade Service and Trader Vision.


Investing and Trading involve significant financial risk and are not suitable for everyone. No communication from Hit and Run Candlesticks Inc. is financial or trading advice. All information is intended for Educational Purposes Only. Terms of Service.

Rick Saddler is not a licensed financial adviser nor does he offer trade recommendations or advice to anyone except for the trading desk of Hit and Run Candlesticks Inc.


MNKD – RBB J-Hook Breakout

MNKD – RBB J-Hook Breakout

MNKD – RBB J-Hook BreakoutMNKD has presented us with a double bottom followed by a rally into resistance. Consolidated then broke out and closed over the 200-FWL moving average. I would also like to note the tweezer bottom added a nice punch to the double bottom and the 3-day chart has drawn a Doji continuation pattern.

Good Trading – Hit and Run Candlesticks

Learn more about Hit and Run Candlesticks, and today’s trade idea and plan plus the 10 or more members trade ideas, starting at 9:10 EST AM every morning. Every day we teach and trade using the T-Line, Candlesticks, Support and Resistance, Trends, chart patterns and continuation patterns.

Trade Updates – Hit and Run Candlesticks

We sold ½ of out JNUG trade yesterday for a 13.

07% gain, and it looks like we are going to make more $$$. AMZN short is still working but nearing a level that may see a bounce, but will it be enough? X is trending the T-Line (nice) price is approaching the 200-FWL line, so consolidation is likely.

It is amazing how much knowledge you can gain in 3 months about Swing Trading – We are offering a Full 100% 3 month membership to Hit and Run Candlesticks for $212.50 Take what you learn and turn it into extra income or work from home and enjoy the lifestyle while earning an income and creating wealth.Click to Take Advantage

Are you having trouble putting together a winning trade? Not sure what scans to use? So near to having multiple winning trades, but something always goes wrong. Maybe a couple hours with a trading coach could make all the difference in the world. Hit and Run Candlesticks has 4 trading coachesLearn More about the Coaches

With on-demand recorded webinars, eBooks, and videos, member and non-member eLearning, plus the Live Trading Rooms, there is no end your trading education here at the Hit and Run Candlesticks, Right Way Options, Strategic Swing Trade Service and Trader Vision.


ALRM - You would be up 9% or $369.00

If you bought 100 shares when we posted to our members on August 14. Hit and Run Candlesticks members practice trade management and trade planning with Price and Candlesticks, The T-line, Trend, Trend Lines, Chart Patterns, Support, an

d Resistance.


Eyes On The Market (SPY)

Yesterday, Monday, August 28, the Bulls found themselves once again in second place. Yesterday’s candle closed below the open and below our trend line and $245.90. With the weak futures, this morning it looks as if we are deep into the Bearish channel. If the Bulls can’t find a reason to become Bullish $239.50 could be tested. Interesting that $239.50 is the 23.6 retracement from the 2016 November low to the 2017 August high.

What is a Trade Idea Watch-list?

A trade idea watchlist is a list of stocks that we feel will move in our desired direction over a swing trader's time frame.  That time could be one to 15 days for example. From that watch list, we wait until price action meets our conditions for a trade.

Rick’s personal trade ideas for the day MEMBERS ONLY

Start your education with wealth and the rewards of a Swing Traders Life – Click Here.


Investing and Trading involve significant financial risk and are not suitable for everyone. No communication from Hit and Run Candlesticks Inc. is financial or trading advice. All information is intended for Educational Purposes Only. Terms of Service.

Rick Saddler is not a licensed financial adviser nor does he offer trade recommendations or advice to anyone except for the trading desk of Hit and Run Candlesticks Inc.