
October 10, 2017 e-Learning Webinar
 Public Webinar
In this webinar, we discussed the market ahead of the FOMC minutes and looked at charts that were presented by the attendees.
Public WebinarIn this webinar, we discussed the market ahead of the FOMC minutes and looked at charts that were presented by the attendees.
 ACRX (Acelrx Pharmaceutics) The ACRX Chart has presented us with a bullish J-Hook Continuation Pattern from a Bullish T-Line Run. The Volatility Stops have helped to show a supporting leave on the Hook pullback, and the overall volume is rising.
Starting at 9:10 EST each day I explain the possible trade from start to finish: Why chosen, entry, stop and profit zones. Answer questions to help you succeed in trading.
Monthly • Quarterly • Semi-Annual • Annual • Change your future and enjoy the life of working from home with swing trading. The next step is up to you.
Learn more about Hit and Run Candlesticks, and today’s trade idea and plan plus the 10 or more members trade ideas, starting at 8:45 EST AM every morning with the HOG and then Rick at 9:10 EST. Every day we teach and trade using the T-Line, Candlesticks, Support and Resistance, Trends, chart patterns and continuation patterns.
Currently holding ten long positions
Monthly • Quarterly • Semi-Annual • Annual • We control our risk and manage our gains • We teach the Same • Cancel Anytime
The T-Line has caught up with price has price has moved sideways for three days now in preparation for the FOMC minutes released today. The 64K dollar question is how will the marker handle and decision or comments for the FEDS? Up until today, the Bulls have ruled the roost. No doubt there are may bets oh on this, I would rather let the dust settle, and the walk in with a cup of coffee and calmly do what I make every, trade and make a very nice living for myself and family.
 Rick’s trade ideas for the day – MEMBERS ONLY
 Monthly • Quarterly • Semi-Annual • Annual
Investing and Trading involves significant financial risk and is not suitable for everyone. No communication from Hit and Run Candlesticks Inc. is financial or trading advice. All information is intended for Educational Purposes Only. Terms of Service.
Rick Saddler is not a licensed financial adviser nor does he offer trade recommendations or advice to anyone except for the trading desk of Hit and Run Candlesticks Inc.
 INAP (Internap Corp) The INAP Chart has presented us with a bullish Stick Sandwich that broke out of a 2-month consolidation period. The first stick also printed a Bullish Morning Star signal. INAP is one that we will be watching for a better low-risk entry
Starting at 9:10 EST each day I explain the possible trade from start to finish: Why chosen, entry, stop and profit zones. Answer questions to help you succeed in trading.
Monthly • Quarterly • Semi-Annual • Annual • Change your future and enjoy the life of working from home with swing trading. The next step is up to you.
Learn more about Hit and Run Candlesticks, and today’s trade idea and plan plus the 10 or more members trade ideas, starting at 8:45 EST AM every morning with the HOG and then Rick at 9:10 EST. Every day we teach and trade using the T-Line, Candlesticks, Support and Resistance, Trends, chart patterns and continuation patterns.
Currently holding ten long positions
Monthly • Quarterly • Semi-Annual • Annual • We control our risk and manage our gains • We teach the Same • Cancel Anytime
► Ticker (WPRT) – You could have profited about 34.95% or about $101.00, If 100 shares when we posted to our members on September 12.
FOMC minutes Wednesday. We have said the past few days the SPY was a bit long in the tooth and needed to slow down and that is what is happening. As long as the bull can keep the SPY above support, we are in good bullish shape, below $251.90 could be more than the bull can handle for awhile.
Above $10.50 the VIX would be poking the bear. The VIX ran to the 34-EMA yesterday closing just under on the daily chart. The 3-day chart the VIX is painting a Morning Star Candle signal along with a double bottom.
Monthly • Quarterly • Semi-Annual • Annual
Investing and Trading involves significant financial risk and is not suitable for everyone. No communication from Hit and Run Candlesticks Inc. is financial or trading advice. All information is intended for Educational Purposes Only. Terms of Service.
Rick Saddler is not a licensed financial adviser nor does he offer trade recommendations or advice to anyone except for the trading desk of Hit and Run Candlesticks Inc.
 ARLM (Alarm Com) The ALRM Chart has presented us with a bullish trend, breakout, flag and hammer on support. Bullish confirmation above the Hammer usually within 3-4 days. Expected buying above the Hammer body open.
Starting at 9:10 EST each day I explain the possible trade from start to finish: Why chosen, entry, stop and profit zones. Answer questions to help you succeed in trading.
Monthly • Quarterly • Semi-Annual • Annual • Change your future and enjoy the life of working from home with swing trading. The next step is up to you.
Learn more about Hit and Run Candlesticks, and today’s trade idea and plan plus the 10 or more members trade ideas, starting at 8:45 EST AM every morning with the HOG and then Rick at 9:10 EST. Every day we teach and trade using the T-Line, Candlesticks, Support and Resistance, Trends, chart patterns and continuation patterns.
Last week we closed a couple of positions and took 50% off the take on several positions to protect over the weekend.
Monthly • Quarterly • Semi-Annual • Annual • We control our risk and manage our gains • We teach the Same • Cancel Anytime
With a bank holiday today and a Fed FOMC meeting on Wednesday I would suspect the market will be somewhat quite until Wednesday afternoon.
Friday the SPY closed with an inside day doji, the 8th day in a row that the SPY closed higher than it’s open. Price Action and the T-Line are still working together to create a bullish environment.
Friday the VIX closed higher than it’s open and closed above the previous day’s candle. Near historical lows and in double bottom territory the VIX may be trying to mount a upward push. Above $10.50 would be poking the bear.
Monthly • Quarterly • Semi-Annual • Annual
Investing and Trading involves significant financial risk and is not suitable for everyone. No communication from Hit and Run Candlesticks Inc. is financial or trading advice. All information is intended for Educational Purposes Only. Terms of Service.
Rick Saddler is not a licensed financial adviser nor does he offer trade recommendations or advice to anyone except for the trading desk of Hit and Run Candlesticks Inc.
 (It’s Friday) Friday is my favorite day of trading because it’s the day I get rewarded from a hard work week. Yep, every Friday I write a paycheck to myself from my trading account.
Friday is the day we count our money and reflect on our weeks trading. How did we do? How can we improve? Take time today to pause on trading and consider education. Reevaluate your trading goals, are your goals on track?
There are no trade ideas posted today, but you should have a running watchlist.
Learn more about Hit and Run Candlesticks, and today’s trade idea and plan plus the 10 or more members trade ideas, starting at 9:10 EST AM every morning. Every day we teach and trade using the T-Line, Candlesticks, Support and Resistance, Trends, chart patterns and continuation patterns.
Yesterday we closed ½ ZYNE 12.88% • ½ GRPN 16.25% • ½ IDGX 21.48% • ½ MACK 10.78% • SEAS 1.68 • LOXO -.02%
Give us a try If you would like to learn what and how we do it click here to give us a try, cancel at any time.
It sure has been a good week to trade with the overall market hitting new highs. We have moved our SPY pullback line up to $253.10. Any price action pullbacks above $253.10 we will consider bullish. I do feel this market may need a rest soon based on the length and the speed of the most recent rally. The T2122 indicator is also approaching the overbought area. For this reason, we did start hedging.
Investing and Trading involves significant financial risk and is not suitable for everyone. No communication from Hit and Run Candlesticks Inc. is financial or trading advice. All information is intended for Educational Purposes Only. Terms of Service.
Rick Saddler is not a licensed financial adviser nor does he offer trade recommendations or advice to anyone except for the trading desk of Hit and Run Candlesticks Inc.
 EXPR (Express Inc) The EXPR Chart has presented us with a Flag, Hammer, Bullish Morning Star after about a month of consolidation. We are also in an RBB pattern/strategy. The gap back in August 23rd changed the course, and now we are starting a trend toward the 200-SMA.
How to trade each HRC trade idea with entry, stop and profit zones. Answer questions to help you succeed in trading.
Monthly • Quarterly • Semi-Annual • Annual • Change your future and enjoy the life of working from home with swing trading. The next step is up to you.
Learn more about Hit and Run Candlesticks, and today’s trade idea and plan plus the 10 or more members trade ideas, starting at 8:45 EST AM every morning with the HOG and then Rick at 9:10 EST. Every day we teach and trade using the T-Line, Candlesticks, Support and Resistance, Trends, chart patterns and continuation patterns.
Yesterday we closed ½ of our “I” trade for a sweet 16.3% and ½ our “MBOT” trade for a 13.11% profit. We are currently holding 11 positions, all but one green.
Monthly • Quarterly • Semi-Annual • Annual • We control our risk and manage our gains • We teach the Same • Cancel Anytime
Another new day higher for the induces! The SPY closed higher bringing the T-Line even higher. Yesterday was the 25th day that price had ridden the V-Stop wave, that’s the kind of wave that put $$$$ in traders pockets. We are still looking at the T2122 chart, it is still bullish but a bit high simply suggesting the bulls might need a little rest. Trading tools like this that help us work the market to our advantage.
Rick’s trade ideas for the day – MEMBERS ONLY
Monthly • Quarterly • Semi-Annual • Annual
Investing and Trading involves significant financial risk and is not suitable for everyone. No communication from Hit and Run Candlesticks Inc. is financial or trading advice. All information is intended for Educational Purposes Only. Terms of Service.
Rick Saddler is not a licensed financial adviser nor does he offer trade recommendations or advice to anyone except for the trading desk of Hit and Run Candlesticks Inc.
 FMSA (Fairmount Santrol Holdings) The FMSA Chart has presented us with a trending Rounded Bottom Breakout chart, T-Line Run, five days of consolidation, a Bullish Morning Star on big volume, a Pop Out of The Box setup and a ♪♫♪Partridge In A Pear Tree.♪♫♪
How to trade each HRC trade idea with entry, stop and profit zones. Answer questions to help you succeed in trading.
Monthly • Quarterly • Semi-Annual • Annual • Change your future and enjoy the life of working from home with swing trading. The next step is up to you.
Learn more about Hit and Run Candlesticks, and today’s trade idea and plan plus the 10 or more members trade ideas, starting at 8:45 EST AM every morning with the HOG and then Rick at 9:10 EST. Every day we teach and trade using the T-Line, Candlesticks, Support and Resistance, Trends, chart patterns and continuation patterns.
We bought [ZYNE] and [I] yesterday based on the chart patterns and the price action. Learn more on why we bought and what we expect to profit from the chart.
Monthly • Quarterly • Semi-Annual • Annual • We control our risk and manage our gains • We teach the Same • Cancel Anytime
If you had bought 100 shares when we posted to our members on October 3.
The SPY closed on another new high yesterday, that’s five days up in a row. If you are a T-Line follower, we have a bullish T-Line Run. We still have a bullish outlook with minor PBO’s along the way. The T2122 chart suggests we may see a little profit taking in the market, of course, the final decision is up to the price.
A trade idea watchlist is a list of stocks that we feel will move in our desired direction over a swing trader’s time frame. That time could be one to 15 days for example. From that watch list, we wait until price action meets our conditions for a trade.
Monthly • Quarterly • Semi-Annual • Annual
Investing and Trading involves significant financial risk and is not suitable for everyone. No communication from Hit and Run Candlesticks Inc. is financial or trading advice. All information is intended for Educational Purposes Only. Terms of Service.
Rick Saddler is not a licensed financial adviser nor does he offer trade recommendations or advice to anyone except for the trading desk of Hit and Run Candlesticks Inc.

ZYNE (Zynerba Pharmaceuticals) The ZYNE Chart has presented us with a Morning Star reversal signal followed by a gap. Price is currently in your Rounded Bottom Breakout Zone with a pullback and Doji on the 50-SMA.
How to trade each HRC trade idea with entry, stop and profit zones. Answer questions to help you succeed in trading.
Monthly • Quarterly • Semi-Annual • Annual • Change your future and enjoy the life of working from home with swing trading. The next step is up to you.
Learn more about Hit and Run Candlesticks, and today’s trade idea and plan plus the 10 or more members trade ideas, starting at 8:45 EST AM every morning with the HOG and then Rick at 9:10 EST. Every day we teach and trade using the T-Line, Candlesticks, Support and Resistance, Trends, chart patterns and continuation patterns.
We bought SEAS yesterday based on the chart patterns and the price action. Learn more on why we bought and what we expect to profit from the chart.
If you bought 100 shares when we posted to our members on September 25.
Monthly • Quarterly • Semi-Annual • Annual • We control our risk and manage our gains • We teach the Same • Cancel Anytime
Another stellar day for the bulls breaking record highs. Not much I can say about the charts other than there’s a bullish party going on! Let’s remember sometimes the party can get carried away at times and there needs to be a grounding. As the responsible one at parties, I never let anyone drink and drive. This party is different, don’t keep partying without taking some profits. One of the most valuable things I have learned is to take profits from time to time. An example might be, when you reach double-digit gains close ½ the position and raise the stop. It’s a win-win.
A trade idea watchlist is a list of stocks that we feel will move in our desired direction over a swing trader’s time frame. That time could be one to 15 days for example. From that watch list, we wait until price action meets our conditions for a trade.
Monthly • Quarterly • Semi-Annual • Annual
Investing and Trading involves significant financial risk and is not suitable for everyone. No communication from Hit and Run Candlesticks Inc. is financial or trading advice. All information is intended for Educational Purposes Only. Terms of Service.
Rick Saddler is not a licensed financial adviser nor does he offer trade recommendations or advice to anyone except for the trading desk of Hit and Run Candlesticks Inc.
 PIRS (Pieris Pharmaceuticals) The PIRS Chart has presented us with a Bullish Inside Day Harami signal. Price has consolidated for a bit now, and the 34-EMA has crossed back over the 50-SMA. The T-Line is rising with price getting ready to attack the July highs.
Monthly • Quarterly • Semi-Annual • Annual • Change your future and enjoy the life of working from home with swing trading. The next step is up to you.
Learn more about Hit and Run Candlesticks, and today’s trade idea and plan plus the 10 or more members trade ideas, starting at 8:45 EST AM every morning with the HOG and then Rick at 9:10 EST. Every day we teach and trade using the T-Line, Candlesticks, Support and Resistance, Trends, chart patterns and continuation patterns.
We bought GRPN at $4.41, and it closed Friday at 5.20, with a 17.65% profit we will be protecting profits.
With on-demand recorded webinars, eBooks, and videos, member and non-member eLearning, plus the Live Trading Rooms, there is no end your trading education here at the Hit and Run Candlesticks, Right Way Options, Strategic Swing Trade Service and Trader Vision.
If you bought 100 shares when we posted to our members on August 10.
Monthly • Quarterly • Semi-Annual • Annual • Specials and Bonuses available from time to time (Look at your emails when you get them)
We control our risk and manage our gains • We teach the Same • Cancel Anytime
As of Friday’s close, the Buyers have once again proved their ownership of the market. The Big three moving averages steady climbed higher, and the T-Line continues to make new highs. We do not predict we follow PRICE ACTION and the chart looking for low-risk entries for profitable swings.
A trade idea watchlist is a list of stocks that we feel will move in our desired direction over a swing trader’s time frame. That time could be one to 15 days for example. From that watch list, we wait until price action meets our conditions for a trade.
Monthly • Quarterly • Semi-Annual • Annual
Investing and Trading involves significant financial risk and is not suitable for everyone. No communication from Hit and Run Candlesticks Inc. is financial or trading advice. All information is intended for Educational Purposes Only. Terms of Service.
Rick Saddler is not a licensed financial adviser nor does he offer trade recommendations or advice to anyone except for the trading desk of Hit and Run Candlesticks Inc.
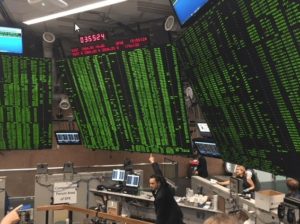
Look out Chicago we are Here
We are at the Chicago Board of Trade today (CBOE) hope to see you here.
We purchased yesterday’s featured trade idea. As of the close yesterday, we are still holding our positions. Longs no shorts. The SPY is still in consolidation mode with another lower high and a close below the T-Line. We are waiting for bullish price action that closes over the T-Line. Yesterdays shadow fell below the T-Line Band Low but closed back above. A bullish clue, we still need price to follow through. All of, yesterday’s trade idea still set up perfectly.
Monthly • Quarterly • Semi-Annual • Annual • Specials and Bonuses available from time to time (Look at your emails when you get them)
Learn more about Hit and Run Candlesticks, and today’s trade idea and plan plus the 10 or more members trade ideas, starting at 8:45 EST AM every morning with the HOG and then Rick at 9:10 EST. Every day we teach and trade using the T-Line, Candlesticks, Support and Resistance, Trends, chart patterns and continuation patterns.
With on-demand recorded webinars, eBooks, and videos, member and non-member eLearning, plus the Live Trading Rooms, there is no end your trading education here at the Hit and Run Candlesticks, Right Way Options, Strategic Swing Trade Service and Trader Vision.
Monthly • Quarterly • Semi-Annual • Annual • Specials and Bonuses available from time to time (Look at your emails when you get them)
We control our risk and manage our gains • We teach the Same • Cancel Anytime
A trade idea watchlist is a list of stocks that we feel will move in our desired direction over a swing trader’s time frame. That time could be one to 15 days for example. From that watch list, we wait until price action meets our conditions for a trade.
Monthly • Quarterly • Semi-Annual • Annual
Investing and Trading involves significant financial risk and is not suitable for everyone. No communication from Hit and Run Candlesticks Inc. is financial or trading advice. All information is intended for Educational Purposes Only. Terms of Service.
Rick Saddler is not a licensed financial adviser nor does he offer trade recommendations or advice to anyone except for the trading desk of Hit and Run Candlesticks Inc.


