DISCLAIMER: Investing/ Trading involves significant financial risk and is not suitable for everyone. No communication from us should be considered as financial or trading advice. All information provided by it and Run Candlesticks Inc, its affiliates or representatives is intended for educational purposes only. You are advised to test any new approach before implementing it. Past performance does not guarantee future results. Terms of Service
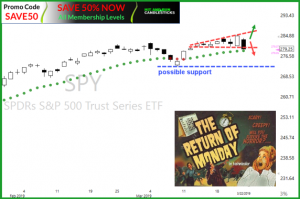
The trade war with China set off a little selling yesterday bringing in fear to the market, as stated yesterday we are cautiously bullish. As you can see from the 4-hour chart, the trend went from red to green. Price has followed the green dot trend challenging the Dotted Duece. Yesterdays fear brought in what looks like normal profit taking down to a minor support line and still above the $258.40 support line. With price closing above the $258.40 trend line and the Red/Green Dot trend, we will remain cautiously bullish until we see a compelling bearish candlestick pattern with follow-through the breaks the bullish trend.
For more information about the Red/Green Trend line, Dotted Deuce or anything about our charts, please consider joining us in the HRC trading room. We start at 9:10 Am each trading day.
VIX–X Chart – The Vix chart became a little bullish yesterday, and we are watching it like a hawk. If we see Bullish follow-through from the Morning Star signal printed yesterday, we will reevaluate ous trades and look at shorts/Puts
Stock picks or trade ideas without the education will cost you your hard earned money. HRC Watch-list Trade-Ideas – We are adding the following to our trade-list: BERY, BBBY, PG, EA, SLB. Learn how to trade before you trade. Past performance does not guarantee future.
Real-Time Market Scanner
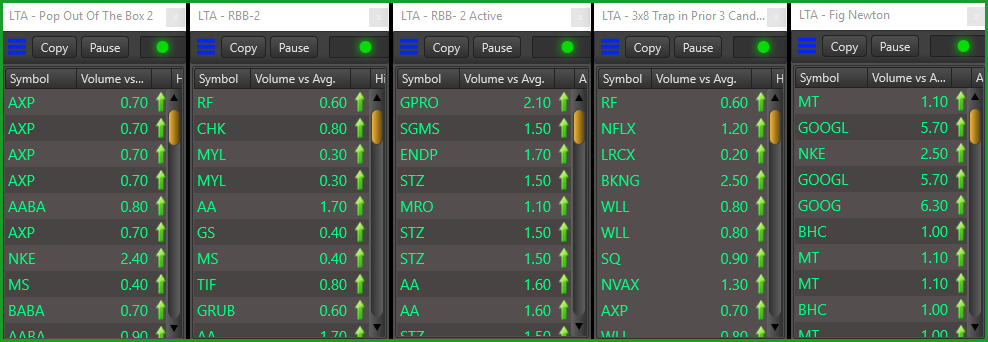
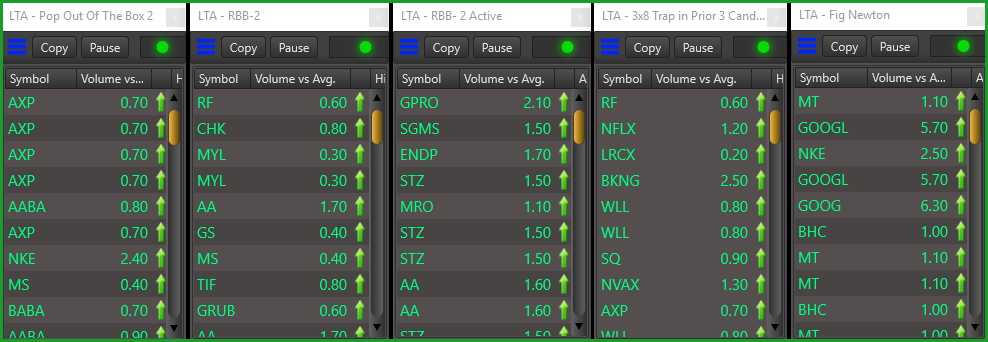
Built-In (Included) Scan Definitions. Bullish and bearish, Continuation, moving average crossovers and bounces. (RBB) Rounded Bottom Breakout alerts, intra-day, daily and weekly, Candlesticks stick signals and more. Scan Definitions- Download FREE
DISCLAIMER: Investing/ Trading involves significant financial risk and is not suitable for everyone. No communication from us should be considered as financial or trading advice. All information provided by it and Run Candlesticks Inc, its affiliates or representatives is intended for educational purposes only. You are advised to test any new approach before implementing it. Past performance does not guarantee future results. Terms of Service
Although the selloff yesterday may have been painful for may
long traders there was a silver lining showing at the close. After a hard test of their daily 50-averages, all four
of the major indexes bounced and closed at or just above this key psychological
support. This morning US Futures are
currently suggesting a bullish open, but
a lot will depend on the morning earnings
reports if that holds.
With little on the Economic Calendar today, political uncertainty
and global growth concerns, there is significant
pressure for companies to perform and prove they
can support current price levels.
Yesterday the VIX indicated a little fear is coming back into the market. Couple that with earnings and we have a recipe
for increased volatility hinged directly upon earnings results.
On the Calendar
On the Earnings Calendar, we
have 93 companies reporting today.
Notable reports, F, ABT, CP, CTXS, CCI, FFIV, KMB, LRCX, LVS, NG, PG,
TXN, UTX, & XLNX.
Action Plan
A decline of 3% in Existing Home Sales yesterday enhanced the
premarket fears of an economic slowdown pushing the Dow down 300 points. However, after a hard test of the daily 50-averages, the bulls responded showing at
least an initial willingness to defend it as support. As tenuous
as it may seem, the uptrend is still valid thus far and perhaps we a consolidation
will develop. Earnings Reports will be a
key element over the next few weeks that determine
market direction.
According to new reports,
the Presidents proposal to reopen the government will come to a vote later this
week, but the opposition vows it will not pass.
Pressure from employee groups continues
to increase as some 800,000 continue to work without pay. Futures this morning are pointing to a
bullish open currently suggesting a gap up of more than 100 points providing
some relief to yesterday selloff. Unfortunately, the bullishness has little to no
tailwinds with Asian market having closed
nearly flat on the day and European markets
mixed but currently mostly lower. With little
on Economic Calendar, today Earnings Reports
will be in high focus.
Three day weekends are a nice
break for traders, but they tend to create volatile price action and market
reversals upon the reopening. On Friday
I mentioned my intention of taking profits and reducing risk ahead of the long
weekend. With the futures currently
suggesting a Dow gap down between 150 and 200 points at the open, I’m that my
profits safely tucked away before the close on Friday.
Should we not panic as if the sky is falling? No, after such a huge market runs a pullback or consolidation is normal and
healthy as long as price support hold and the
bulls show a willingness to defend them.
The IMF report citing global growth concerns have markets around the world
reacting negatively to the possibility of an economic slowdown. However, the real test for our market will be
company earnings reports. So stay focused
on price action, support, resistance, and trend for clues to market direction.
On the Calendar
We have 81 companies reporting earnings today with notable earnings COF, FITB, HAL, JNJ, PETS,
PLD, STLD, AMTD, TRV, UBS & ZION.
Action Plan
Concerns on of global growth concerns after an IMF report, the
Government Shutdown in entering day 32 and new concerns about US/Trade negotiation progress have the bears pushing a bearish open today. Asian markets all closed in the red overnight,
and European
markets are also lower across the board. As a result,
Futures are currently pointing to gap down open between 150 to 200 points lower
at the open.
The economic report of Existing Home Sales and a significant
number of Earnings Reports this morning could easily improve or worsen the situation
depending upon the results. As nasty as
this gap down may seem at the moment, keep in
mind the indexes are currently holding above price support levels and their
respective 50-day moving averages. The expected
pullback or consolidation is a healthy thing as long as the bulls defend
support levels. Keep in mind earnings season
tends to increase market volatility and big morning reactions are typical. Which means bearish markets can reverse
bullish and vice-versa so remain flexible and focused on the price action and
the patterns within the charts.
Last week on the daily chart the SPY broke through the 50-SMA and the following day price action produced bullish follow-through. As of Friday we have had an 11-day bullish T-Line Run showing the strength and determination of the bulls. Both the Dotted Duece and 200-SMA are just above for the bulls to take.
The weekly Candleless chart the 3-EMA is just now coming up to meet the T-Line (8-EMA), and both the 34-EMA and 50-SMA are still in bear territory. Over the years of trading, I have learned to respect the T-Line trend and how price action and other moving averages act around it. The daily chart has cut through the first layer of the resistance skin and is suggesting a good bullish trend working its way back up through the 50SMA while price moves up and down as it should. The week chart 3-EMA still lags below the T-Line. (Cautiously Bullish)
VIX–X Chart – 15-candles below the T-Line, Doji close Friday on the 200-SMA. The T2122 chart closed Friday at 99.27
Stock picks or trade ideas without the education will cost you your hard earned money. HRC Watch-list Trade-Ideas – We are adding the following to our trade-list: RMBS, EA, NVDA, WDAY, URI, RIG, DVN. Learn how to trade before you trade. Past performance does not guarantee future.
Real-Time Market Scanner
Built-In (Included) Scan Definitions. Bullish and bearish, Continuation, moving average crossovers and bounces. (RBB) Rounded Bottom Breakout alerts, intra-day, daily and weekly, Candlesticks stick signals and more. Scan Definitions- Download FREE
Road To Wealth With Rick Saddler
Road To Wealth Coaching Looking for extended coaching? Serious out trading? Work with Rick Saddler on a daily basis. Read More
DISCLAIMER: Investing/ Trading involves significant financial risk and is not suitable for everyone. No communication from us should be considered as financial or trading advice. All information provided by it and Run Candlesticks Inc, its affiliates or representatives is intended for educational purposes only. You are advised to test any new approach before implementing it. Past performance does not guarantee future results. Terms of Service
Here are a few stats from our Day Trading Division yesterday 1/17/19 (TopGun Day Trading). AA -$120.00 • AA trade $225.00/2-days •AA trade $183.00 • SQ trade +100.00 • MTCH trade $40.00 for a total $428.00. Steve Risner resides in Florida and heads up our Day Trading Division Trading Room 5-days a week. Steve shares his trades and day trading knowledge with fellow traders.
If you are interested in a day traders lifestyle, you might want to take a test run or give yourself 6-Months to learn the tricks of day trading.
Top Gun Day Trading Room is for
the active day/scalp trader looking to profit daily with no overnight risk.
Daily trade alerts and trading education. Read More
Bullish Wall Of Worry
The bullish wall of worry can be taxing for swing traders. Here at Hit and Run Candlesticks, we help with that navigation. The SPY is challenging the 50-day SMA and the 50% retracement of the October 2018 highs and the December 2018 lows. The bullish challenge thus far has been successful with price action and a bullish T-line Run working quite nicely together. The next challenge for the SPY will be in the $270 – $274 area. I continue to watch and manage the charts and our profits like a Hawk as price navigates through this minefield of resistance.
VIX–X Chart – We are watching the CBOE Market Volatility Index for signs of fear or the lack of. As of yesterday, the fear is low as the price action is approaching the 200-SMA. The 200-SMA could start a small fear movement, Note the TC2000 / T2122 chart is now pegged at 99.04
HRC Watch-list Trade-Ideas – No trade Ideas on Fridays, Enjoy a few profits! Past performance does not guarantee future.
Real-Time Market Scanner
Built-In (Included) Scan Definitions. Bullish and bearish, Continuation, moving average crossovers and bounces. (RBB) Rounded Bottom Breakout alerts, intra-day, daily and weekly, Candlesticks stick signals and more. Scan Definitions- Download FREE
Road To Wealth With Rick Saddler
Road To Wealth Coaching Looking for extended coaching? Serious out trading? Work with Rick Saddler on a daily basis. Read More
DISCLAIMER: Investing/ Trading involves significant financial risk and is not suitable for everyone. No communication from us should be considered as financial or trading advice. All information provided by it and Run Candlesticks Inc, its affiliates or representatives is intended for educational purposes only. You are advised to test any new approach before implementing it. Past performance does not guarantee future results. Terms of Service
Yesterday’s news that the US was considering tariff reductions
with China sent the index sharply higher. Although there are still no specific details markets
around the world reacted positively on the hope progress is being made. Asian markets closed higher across the board,
and European indexes are currently sharply higher this morning in reaction.
US Futures are pointing to a substantial
gap up open that push US indexes above there respective 50-day averages just ahead of a 3-day weekend. After such a strong bullish run and gaping higher this morning I will likely take-profits on several
positions to reduce the risk of the long weekend. Gaps are gifts, and I would rather make a
bank deposit today than worry about the possibility of events that could change
sentiment over the weekend and holiday. If
the market continues higher, I can always reenter but if the market reverses I
won’t get a do-over to capture gains.
On the Calendar
On the Earnings Calendar,
we have 15 companies reporting with the most notable being CFG, KSU, RF, SLB,
STT, STI, VFC, and WIT.
Action Plan
After the bell,
yesterday we NFLX reported a beat on the top line but a slight miss on revenue to
kick off our the tech earnings season reports.
Next week the number of earnings reports begin to ramp, up and that will often increase market volatility. First quarter earnings session drags out much
longer, so it’s very important to make it a habit of check reporting dates as
part of your daily preparation. Skipping
this step can make for very painful lessons.
Thus far we’ve had a mix of earnings results lets hope that begins to
improve over the next couple weeks.
Next Monday the markets will be closed for Martin Luther
King so think about your risk as we head into the 3-day weekend. Today marks
the 28th day of the government shutdown, and both sides appear unwilling to budge. The market has largely ignored the shutdown
but as it continues to drag out the unintended economic consequences are starting
to appear and could begin to cause some market stress. Futures are pointing to
a gap up open of more than 100 points on US/China trade progress. A gap up ahead of a long weekend may be a
good time to ring the register and bank some profits to reduce the risk of uncertainty. Have a great weekend everyone!
With indexes at or near significant price resistance levels
and their respective 50-day moving averages,
traders should be careful about adding new long positions
and thinking about banking some profits.
Please understand that I am in no way suggesting bearishness. In fact,
with the DIA and the SPY so close to testing
their 50- day averages I would not want to rule a bullish effort to do just that. However, we can also not rule out the possibility of a pullback at resistance and
some profit-taking to begin.
We have a lot of economic and earnings data coming out
before the bell today, so anything is
possible, but futures are currently
pointing to gap down open. Asian market
closed lower across the board, and European markets are also all in the red this morning. MS, has
already reported an earnings miss this morning so we will need some good data to
inspire the bulls. The price support built
over the last week with the tight range consolidation may now provide some selloff
protection if the bears decide to come to
work today. As always, price is king so stay focused on price action for
clues.
On the Calendar
We have 43 companies reporting earnings today with NFLX
kicking off tech reports this afternoon.
Notable reports today AXP, BBT, FAST, JBHT, KEY, MTB, MS, PPG & TSM.
Action Plan
Earnings and Economic reports will likely be the key driving
force for the market this morning. On
the Economic Calendar, we have Housing
Starts, Jobless Claims, and the Philly Fed
all coming out an hour before the market open.
On the Earnings Calendar, we will
hear from BBT, KEY, MS, MTB, and PPG
before the bell which could obviously move the market. T2122 continues to suggest a pullback, or at a minimum,
a consolidation could begin at any time, but
so far, the bulls have had the energy and momentum to keep moving higher.
Currently, the Futures are suggesting
a lower open, but with so much pending news anything is possible by the time we
hear the bell ring. With the DIA and the
SPY so close to testing their 50-day averages I would not rule out the possibility
of a bullish effort to accomplish that task.
If we do see some selling, the tight consolidation just below could
easily serve to support prices keeping the bears in check. Remember the rule: we want to buy stocks at or
near price support. With the indexes at
or near price, resistance be very careful not to over-commit to long positions.
The SPY holds its bullish trend from it’s December low, and the tug-a-war between the buyers and sellers is hot and heavy. Yesterday’s price action did fail to show strong follow-through after the Morningstar Signal and did not close above its 50-SMA. But price remains in a T-Line trend and above the $256.40 support line. Readers of this blog should know we have had a concern about the resistance starting about $258.00. While price is currently battling resistance; price is also managing the trend. Overall we will remain cautiously bullish above $256.40, and below $256.40 we would watch for a test of the $250.30 area.
VIX–X Chart – Yesterday’s Bullish Engulf following a Doji closing in on the 200-SMA is a clue to be a little cautious as the sellers may try to put together an attack to regain the T-Line. Also, note the TC2000 / T2122 chart is pegged at 97.46. Stay sharp and respect the charts.
HRC Watch-list Trade-Ideas – WYNN, GE, CRON, AMRN, URI, CIEN, TWLO, LGIH. We cover the trade details each morning starting at 9:10 am Eastern in the HRC trading room and throughout the day. Trade-Ideas posted today may not trigger today or any other day. The key to trading is understanding how to trade. A trade alert means nothing without the education. Past performance does not guarantee future.
Real-Time Market Scanner
Built-In (Included) Scan Definitions. Bullish and bearish, Continuation, moving average crossovers and bounces. (RBB) Rounded Bottom Breakout alerts, intra-day, daily and weekly, Candlesticks stick signals and more. Scan Definitions- Download FREE
Hit and Run Candlesticks – Join Rick Daily in trading room #1 membership required. Join in, ask questions and learn how Rick picks his trades and trades them. 2018 account + 307% starting with only $5,100. Become a member of Hit and Run Candlesticks and let’s bring on 2019 Read More
Right Way Options Room Update – The RWO trading room is now open all day to share ideas and watchlist suggestions. Watch and learn from Doug as he prepares and explains his trades. Learn More about Right Way Options – Read More
Top Gun Day Trading Room is for the active day/scalp trader looking to profit daily with no overnight risk. Daily trade alerts and trading education. Read More
DISCLAIMER: Investing/ Trading involves significant financial risk and is not suitable for everyone. No communication from us should be considered as financial or trading advice. All information provided by it and Run Candlesticks Inc, its affiliates or representatives is intended for educational purposes only. You are advised to test any new approach before implementing it. Past performance does not guarantee future results. Terms of Service
Domestic and international political uncertainty appears to have no effect on the tenacious bulls with a refuse to lose attitude. Today is a big day of earnings and economic
reports that could bring out some volatility depending on the results. Inspired by a price increase from NFLX the QQQ
reached out to test its 50-day average as resistance yesterday. The Dow will need more than a 300 point rally,
and the SP-500 will require another 20
point gain to match that feat.
A tall order perhaps considering how stretched this rally has become, but you never say never. The
British Parliament will once again attempt
a no-confidence vote of the Prime Minister today which could create some market
turmoil as they continue to wrestle over leaving
the Euro. Remember that Price is King
and our job as traders is to stay focused
on how the market reacts to the news, not
the news itself!
On the Calendar
We have 24 companies stepping up to report results on the
Earnings Calendar today. Notable
earnings, GS, AA, BAC, BK, BLK, SCHW, CMA, CSX, FUL, PNC, and USB.
Action Plan
The Brexit vote suffers an epic
failure, and Parliament the Prime minister will once again face a no-confidence
vote later today. The market goes
up. The 26th day of the government
shutdown and the market goes up. Several
notable earnings miss with the latest miss from BLK this morning, and the
futures currently point to gains. In the
last several days any hint of profit taking is met by a wave of program buying
as the tenacious bulls push upward toward the 50-day moving averages. The bulls are in control, and they are not
taking no for an answer!
T2122 continues to signal
that the rally is overbought and suggesting
a pullback could occur at any time. Traders need to stay on their toes watching price
action and remember that the bears could reemerge
at any time. We have a big day on the Economic Calendar
today with Retail Sales numbers out before the open that could easily inspire
the bull or bears depending on the results.
Stay focused and flexible because
anything is possible.