$S Bullish Ascending Triangle
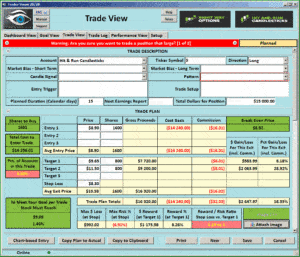
 (Sprint Nextel Corp) S has formed a Bullish Ascending Triangle with my big 3 moving averages and the 200-sma all coiled up tight. The 2 and 3-day charts have put a Bullish Engulf together that engulfed price and the big 3. The daily chart has formed a type of Bull Kicker after pulling back to the lower trend line.
Good Trading – Hit and Run Candlesticks
Learn more about Hit and Run Candlesticks, and today’s trade idea and plan plus the 10 or more members trade ideas, starting at 9:10 EST AM every morning. Every day we teach and trade using the T-Line, Candlesticks, Support and Resistance, Trends, chart patterns and continuation patterns.
Trade Updates – Hit and Run Candlesticks
17 positions open with 75% of trading account in use. In the past 30 days we have closed 16 positions at a 62% win rate (dropped a little in the last few days). We took a 5.5% lose yesterday on a trade that was not working out
Are you having trouble putting together a winning trade? Not sure what scans to use? You come so close to having multiple winning trades, but something always goes wrong. Maybe a couple hours with a trading coach could make all the difference in the world. Hit and Run Candlesticks has 4 trading coaches – Learn More about the Coaches
With on-demand recorded webinars, eBooks, and videos, member and non-member eLearning, plus the Live Trading Rooms, there is no end your trading education here at the Hit and Run Candlesticks, Right Way Options, Strategic Swing Trade Service and Trader Vision.
[67.39% WUBA] WUBA was first presented to HRC members on February 19,
WUBA, still Bullish and may be setting up with a T-Line Run. Hit and Run Candlesticks members have learned the importance of their trading tools, Price with Candlesticks and manage their trades using The T-line, Trend, Trend Lines, Support, and Resistance.
Eyes On The Market (SPY)
A repeat of what I wrote yesterday – Price and the T-Line are trapped between Support $245.70ish and Resistance $247.90ish. The 2-day chart still shows a Bearish Engulf but price is still above the 2-day T-Line Band high. The battle is on!
What is a Trade Idea Watch-list?
A trade idea watchlist is a list of stocks that we feel will move in our desired direction over a swing trader’s time frame. That time could be one to 15 days for example. From that watch list, we wait until price action meets our conditions for a trade.
Rick’s personal trade ideas for the day MEMBERS ONLY
Start your education with wealth and the rewards of a Swing Traders Life – Click Here
Investing and Trading involve significant financial risk and are not suitable for everyone. No communication from Hit and Run Candlesticks Inc. is financial or trading advice. All information is intended for Educational Purposes Only. Terms of Service.
Rick Saddler is not a licensed financial adviser nor does he offer trade recommendations or advice to anyone except for the trading desk of Hit and Run Candlesticks Inc.


Comments are closed.