Looking at the two recentcandles on a weekly chart, I see a Doji battling a Bearish Engulf. The T-Line is trending below the 34-EMA, and now the 34-EMA is trending below the 50-SMA. Between$262.25 and $280.26, the buyers and sellers have been beating each other backan fourth creating a crazy amount of volatility in the market. The daily chart is fighting to create a little momentum above $262.25 to challenge the minefield up to the $280.25 area. Based on price action and the charts the bears have the advantage, and the bulls on have small relief rallies to work with.
Watchlist Ideas
GRPN is now on our trade list after it closed above the 50-SMA yesterday. We will use the Rounded Bottom Breakout trade plan and rules. A few others that we have on our trade list is MRK, TWTR, PG, MSFT,
Yes, The Little Account Can!
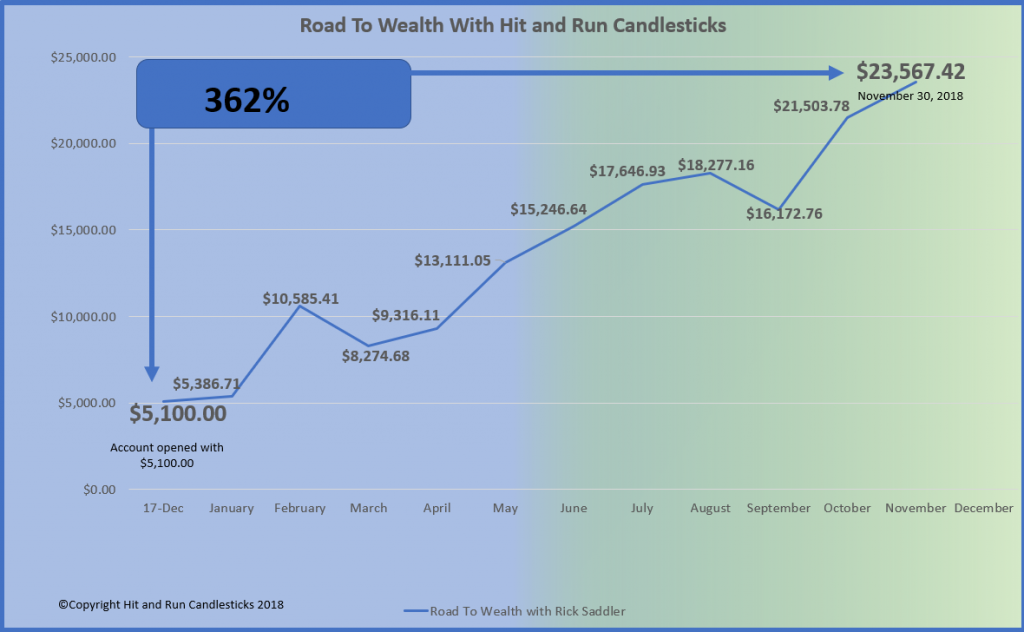
Yes, the little account can make it in the trading game, and the good traders can be better. Back in January this year I opened a little trading account to prove a prove a point (and to see if I could do it). The project was called “Road To Wealth.” I opened the account with $5,100.00, and as of 11/30/18, the account is worth$23,567.00 or a 362% increase.
If you would like to learn from someone that truly makes money not just one hit wonders and backs it up with his account statement. Contact Rick Saddler Founder of Hit and Run Candlesticks

Trading Services We Offer
Free YouTube Education • Subscription Plans • Private 2-Hour Coaching
DISCLAIMER: Investing/ Trading involves significant financial risk and is not suitable for everyone. No communication from us should be considered as financial or trading advice. All information provided by it and Run Candlesticks Inc, its affiliates or representatives is intended for educational purposes only. You are advised to test any new approach before implementing it. Past performance does not guarantee future results. Terms of Service


Comments are closed.