
Today’s Featured Trade Idea is HZNP (short) .
Members can join us in Trading Room #1 as Rick reviews this setup and other Trade-Ideas at 9:10am Eastern. For now, here are my own analysis and a potential trade plan made using our Trader Vision 20/20 software.
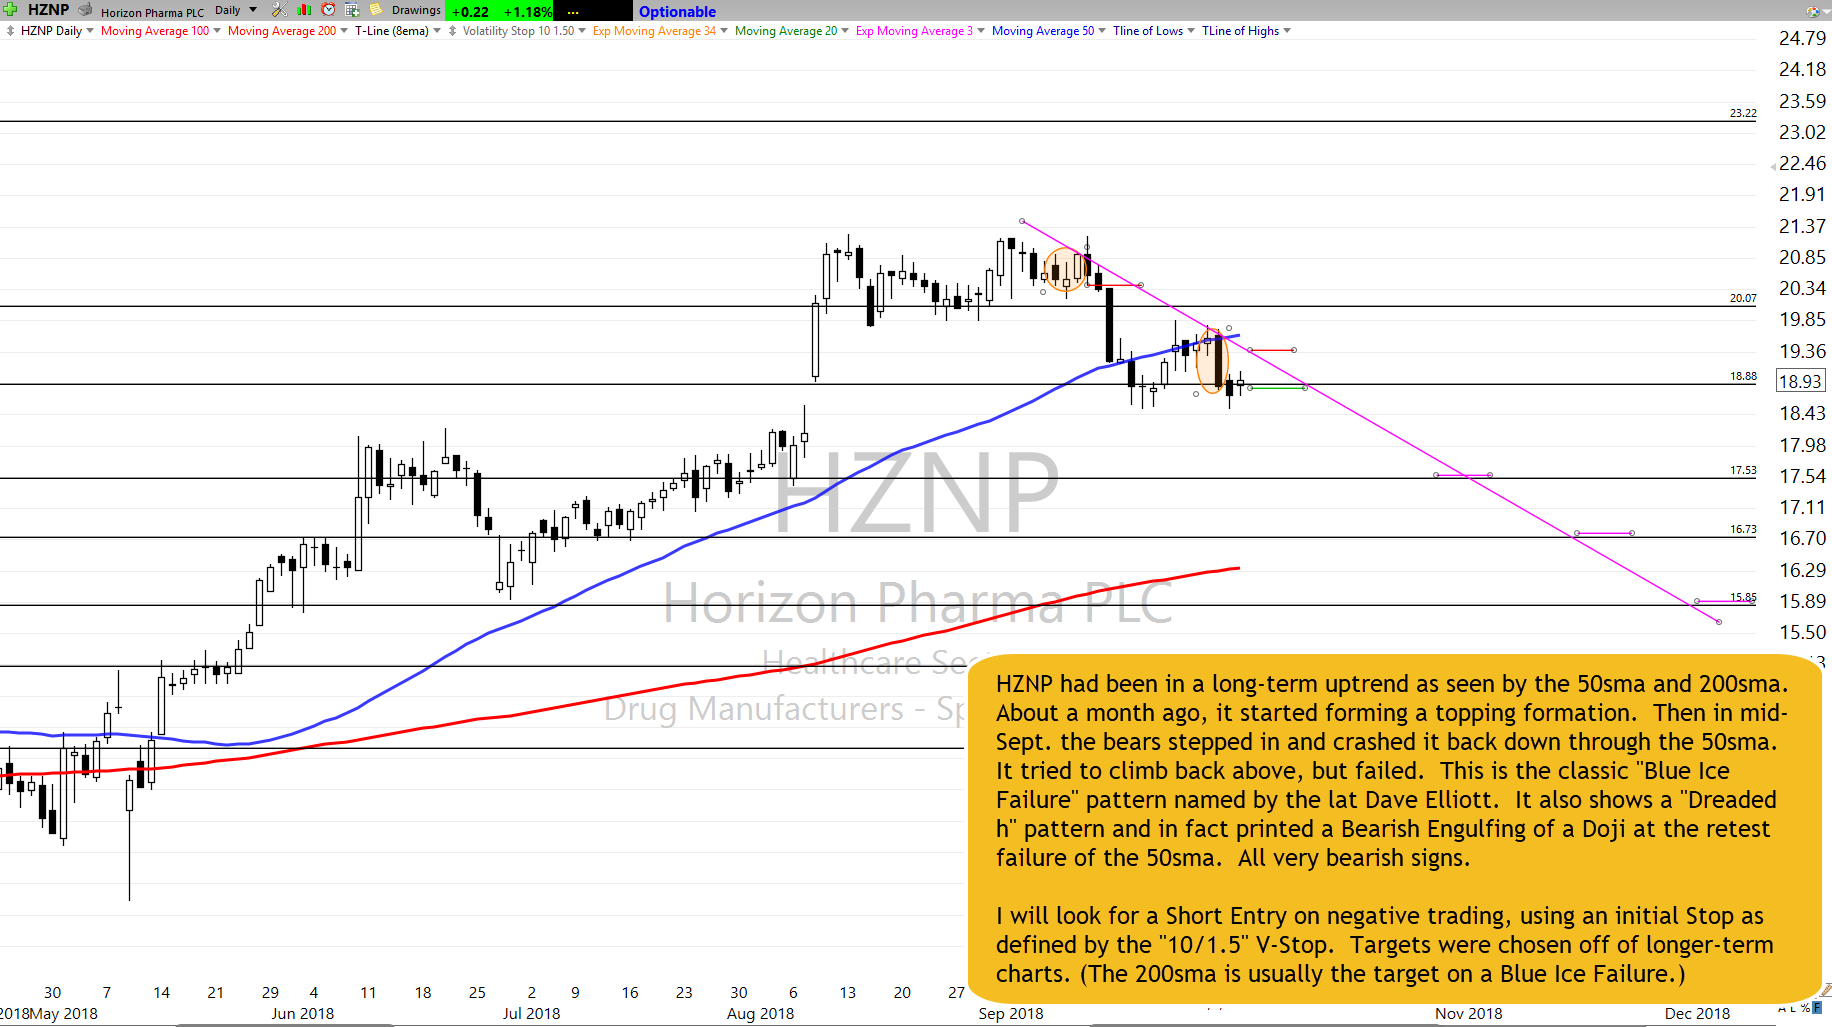
HZNP had been in a long-term uptrend as seen by the 50sma and 200sma. About a month ago, it started forming a topping formation. Then in mid-Sept. the bears stepped in and crashed it back down through the 50sma. It tried to climb back above, but failed. This is the classic “Blue Ice Failure” pattern named by the lat Dave Elliott. It also shows a “Dreaded h” pattern and in fact printed a Bearish Engulfing of a Doji at the retest failure of the 50sma. All very bearish signs.
I will look for a Short Entry on negative trading, using an initial Stop as defined by the “10/1.5” V-Stop. Targets were chosen off of longer-term charts. (The 200sma is usually the target on a Blue Ice Failure.)
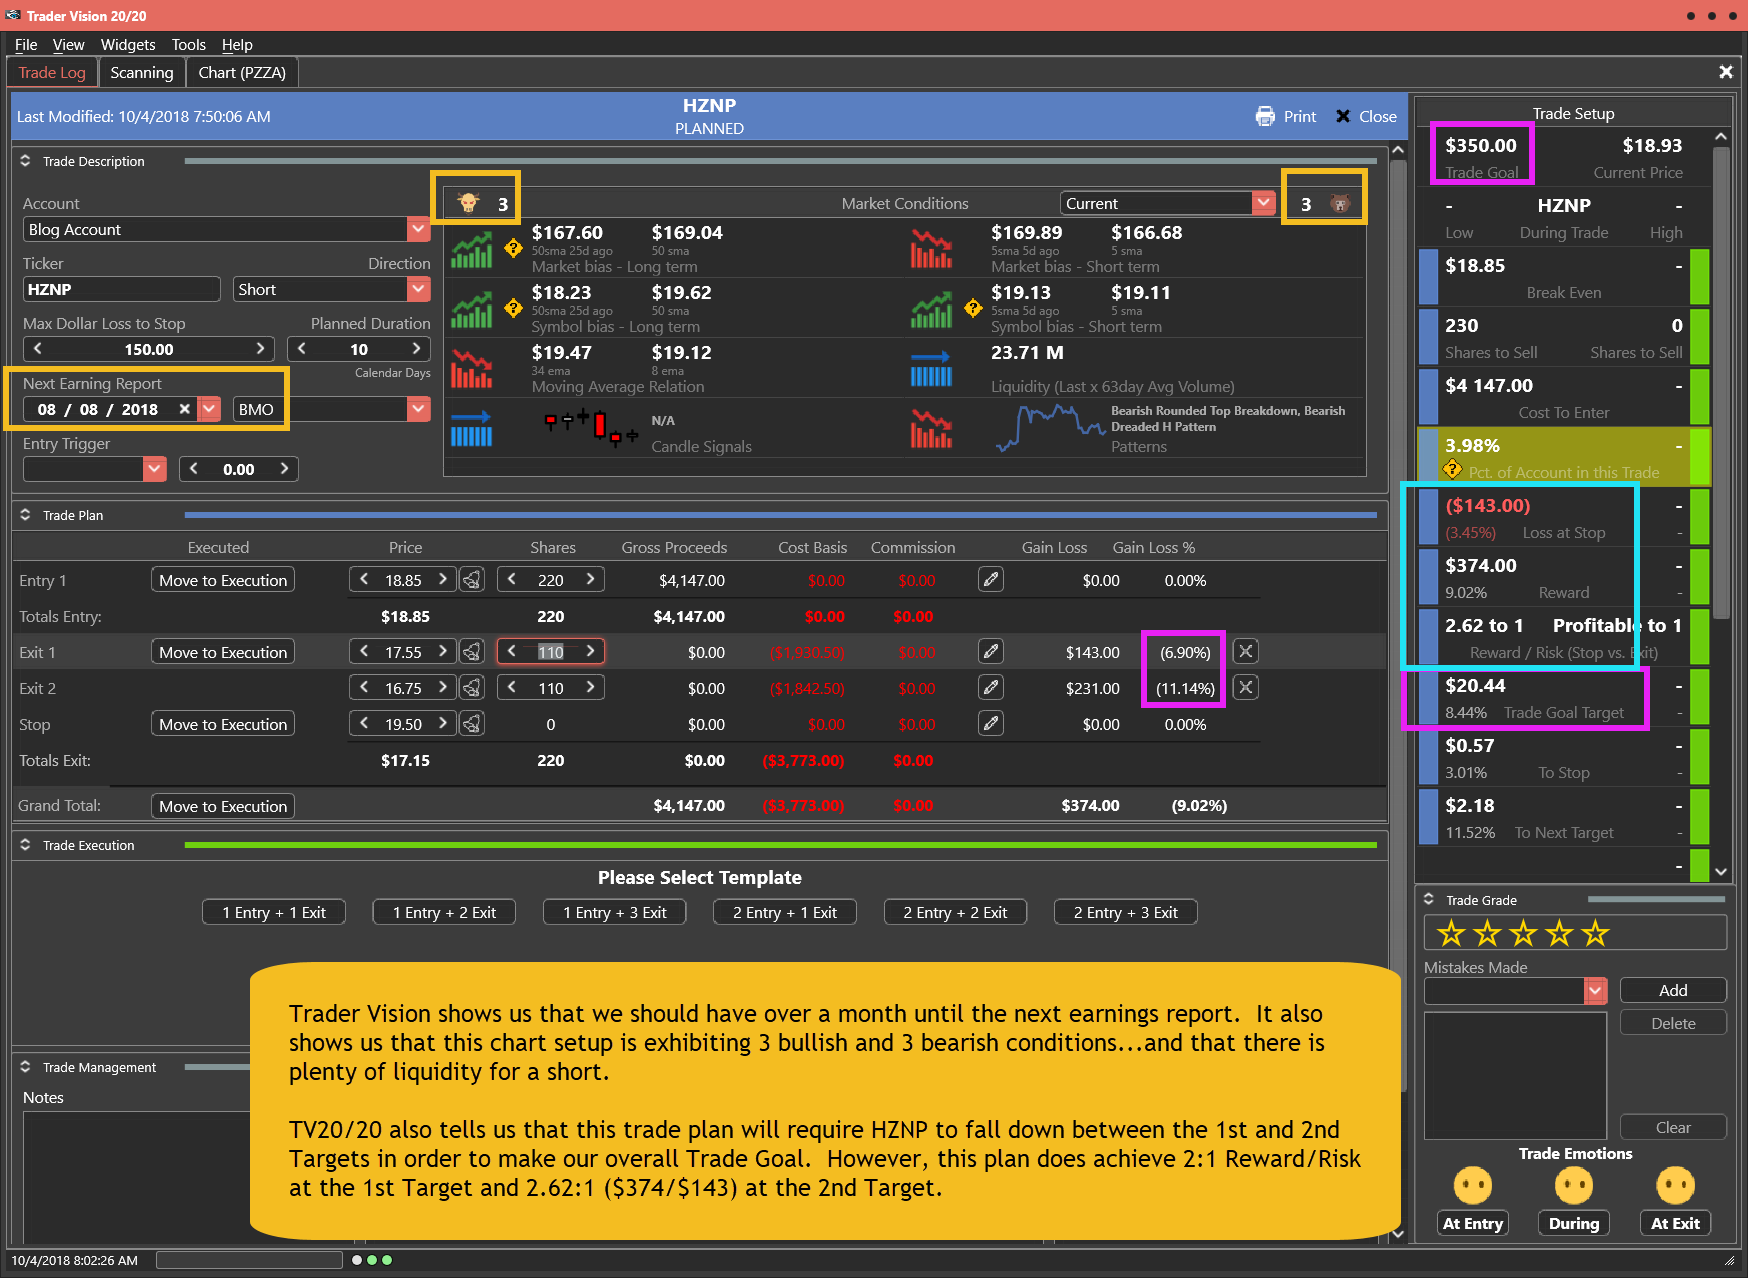
Trader Vision shows us that we should have over a month until the next earnings report. It also shows us that this chart setup is exhibiting 3 bullish and 3 bearish conditions…and that there is plenty of liquidity for a short.
TV20/20 also tells us that this trade plan will require HZNP to fall down between the 1st and 2nd Targets in order to make our overall Trade Goal. However, this plan does achieve 2:1 Reward/Risk at the 1st Target and 2.62:1 ($374/$143) at the 2nd Target.
Having this knowledge before a trade is even entered makes it much easier to control emotions and maintain discipline.
Below is my markup of the chart and the trade plan as laid out by Trader Vision 20/20. As a bonus, if you click the green button below, you’ll be able to watch a video of the chart markup and trade planning process.
The HZNP Trade Setup – As of 10-3-18
The Trade Plan
Note how Trader Vision 20/20 does so much of the work for you. Knowing the ratio of Bullish Conditions to Bearish ones as well as the overall risk of the position size, risk to Stop out and the Reward possible at each Target price can help a great deal with controlling our emotions. Knowing the dollar impact of every scenario ahead of time, allows us to make calm decisions during the trade. It really takes the pressure off. No guesswork. No surprises. No emotional roller coaster.
To see a short video of this trade’s chart markup and trade planning, click the button below.
[button_2 color=”light-green” align=”center” href=”https://youtu.be/_ocSt34sdk4″ new_window=”Y”]Trade Plan Video[/button_2]
Put the power to Trader Vision 20/20 to work for you…
[button_2 color=”orange” align=”center” href=”https://hitandruncandlesticks.com/product/trader-vision-20-20-monthly-subscription2/” new_window=”Y”]TV20/20 Software[/button_2]
Testimonial
Trader Vision immediately simplified the process…immediately it provided that information and guidance to me. I knew what I would risk for how much reward, I began taking trades off at the 1st target, 2nd target, I was no longer holding all my trades for the homerun. I also began implementing the stop losses if and when they were reached, not just hoping the stock would recover. It then became easier to see what patterns were working for me and which were not. It provided a much more relaxed and stress-free environment. –Joan G
***************************************************************************************************
Investing and Trading involve significant financial risk and are not suitable for everyone. Ed Carter is not a licensed financial adviser nor does he offer trade recommendations or investment advice to anyone. No communication from Hit and Run Candlesticks Inc. is to be considered financial or trading advice. All information is intended for Educational Purposes Only. Terms of Service.
***************************************************************************************************


Comments are closed.