INAP Has Printed A Doji Continuation Pattern
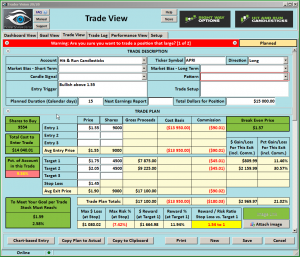
(Internap Corp) INAP Has Printed A Doji Continuation Pattern after breaking out of price action resistance and the big 3 moving averages. The past week or so INAP been in a tight consolidation with a bullish breakout (This is a Pop Out of The Box Pattern). On the 3-day chart, you can see an RBB setup coming off the dotted deuce turning up to the 200-sma. Learn more about Hit and Run Candlesticks, and today’s trade idea plus the 10 or more members trade ideas, starting at 9:10 EST AM every morning. 30-Day Trial
With on-demand recorded webinars, eBooks, and videos, member and non-member eLearning, plus the Live Trading Rooms, there is no end your trading education here at the Hit and Run Candlestick, Right Way Option, Strategic Swing Trade Service and Trader Vision.
Yesterday We Closed IMGN for an 18% Profit
[button_1 text=”%241000%20invested%20in%20IMGN%20at%2018%25%20is%20%241180.” text_size=”32″ text_color=”#000000″ text_bold=”Y” text_letter_spacing=”0″ subtext_panel=”Y” subtext=”Try%20Us%20Out%201-Month” subtext_size=”22″ subtext_color=”#3542f8″ subtext_bold=”Y” subtext_letter_spacing=”0″ text_shadow_panel=”N” styling_width=”40″ styling_height=”30″ styling_border_color=”#000000″ styling_border_size=”1″ styling_border_radius=”6″ styling_border_opacity=”100″ styling_shine=”Y” styling_gradient_start_color=”#ffff00″ styling_gradient_end_color=”#ffa035″ drop_shadow_panel=”N” inset_shadow_panel=”N” align=”center” href=”https://hitandruncandlesticks.com/hit-and-run-candlesticks/” new_window=”Y”/]
AGEN was first presented to HRC members on July 5,
Now up 12%. The Rounded Bottom Breakout pattern brings money to the table again. After a few bars of consolidation, a 9% pop close AGEN over the dotted deuce. Double-digit target ahead.
Eyes On The Market
For the most part, the market has been walking around looking for a path but can’t seem to find it. There is not a candle signal or pattern that’s giving a clue to the next market direction. For now, we will remain in mostly long positions a few short.
The overall market remains vulnerable as the Bear works for more control. As of the close Friday, I feel the Bull still has control, and the Bear has been a pain in you know what. On the SPY, DIA, and IWM charts the T-Line is still in bullish territory, The T-Line on the QQQs have slipped below itself.
What is a Trade Idea Watch-list?
A trade idea watchlist is a list of stocks that we feel will move in our desired direction over a swing trader’s time frame. That time could be one to 15 days for example. From that watchlist, we wait until price action meets our conditions for a trade.
MEMBERS ONLY
Investing and Trading involve significant financial risk and are not suitable for everyone. No communication from Hit and Run Candlesticks Inc. is financial or trading advice. All information is intended for Educational Purposes Only. Terms of Service.
Rick Saddler is not a licensed financial adviser nor does he offer trade recommendations or advice to anyone except for the trading desk of Hit and Run Candlesticks Inc.
$WTW Bullish Pop Out of The Box
WTW (Weight Watchers Intl Inc) WTW Bullish Pop Out of The Box. About June 23 the chart started to form a tight range, what we call a box. Friday price popped out of the box signaling the Buyers are motivated to push WTW higher. The weekly chart is trying to put together a Doji Continuation pattern. Learn more about Hit and Run Candlesticks, and today’s trade idea plus the 10 or more members trade ideas, starting at 9:10 EST AM every morning. 30-Day Trial
[button_1 text=”Learn%20To%20Swing%20Trade%20-%2030-Day%20Trial” text_size=”32″ text_color=”#000000″ text_bold=”Y” text_letter_spacing=”0″ subtext_panel=”Y” subtext=”Take%20The%20First%20Step” subtext_size=”15″ subtext_color=”#2341f6″ subtext_bold=”Y” subtext_letter_spacing=”0″ text_shadow_panel=”N” styling_width=”40″ styling_height=”30″ styling_border_color=”#000000″ styling_border_size=”1″ styling_border_radius=”6″ styling_border_opacity=”100″ styling_shine=”Y” styling_gradient_start_color=”#ffff00″ styling_gradient_end_color=”#ffa035″ drop_shadow_panel=”N” inset_shadow_panel=”N” align=”center” href=”https://hitandruncandlesticks.com/hrc-rwo-30-day-offer/” new_window=”Y”/]
KTOS was first presented to HRC members on June 14,
Now up 11.12%. Price is drawing a J-Hook continuation pattern supported by the T-Line. Last Wednesday price formed a piercing candle with legs setting up the J-Hook pattern up.
Eyes On The Market
The overall market remains vulnerable as the Bear works for more control. As of the close Friday, I feel the Bull still has control, and the Bear has been a pain in you know what. On the SPY, DIA, and IWM charts the T-Line is still in bullish territory, The T-Line on the QQQs have slipped below itself.
What is a Trade Idea Watch-list?
A trade idea watchlist is a list of stocks that we feel will move in our desired direction over a swing trader’s time frame. That time could be one to 15 days for example. From that watchlist, we wait until price action meets our conditions for a trade.
MEMBERS ONLY
Investing and Trading involve significant financial risk and are not suitable for everyone. No communication from Hit and Run Candlesticks Inc. is financial or trading advice. All information is intended for Educational Purposes Only. Terms of Service.
Rick Saddler is not a licensed financial adviser nor does he offer trade recommendations or advice to anyone except for the trading desk of Hit and Run Candlesticks Inc.
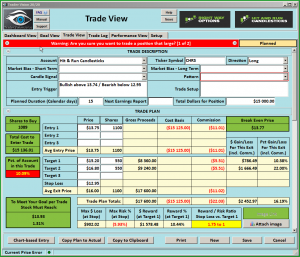
HRC Is Up 17.54% At Yesterday’s Close
Free Trade Idea – UVXY
UVXY (Ultra Short VIX ETF) Hit and Run Candlesticks and many members have had a position in UVXY for a few day now, HRC is up 17.54% at yesterday’s close. UVXY has met our Pinball strategy requirement on the daily chart, and we did take ½ off the table. The 2 and 3-day charts are set up for the Pinball Strategy with a sweet double-digit gain possible. The 2-day chart has formed a Bullish Morning Star with positive follow through and higher lows. At 9:10 EST we will be live in the trading room talking about the UVXY trade and a few others.
With on-demand recorded webinars, eBooks, and videos, member and non-member eLearning, plus the Live Trading Rooms, there is no end your trading education here at the Hit and Run Candlestick, Right Way Option, Strategic Swing Trade Service and Trader Vision.
NVCR was first presented to HRC members on June 1,
Now up 42.63%. The T-Line has shown its self off many times in this chart and is doing so now. Learning about the T-Line is a must for the serious trader. Hi, my name is Rick Saddler, and the father of the T-line and I truly believe it should be in everyone trading tool box.
Eyes On The Market
Not an enjoyable day for the market yesterday, a few days back we posted in the trading room that the current trending SPY chart would likely see the $240.40 area (yesterday’s low was $240.34) The point is simple – Following the trend and understanding candlesticks give you an edge that very few traders have.
We will start the day off with price below the T-Line in all four major indices and the T-Line below the 34-ema on the 1-2 and 4-hour charts in all indices. If the Bulls are going to mount a fight back, they should do it sooner rather than later. Too much power in the hands of a Bear can be destructive.
Hit and Run Candlesticks and members that have been in UVXY and SQQQ have more than made your money for the week. Well done team!
What is a Trade Idea Watch-list?
A trade idea watchlist is a list of stocks that we feel will move in our desired direction over a swing trader’s time frame. That time could be one to 15 days for example. From that watchlist, we wait until price action meets our conditions for a trade.
MEMBERS ONLY
Investing and Trading involve significant financial risk and are not suitable for everyone. No communication from Hit and Run Candlesticks Inc. is financial or trading advice. All information is intended for Educational Purposes Only. Terms of Service.
Rick Saddler is not a licensed financial adviser nor does he offer trade recommendations or advice to anyone except for the trading desk of Hit and Run Candlesticks Inc.
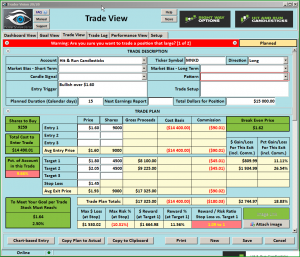
Flag Pull-Back Opportunity in KTOS
Free Trade Idea – KTOS
KTOS (Kratos Defense & Sec Sol. Inc) Flag pull-back opportunity in KTOS now that it has broken out of its recent consolidation then pulled back for a support test. The Flag pattern is a clue to the next bullish leg with follow through of the Bullish Piercing Candle that came off support. Members of Hit and Run Candlesticks also have 10 other trade ideas we cover live each morning starting at 9:10 EST.
With on-demand recorded webinars, eBooks, and videos, member and non-member eLearning, plus the Live Trading Rooms, there is no end your trading education here at the Hit and Run Candlestick, Right Way Option, Strategic Swing Trade Service and Trader Vision.
NVCR was first presented to HRC members on June 1,
Now up 44.62%. The T-Line has shown its self off many times in this chart and is doing so now. Learning about the T-Line is a must for the serious trader. Hi, my name is Rick Saddler, and the father of the T-Line and I truly believe it should be in everyone trading too
[button_1 text=”Improve%20Your%20Trading%20%20-%20Try%20it%20for%20a%20Month” text_size=”26″ text_color=”#000000″ text_bold=”Y” text_letter_spacing=”0″ subtext_panel=”Y” subtext=”See%20The%20Potential” subtext_size=”16″ subtext_color=”#081df7″ subtext_bold=”Y” subtext_letter_spacing=”0″ text_shadow_panel=”N” styling_width=”40″ styling_height=”30″ styling_border_color=”#000000″ styling_border_size=”1″ styling_border_radius=”6″ styling_border_opacity=”100″ styling_shine=”Y” styling_gradient_start_color=”#ffff00″ styling_gradient_end_color=”#ffa035″ drop_shadow_panel=”N” inset_shadow_panel=”N” align=”center” href=”https://hitandruncandlesticks.com/hit-and-run-candlesticks/” new_window=”Y”/]
Eyes On The Market
The market remains mixed and choppy, DIA’s, SPY, IWM, IYT above the T-Line. QQQs and SMH below the T-Line and the 34-ema rising except for the QQQs and SMH. Leading sectors yesterday were Technology but still trending down and Healthcare. Overall the market still has a bullish slant; we are watching support very carefully.
What is a Trade Idea Watch-list?
A trade idea watchlist is a list of stocks that we feel will move in our desired direction over a swing trader’s time frame. That time could be one to 15 days for example. From that watchlist, we wait until price action meets our conditions for a trade.
MEMBERS ONLY
Investing and Trading involve significant financial risk and are not suitable for everyone. No communication from Hit and Run Candlesticks Inc. is financial or trading advice. All information is intended for Educational Purposes Only. Terms of Service.
Rick Saddler is not a licensed financial adviser nor does he offer trade recommendations or advice to anyone except for the trading desk of Hit and Run Candlesticks Inc.
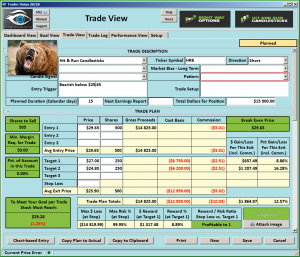
Bullish Morning Star Pattern Pulled Back To Support
Free Trade Idea – DEPO
DEPO – Has now formed a Bullish Morning Star Pattern after a 17 percent run followed by bullish consolidation testing and holding above support. The double bottom and Belt Hold after a seven-month decline may be the start of a reversing base. DEPO is a Rounbed Bottom Breakout -RBB possible set for a swing or two. Members of Hit and Run Candlesticks also have 11 other trade ideas we cover live each morning starting at 9:10 EST.
With on-demand recorded webinars, eBooks, and videos, member and non-member eLearning, plus the Live Trading Rooms, there is no end your trading education here at the Hit and Run Candlestick, Right Way Option, Strategic Swing Trade Service and Trader Vision.
Eyes On The Market
The overall market is mixed DIA’s, IWM above the T-Line, SPY, and QQQs below the T-Line. Take a look at each chart to determine the trend that meets your needs. The weekly chart has the QQQs below the T-Line.
What is a Trade Idea Watch-list?
A trade idea watchlist is a list of stocks that we feel will move in our desired direction over a swing trader’s time frame. That time could be one to 15 days for example. From that watchlist, we wait until price action meets our conditions for a trade.
MEMBERS ONLY
Investing and Trading involve significant financial risk and are not suitable for everyone. No communication from Hit and Run Candlesticks Inc. is financial or trading advice. All information is intended for Educational Purposes Only. Terms of Service.
Rick Saddler is not a licensed financial adviser nor does he offer trade recommendations or advice to anyone except for the trading desk of Hit and Run Candlesticks Inc.
Friday’s Harami Had No Impact
Friday’s Harami had no impact on the current trend. Once again the SPY on tested and held support while the short term sellers keep trying to turn this ship into the hazardous water. With the oceans, lakes, and rivers capturing investors and traders today’s trading is not like to tell a complete story. Today the market closes early at 1 PM Eastern; we are not likely to see a huge change in the overall market.
We will check our positions a couple times today and poke around with very little chance we buy anything new until later this week. Please enjoy your 4th of July Holiday.
The trading room is open today, July 3, 2017 and we invite everyone to stop by and say hi.
We have opened the trading room to the public for today. (July 3, 2017)
[button_1 text=”Join%20Us%20FREE%20In%20The%20Live%20Trading%20Room%20Today” text_size=”32″ text_color=”#000000″ text_font=”Montserrat;google” text_bold=”Y” text_letter_spacing=”0″ subtext_panel=”Y” subtext=”Click%20Here” subtext_size=”14″ subtext_color=”#1628f3″ subtext_bold=”Y” subtext_letter_spacing=”0″ text_shadow_panel=”N” styling_width=”40″ styling_height=”30″ styling_border_color=”#000000″ styling_border_size=”1″ styling_border_radius=”6″ styling_border_opacity=”100″ styling_shine=”Y” styling_gradient_start_color=”#ffff00″ styling_gradient_end_color=”#ffa035″ drop_shadow_panel=”N” inset_shadow_panel=”N” align=”center” href=”http://hitandruncandlesticks.webinato.com/room1″ new_window=”Y”/]
Support And The 50-Day Simple Moving Average
The SPY was protected by the support and the 50-Day simple moving average when price slipped through, and the Bulls caught it before a full out runaway. Never the less we still have lower highs and lower lows for about the past 2 weeks. I see support in the $240.40 area followed by the $237.60 area. Resistance is the $242.75 area.
Closed Positions
IMFN ½ for a +18.71%
UVXY ½ for a +24.06%
Free Trade Idea – No Free Trade Idea Today
For members, we do have 13 trade ideas that we will cover from our members master list between 9:10 Est. to market open.
From our Members Watch-list
SCSS is up 17.88% from our members only post on June 2; The Bulls moved it 11.32% yesterday.
Hit and Run Candlesticks Trade Ideas -vs.- SPY Last 7 Bars
- HTZ +31.26%
- CARA + 30.82%
- VRX +26.54%
- SPWR + 23.57%
What is a Trade Idea Watch-list?
A trade idea watchlist is a list of stocks that we feel will move in our desired direction over a swing trader’s time frame. That time could be one to 15 days for example. From that watchlist, we wait until price action meets our conditions for a trade.
[button_1 text=”%20Members%20watch%20list%20-%20Members%C2%A0benefits%20-%20Learn%20to%20trade%20and%20change%20your%20life%20″ text_size=”32″ text_color=”#000000″ text_font=”Montserrat;google” text_bold=”Y” text_letter_spacing=”0″ subtext_panel=”Y” subtext=”Click%20Here” subtext_size=”16″ subtext_color=”#1a43f4″ subtext_bold=”Y” subtext_letter_spacing=”0″ text_shadow_panel=”N” styling_width=”40″ styling_height=”30″ styling_border_color=”#000000″ styling_border_size=”1″ styling_border_radius=”6″ styling_border_opacity=”100″ styling_shine=”Y” styling_gradient_start_color=”#ffff00″ styling_gradient_end_color=”#ffa035″ drop_shadow_panel=”N” inset_shadow_panel=”N” align=”center” href=”https://hitandruncandlesticks.com/hit-and-run-candlesticks/” new_window=”Y”/]
Investing and Trading involve significant financial risk and are not suitable for everyone. No communication from Hit and Run Candlesticks Inc. is financial or trading advice. All information is intended for Educational Purposes Only. Terms of Service.
Rick Saddler is not a licensed financial adviser nor does he offer trade recommendations or advice to anyone except for the trading desk of Hit and Run Candlesticks Inc.
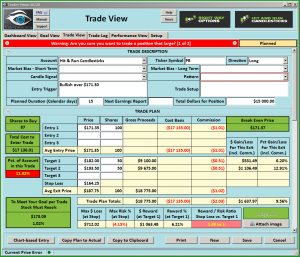
Profit Takers Are Coming Out
Profit takers are coming out in the overall market. Candlesticks patterns and signals are starting to suggest the big bulls are in need for profits, evidence of profit taking can be seen in the SPY, QQQ, DIA, VT, and VTI ETF’s. Candlestick and price action of the SPY suggest the next 2 big numbers are $240.40 followed by $237.60. The Bulls will not likely give in willingly or easy, so we should see minor relief rallies.
Free Trade Idea – UVXY
UVXY (Ultra Vix Short-Term Futures ETF) Became an HRC-RBB chart pattern yesterday with tremendous profit potential. The 3-day chart is set up for our Pinball Strategy. On the 3-day chart.
With on-demand recorded webinars, eBooks, and videos, member and non-member eLearning, plus the Live Trading Rooms, there is no end your trading education here at the Hit and Run Candlestick, Right Way Option, Strategic Swing Trade Service and Trader Vision.
Conditions For The UVXY Trade
- Bullish Harami 3-day chart
- Engulfed Lower and Upper 4-hour Band
From our Members Watchlist
SGMO is up 83.16% from our members only post on March 6, after hitting resistance. 83.16 profit or the piece you may have will look and feel good in your bank account.
Hit and Run Candlesticks Trade Ideas -vs- SPY Last 7 Bars
- CARA +51.32%
- IMGN + 33.20%
- ESPR +27.04%
- VRX +23.61%
- DVAX +20.48%
[button_1 text=”30-Day%20Trial%20Hit%20and%20Run%20Candlesticks%20and%20Right%20Way%20Options” text_size=”32″ text_color=”#000000″ text_bold=”Y” text_letter_spacing=”0″ subtext_panel=”N” text_shadow_panel=”N” styling_width=”40″ styling_height=”30″ styling_border_color=”#000000″ styling_border_size=”1″ styling_border_radius=”6″ styling_border_opacity=”100″ styling_shine=”Y” styling_gradient_start_color=”#ffff00″ styling_gradient_end_color=”#ffa035″ drop_shadow_panel=”N” inset_shadow_panel=”N” align=”center” href=”https://hitandruncandlesticks.com/hrc-rwo-30-day-offer/” new_window=”Y”/]
What is a Trade Idea Watchlist?
A trade idea watchlist is a list of stocks that we feel will move in our desired direction over a swing trader’s time frame. That time could be one to 15 days for example. From that watchlist, we wait until price action meets our conditions for a trade.
MEMBERS ONLY
Investing and Trading involve significant financial risk and are not suitable for everyone. No communication from Hit and Run Candlesticks Inc. is financial or trading advice. All information is intended for Educational Purposes Only. Terms of Service.
Rick Saddler is not a licensed financial adviser nor does he offer trade recommendations or advice to anyone except for the trading desk of Hit and Run Candlesticks Inc.
SPY Has Been Wondering Around With Its Eyes Closed
(SPY) For about 18 days now the SPY has been wondering around with its eyes closed, no direction other that sideways which is perfectly fine because we have been able to find and trade the profits right to the bank.
We took 38.52% of VRX to the bank yesterday – Soon we will take CGI, IMGN, VSTO, ARDX, DRIP, all double-digit gains to the bank. (No coin here all folding money)
Free Trade Idea – GNMX
GNMX (Aevi Genomic Medicine Inc) Became an HRC-RBB chart pattern yesterday with tremendous profit potential. The 3-day chart is set up for our Pinball Strategy. On the 3-day chart.
With on-demand recorded webinars, eBooks, and videos, member and non-member eLearning, plus the Live Trading Rooms, there is no end your trading education here at the Hit and Run Candlestick, Right Way Option, Strategic Swing Trade Service and Trader Vision.
Conditions For The GNMX Trade
- RBB setup
- Inverted Hammer
- Higher Lows
- J-Hook
- Swing or swings: 30% Plus
From our Members Watchlist
VRX is up 76.81% from our members only post on May 5, 2017; VRX popped another 8.10% yesterday closing above the 200-sma. Can you see how VRX when from a Pinball setup to an RBB setup, then closed above the 200-sma?
Hit and Run Candlesticks Movers – SPY VS Members List Last 7 Bars
- IMGN +48.91%
- CARA +48.42%
- VRX +34.91%
- ESPE +28.39%
- CAR +26.58[button_1 text=”Incase%20you%20Missed%20The%20Free%20J-Hook%20eBook” text_size=”32″ text_color=”#000000″ text_bold=”Y” text_letter_spacing=”0″ subtext_panel=”Y” subtext=”Click%20Here” subtext_size=”15″ subtext_color=”#f63131″ subtext_bold=”Y” subtext_letter_spacing=”0″ text_shadow_panel=”N” styling_width=”40″ styling_height=”30″ styling_border_color=”#000000″ styling_border_size=”1″ styling_border_radius=”6″ styling_border_opacity=”100″ styling_shine=”Y” styling_gradient_start_color=”#ffff00″ styling_gradient_end_color=”#ffa035″ drop_shadow_panel=”N” inset_shadow_panel=”N” align=”center” href=”https://hitandruncandlesticks.com/swing-traders-j-hook-pattern/” new_window=”Y”/]
What is a Trade Idea Watchlist?
A trade idea watchlist is a list of stocks that we feel will move in our desired direction over a swing trader’s time frame. That time could be one to 15 days for example. From that watchlist, we wait until price action meets our conditions for a trade.
MEMBERS ONLY
Investing and Trading involve significant financial risk and are not suitable for everyone. No communication from Hit and Run Candlesticks Inc. is financial or trading advice. All information is intended for Educational Purposes Only. Terms of Service.
Rick Saddler is not a licensed financial adviser nor does he offer trade recommendations or advice to anyone except for the trading desk of Hit and Run Candlesticks Inc.
SPY Is Range Bound Near It’s 23.3 Fibonacci Retracement Line
(SPY) The SPY is range bound near it’s 23.3 Fibonacci retracement line. 4 out of 5 candlesticks closed below the T-Line last week while all 5 of last weeks candlesticks closed above the 23.6% Fib. Line. The Bearish Engulf on the 3-day chart still weighs heavy on the next 2 following candles, they both have closed below $243.50 and the Bearish Engulf 50% line. The Bulls need to challenge and win the $243.50 line to put a new high challenge together.
Free Trade Idea – IPI
IPI (Intrepid Potash Inc.) Was first a members trade idea on May 16, 2017, and as of Friday’s close up 10%. On the monthly chart, I see support above the bottom construction. On a 3-day chart, IPI is An RBB pattern with a Bullish Engulf on the Dotted Deuce.
With on-demand recorded webinars, eBooks, and videos, member and non-member eLearning, plus the Live Trading Rooms, there is no end your trading education here at the Hit and Run Candlestick, Right Way Option, Strategic Swing Trade Service and Trader Vision.
Conditions For The IPI Trade
- RBB setup 3-day chart
- Bullish Morning Star Daily
- Trending
- Big Three Engulf
- Swing or swings: 30% Plus
From our Members Watchlist
PI is up another 42.97% from our members only post on May 8, 2017; PI popped 7.58% Friday with a breakout, flag, breakout. Know how to get aboard a trending stock is an art that can be learned, something we teach every day in the trading room
Hit and Run Candlesticks Movers – SPY VS Members List Last 7 Bars
- IMGN +33.77%
- CARA +32.30%
- VRX +30.36%
What is a Trade Idea Watchlist?
A trade idea watchlist is a list of stocks that we feel will move in our desired direction over a swing trader’s time frame. That time could be one to 15 days for example. From that watchlist, we wait until price action meets our conditions for a trade.
MEMBERS ONLY
Investing and Trading involve significant financial risk and are not suitable for everyone. No communication from Hit and Run Candlesticks Inc. is financial or trading advice. All information is intended for Educational Purposes Only. Terms of Service.
Rick Saddler is not a licensed financial adviser nor does he offer trade recommendations or advice to anyone except for the trading desk of Hit and Run Candlesticks Inc.