
APRI – T-Line Run Flag Pullback
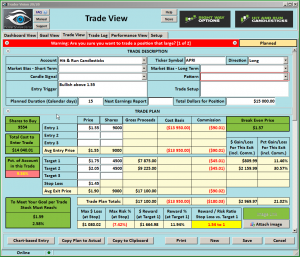 APRI – A T-Line Run Flag Pullback is trending and recently broke out of the $1.48 resistance line and has now pulled back on Bullish profit taking. Price has also pulled back while staying above the V-Stop. Price has also cleared the Dotted Duece and may be ready to take on the 200-SMA. We will be using the Rounded Bottom Breakout Strategy. Until the price is over the 200-SMA.
Good Trading – Hit and Run Candlesticks
Learn more about Hit and Run Candlesticks, and today’s trade idea and plan plus the 10 or more members trade ideas, starting at 9:10 EST AM every morning. Every day we teach and trade using the T-Line, Candlesticks, Support and Resistance, Trends, chart patterns and continuation patterns.
►Trade Updates – Hit and Run Candlesticks
Added another long to the trade portfolio so now we are long 4 positions and short 2
Are you having trouble putting together a winning trade? Not sure what scans to use? So near to having multiple winning trades, but something always goes wrong. Maybe a couple hours with a trading coach could make all the difference in the world. Hit and Run Candlesticks has 4 trading coaches – Learn More about the Coaches
With on-demand recorded webinars, eBooks, and videos, member and non-member eLearning, plus the Live Trading Rooms, there is no end your trading education here at the Hit and Run Candlesticks, Right Way Options, Strategic Swing Trade Service and Trader Vision.
► OSUR – You would be up 72.97%% or $880.00
If you bought 100 shares when we posted to our members on March 23. Hit and Run Candlesticks members practice trade management and trade planning with Price and Candlesticks, The T-line, Trend, Trend Lines, Chart Patterns, Sup
port, and Resistance.
[button_1 text=”Learn%20The%20Life%20Of%20A%20Swing%20Trader” text_size=”32″ text_color=”#000000″ text_font=”Open Sans;google” text_bold=”Y” text_letter_spacing=”0″ subtext_panel=”Y” subtext=”Limited%20Time%20Offer%20-%20Annual%20Membership%2015%25%20Discount” subtext_size=”20″ subtext_color=”#e60acd” subtext_font=”Open Sans;google” subtext_letter_spacing=”0″ text_shadow_panel=”N” styling_width=”40″ styling_height=”30″ styling_border_color=”#000000″ styling_border_size=”1″ styling_border_radius=”6″ styling_border_opacity=”100″ styling_gradient_start_color=”#ffa035″ styling_gradient_end_color=”#ffa035″ drop_shadow_panel=”N” inset_shadow_panel=”N” align=”center” href=”https://ob124.infusionsoft.com/app/orderForms/Hit-and-Run-Candlesticks-Annual-Membership-65025″ new_window=”Y”/]
► Eyes On The Market (SPY)
We did get relief bounce as we thought we would and a darn good one at that. Unfortunately, it did not close over major resistance, so the Bulls have a great deal more work to do. The upper down trend line is still in play for the sellers and price is still above the cl
oud on a Morning Star signal (2-Day) chart. The sellers have the upper hand as far as the market goes as we start the day. There are many individual long trades that look great. But we are going to keep our inverse ETF list handy.
► What is a Trade Idea Watch-list?
A trade idea watchlist is a list of stocks that we feel will move in our desired direction over a swing trader’s time frame. That time could be one to 15 days for example. From that watch list, we wait until price action meets our conditions for a trade.
Rick’s personal trade ideas for the day MEMBERS ONLY
Start your education with wealth and the rewards of a Swing Traders Life – Click Here.
Investing and Trading involve significant financial risk and are not suitable for everyone. No communication from Hit and Run Candlesticks Inc. is financial or trading advice. All information is intended for Educational Purposes Only. Terms of Service.
Rick Saddler is not a licensed financial adviser nor does he offer trade recommendations or advice to anyone except for the trading desk of Hit and Run Candlesticks Inc.


Comments are closed.