Public Swing Trade Ideas August 29, 2016

Rick’s Featured Trade Ideas

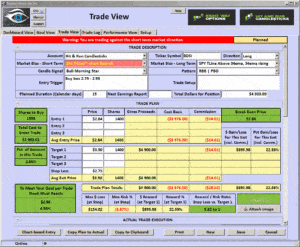
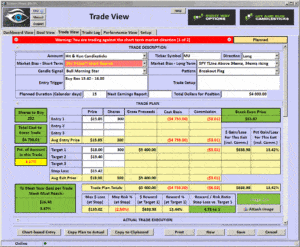
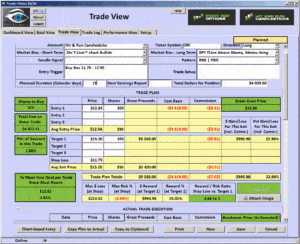
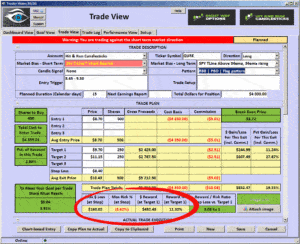
Today’s featured trade idea and my personal trade plan
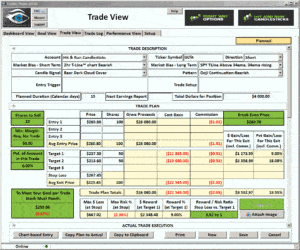
ULTA | Piercing | Doji Continuation

Double click the trade plan to enlarge

ULTA 8-29-2016Good Morning, Profit Traders,

The T-Line™ is a powerful timing indicator!
The close Friday suggested a little weakness in the SPY, but then again, after two Shooting Stars that formed a double top, what should we expect?  Near-term support looks to be about $215.35 and resistance about $217.95.  A close below $215.35 could send price to about $214.25, which is the 50-sma and the low of August 4, 2016.  The buyers need to come out of the woodwork and find the north side of $217.95 sooner rather than later; otherwise, the sellers will grow in numbers.  The VIX (VIX-X) has put together an impressive bottoming chart pattern, a little follow-though and price could be back to its 200-sma..

All the best to your trading success!
Rick | Hit and Run Candlestick Team
Trading knowledge ignites successful stock trading.
————————————————-
Members Daily Trade Ideas,
Reserved for member only – How about a 30-day $14.00 membership to try us out? Click Here
These are the stocks I put on my watch list to trade. I focus on these stocks for Swing Trades and the potential 10% – 40% gains.  You must follow your trading rules for entry stops, profits or loses. Remember to check for earnings!
Keep your eye on the inverse ETF’s They trade well!
Continue Reading

Public Swing Trade Ideas August 26, 2016

Rick’s Featured Trade Ideas

No trade ideas today, we should all have plenty on our watch list
Good Morning, Profit Traders,

The T-Line™ is a powerful timing indicator!

When following candlesticks/price action and chart patterns, one can clearly see the market is not doing very well, and as we all know, major news events will trump everything, meaning, if the market likes what comes out of Jackson Hole, this market could jump and fly higher.  Of course, it could also turn very ugly. Today, it is very possible we have a major news event coming out of Jackson Hole.
We still have an Evening Star Double Top and Support at the $217.-7ish level. This narrow range we have been in tells me ALL traders/investors are waiting for a clue.

All the best to your trading success!
Rick | Hit and Run Candlestick Team
Trading knowledge ignites successful stock trading.
————————————————-
Members Daily Trade Ideas,

No Trade Ideas Today

These are the stocks I put on my watch list to trade. I focus on these stocks for Swing Trades and the potential 10% – 40% gains.  You must follow your trading rules for entry stops, profits or loses. Remember to check for earnings!
Keep your eye on the inverse ETF’s They trade well!
Continue Reading

Public Swing Trade Ideas August 25, 2016

Rick’s Featured Trade Ideas

Today’s featured trade idea and my personal trade plan
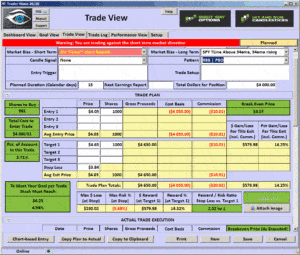
OZM | RBB | PBO  |On Support

Double click the trade plan to enlarge

OZM 8-2-2016Good Morning, Profit Traders,

The T-Line™ is a powerful timing indicator!
The SPY had bearish follow through yesterday on a failed high from the day before. Previous support has been $217.07ish only time will tell if it remains support. The SPY currently has 2 bearish shooting starts about a week apart, a trader just has to be concerned, (I know I am).
Many of the members have gone to cash or working themselves closer to cash. We all know that Jennet Yellen and Jackson Hole will play a big part in the future market direction and the SMART traders knows not to front run the news.
My friends there are times to be trading like a mad man and there are times to sit back and watch. What time is for you?
The 2 weakest sectors were Healthcare and Basic Materials and no sectors that lead the previous day.
All the best to your trading success!
Rick | Hit and Run Candlestick Team
Trading knowledge ignites successful stock trading.
————————————————-
Members Daily Trade Ideas,
Reserved for Members Only
These are the stocks I put on my watch list to trade. I focus on these stocks for Swing Trades and the potential 10% – 40% gains.  You must follow your trading rules for entry stops, profits or loses. Remember to check for earnings!
Keep your eye on the inverse ETF’s They trade well!
Continue Reading

Public Swing Trade Ideas August 24, 2016

Rick’s Featured Trade Ideas

Today’s featured trade idea and my personal trade plan
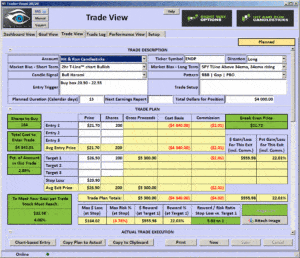
BDSI | RBB | PBO  | J-Hook

Double click the trade plan to enlarge

ENDP 8-24-2016Good Morning, Profit Traders,

The T-Line™ is a powerful timing indicator!
The Bulls were able to close the SPY over $218.90 on a very unfriendly candle.  We now have a Shooting Star that is still active and a double top with what could end up being another Shooting Star.
I think the market will be a bit crazy and unpredictable till we hear the outcome of the Jackson Hole Fed meetings.  It is very hard to be a super bull or a super bear right now.


All the best to your trading success!
Rick | Hit and Run Candlestick Team
Trading knowledge ignites successful stock trading.
————————————————-
Members Daily Trade Ideas,
Reserved for Members only
These are the stocks I put on my watch list to trade. I focus on these stocks for Swing Trades and the potential 10% – 40% gains.  You must follow your trading rules for entry stops, profits or loses. Remember to check for earnings!
Keep your eye on the inverse ETF’s They trade well!
Continue Reading

Public Swing Trade Ideas August 23, 2016 Public Webinar tonight Rm #2

Rick’s Featured Trade Ideas

Today’s featured trade idea and my personal trade plan
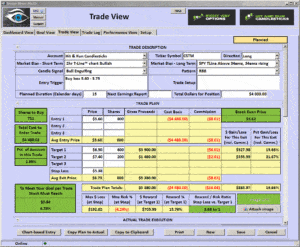
CSTM | Bullish Engulf

Double click the trade plan to enlarge

CSTM 8-23-2016Good Morning, Profit Traders,

The T-Line™ is a powerful timing indicator!

“Once you attach an assumption to a piece of evidence, you start to bend the narrative to support it.”  $218.90 remains the number for the bulls to beat in this slow grind up.  The Feds are not likely to raise rates any time soon and the market loves that idea.  Yesterday, the bulls held price over the T-Line™.  A close above $218.90 today could be the start of the next leg up, barring any bad news. Until the recent Shooting Star is dismissed by the bull, it is still a threat.

Yesterday we heard from one of our members that for the past six months, he has launched his account by 54%!  That’s FANTASTIC!


All the best to your trading success!
Rick | Hit and Run Candlestick Team
Trading knowledge ignites successful stock trading.
————————————————-
Members Daily Trade Ideas,
Reserved for Members Only
These are the stocks I put on my watch list to trade. I focus on these stocks for Swing Trades and the potential 10% – 40% gains.  You must follow your trading rules for entry stops, profits or loses. Remember to check for earnings!
Keep your eye on the inverse ETF’s They trade well!
Continue Reading

Public Swing Trade Ideas August 22, 2016

Rick’s Featured Trade Ideas

Today’s featured trade idea and my personal trade plan
BDSI | RBB | PBO  | J-Hook

Double click the trade plan to enlarge

BDSI 8-22-2016Good Morning, Profit Traders,

The T-Line™ is a powerful timing indicator!

Friday I wrote,The real test for the buyers is if they can close up above $218.60.  This was for the very near term.  The buyers failed to close over $218.60.  Last week I warned about the Bearish Shooting Star on the daily chart and the Bearish Island Reversal on the intraday charts.  These are warning signs that the bull may be getting tired and in need of a rest.  A test of the $217.02 low is still possible, followed by the 34 ema area.  A breakout over $218.90 would put new life in the bull run.  The outcome of Jackson Hole will likely play a part in how the market finishes up this week.
All the best to your trading success!
Rick | Hit and Run Candlestick Team
Trading knowledge ignites successful stock trading.
————————————————-
Members Daily Trade Ideas, we might also want to keep or eye on a few shorts or inverse ETF’s
Members Only, Members trade ideas can be found in the members area
These are the stocks I put on my watch list to trade. I focus on these stocks for Swing Trades and the potential 10% – 40% gains.  You must follow your trading rules for entry stops, profits or loses. Remember to check for earnings!
Keep your eye on the inverse ETF’s They trade well!
Continue Reading

Public Swing Trade Ideas August 19, 2016

Rick’s Featured Trade Ideas

Today’s featured trade idea and my personal trade plan
MU | Break out | Flag| 3-day continuation pattern

Double Click on the Chart to Enlarge

MU 8-19-2016Good Morning, Profit Traders,

The T-Line™ is a powerful timing indicator

Trading Room Talk – In our premarket rundown yesterday, I shared how $218.90 would be resistance and the bulls needed to recapture it.  The high yesterday was $218.90, and we are seeing push back this morning.  Here is yesterday’s note on this: “After looking at my intraday charts (30-min, 60-min, 2-hour and 4-hour), I can see a bearish Island Reversal that may keep pressure on the buyers.  Unless the buyers can push us back over $218.90, there is a good chance we see a test of yesterday’s low or lower.”

Wednesday we sought out $217.07 as support, and the supporting low ended up being $217.02.  A push below the T-Line™ could push price into testing Wednesday’s low.  Just throwing this out there.  If $201.07 is breached, $216.45 is possible.   Just saying…

All the best to your trading success!
Rick | Hit and Run Candlestick Team
Trading knowledge ignites successful stock trading.

Each day a trade idea list is posted in the members area that I believe are poised to move 10-20% (or more) within the next few days.  Please follow your trading rules for entry stops and profits. Remember to check for earnings!

Members Only Click Here
Continue Reading

Public Swing Trade Ideas August 18, 2016

Rick’s Featured Trade Ideas

Today’s featured trade idea and my personal trade plan
CRC | RBB | PBO| 2-day Morning Star

Double click on chart to enlarge

CRC 8-18-2016Good Morning, Profit Traders,

The T-Line™ is a powerful timing indicator
Trading Room Talk – Once again, the Feds believe the US growth numbers are not healthy enough to raise rates, so let’s pump, pump, pump that money into the market and falsely keep it going up.  OK, I now have that out of my system.  On the daily chart, price closed above the T-Line™ with a nice comeback lower wick.

After looking at my intraday charts (30-min, 60-min, 2-hour and 4-hour), I can see a bearish Island Reversal that may keep pressure on the buyers.  Unless the buyers can push us back over $218.90, there is a good chance we see a test of yesterday’s low or lower.

All the best to your trading success!
Rick | Hit and Run Candlestick Team
Trading knowledge ignites successful stock trading.
Continue Reading

Public Swing Trade Ideas August 17, 2016 FOMC updates today - Caution

Rick’s Featured Trade Ideas

Today’s featured trade idea and my personal trade plan
QURE | RBB |  PBO|

QURE 8-17-16Good Morning, Profit Traders,

The T-Line™ is a powerful timing indicator
Trading Room Talk – The SPY closed below the T-Line™ confirming a Evening Star Signal formation.  We did put on a TZA and UVXY trade to hedge some of our longs.  Overall, the SPY and the other indices remain bullish.  This pullback, until confirmed bearish, remains a bullish pullback.  A close below $216.50 on the SPY could cause a little panic and start a retracement test of the August lows.  The VIX posted gains yesterday that did, in fact, close above $12.50.  A positive close above $12.50 today will be a sign that a little fear is starting to turn up.
All the best to your trading success!
Rick | Hit and Run Candlestick Team
Trading knowledge ignites successful stock trading.
Continue Reading

Public Swing Trade Ideas August 16, 2016 Member E-Learning tonight 8pm east

Rick’s Featured Trade Ideas

Today’s featured trade idea and my personal trade plan
PTCT | Flat Flag Breakout |
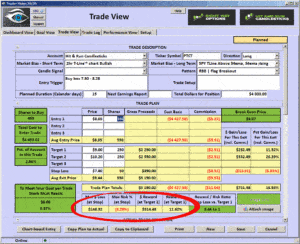
PTCT 8-16-2016
Good Morning, Profit Traders,

The T-Line™ is a powerful timing indicator
Trading Room Talk – The SPY closed up .29% but closed off the highs with a candle wick. At the close yesterday, we talked about how this could be suggesting a little profit taking today.  I see the SPY is opening lower.  If you take a look at the SPY hourly chart, you can see a clear bearish Cradle pattern, which, of course, needs confirmation.  We might want to watch the market with a tiny bit of concern below $218.90.

In yesterday’s note, I mentioned that the VIX is playing around with the oversold area.  It is also trying to put together a relief rally bottom (no confirmation yet).  Above $12.50, you should start to hear chatter about the VIX.

All the best to your trading success!
Rick | Hit and Run Candlestick Team
Trading knowledge ignites successful stock trading.

Yesterday’s Close
SPY:  T-Line™ & 30-min chart | Profit takers control
IWM:  T-Line™ & 30-min chart | Danger zone
SMH:  T-Line™ & 30-min chart | Danger zone
IYT:  T-Line™ & 30-min chart | Profit takers control
DIA:  T-Line™ & 30-min chart | Profit takers control
USO:  T-Line™ & 30-min chart | Bullish
UUP:  T-Line™ & 30-min chart | Profit takers control
VIX: T-Line™ & 30-min chart | Buyers control

Each day a trade idea list is posted in the members area that I believe are poised to move 10-20% (or more) within the next few days.  Please follow your trading rules for entry stops and profits. Remember to check for earnings!

Members Only
Keep your eye on the inverse ETF’s They trade well!

Investing and Trading involves significant financial risk and is not suitable for everyone. No communication or chat sessions should be considered as financial or trading advice. All information is intended for Educational Purposes Only.

VXX S&P 500 VIX Short Term Futures:  A close above the T-Line ™ implies the bullish short-term swing traders are in control.  A close below the T-Line ™ implies the bearish short-term swing traders are in control. 
Energy Sector: XLE, SX90, ERX, USO  A close above the T-Line ™  implies the bullish short-term swing traders are in control. A close below the T-Line ™ implies the bearish short-term swing traders are in control. 
SMH: A close above the  T-Line ™ implies the above short-term swing traders are in control. A close below the T-Line ™ implies the bearish short-term swing traders are in control. 

IYT: A close above the  T-Line ™ implies the above short-term bullish swing traders are in control. A close below the T-Line ™ implies the bearish short-term swing traders are in control. 

US Dollar Index: UUP, DXYO A close above the  T-Line ™  implies the bullish short-term swing traders are in control. A close below the T-Line ™ implies the bearish short-term swing traders are in control.  Learn more about the T-Line – Click Here

The information in this email and Blog Post are notes to myself and should NOT be construed as financial or trading advice.

Investing and Trading involves significant financial risk. No communication should be construed as financial or trading advice. All information provided is for Educational Purposes Only.

Investing and Trading involves significant financial risk and is not suitable for everyone. No communication or chat sessions should be considered as financial or trading advice. All information is intended for Educational Purposes Only.

http://hitandruncandlesticks.com Trading for Profit is not an investment advisory service, nor a registered investment advisor or broker-dealer and does not tell or suggest which securities or currencies customers or subscriber should buy or sell. The analysts and employees or affiliates of Company may hold positions in the stocks, currencies or industries discussed here.