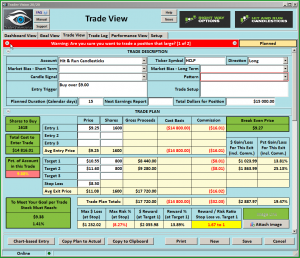
FEYE – Has Formed a Bullish Ascending Triangle

FEYE – Has Formed a Bullish Ascending Triangle

FEYE – Has Formed a Bullish Ascending Triangle(FireEye Inc.) $FEYE has formed a Bullish Ascending Triangle, and on the 3-day chart, it can be traded using the Rounded Bottom Breakout Strategy. The T-Line continues to trend in spite of the choppy price the past 3 months. Looking back to July 7th we can see a Bullish Morning Star, a Double Bottom and a minor breakout with consolidation. Volatility stops are we positioned on the daily and the 3-day charts. (Disclosure – Hit and Run Candlesticks bought FEYE yesterday)

Learn more about Hit and Run Candlesticks, and today’s trade idea and plan plus the 10 or more members trade ideas, starting at 9:10 EST AM every morning. Every day we teach and trade using the T-Line, Candlesticks, Support and Resistance, Trends, chart patterns and continuation patterns.

Trade Updates

Hit and Run Candlesticks closed NVAX yesterday with a small gain, in hind sight, we should have closed it sooner. We will wait for another buy alert. We entered 2 more trades yesterday, and we are still holding 4 Double -Digit gainers and 7 single digit gainers with a few still waiting.

What would you do with 2-3 or even 4 double-digit trades every week? Education on how to manage a trade from start to finish is key to a swing traders profits.

With on-demand recorded webinars, eBooks, and videos, member and non-member eLearning, plus the Live Trading Rooms, there is no end your trading education here at the Hit and Run Candlesticks, Right Way Options, Strategic Swing Trade Service and Trader Vision.


$DVAX was first presented to HRC members on March 1,

And yesterday it ran another 10.94% for a total of 136.67%. Another chart that has worked out very well for Hit and Run Candlestick Members. Hit and Run Candlesticks members have learned how important it is to follow price with Candlesticks and manage their trades using The T-line, Trend, Trend Lines, Support, and Resistance.


Eyes On The Market

A few big names will be reporting today so as always be aware and trade with caution. Yesterday the market was controlled by the bulls for the most part. The T-Line trend is still intact with no sell signal posted yesterday.

What is a Trade Idea Watch-list?

A trade idea watchlist is a list of stocks that we feel will move in our desired direction over a swing trader’s time frame.  That time could be one to 15 days for example. From that watchlist, we wait until price action meets our conditions for a trade.

MEMBERS ONLY


Investing and Trading involve significant financial risk and are not suitable for everyone. No communication from Hit and Run Candlesticks Inc. is financial or trading advice. All information is intended for Educational Purposes Only. Terms of Service.

Rick Saddler is not a licensed financial adviser nor does he offer trade recommendations or advice to anyone except for the trading desk of Hit and Run Candlesticks Inc.

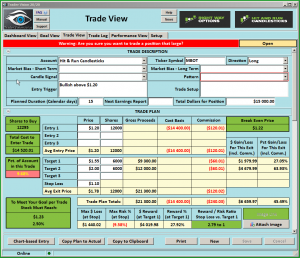
 

TGH – Has Broken Out Of A Bullish W Pattern

TGH – Has Broken Out Of A Bullish W Pattern

TGH – Has Broke Out Of A Bullish W Pattern(Textainer Group Holdings Ltd) After about 2 weeks TGH has broken out of a Bullish W pattern and a Bearish downtrend line. $TGH has consolidated for about 2 weeks trying to put a trade together, last week a Bullish Morning Star was formed and led to Friday’s breakout. Trade with extream caution in current market condition.

Learn more about Hit and Run Candlesticks, and today’s trade idea and plan plus the 10 or more members trade ideas, starting at 9:10 EST AM every morning. Every day we teach and trade using the T-Line, Candlesticks, Support and Resistance, Trends, chart patterns and continuation patterns.

Trade Updates

A few stock we are holding are PLUG, HIIQ, KTOS, HZNP, VEX, P, IPI, CBAY; we also have a few that are not green, but that is not in any danger as of Friday’s close.

What would you do with 2-3 or even 4 double-digit trades every week? Education on how to manage a trade from start to finish is key to a swing traders profits.

With on-demand recorded webinars, eBooks, and videos, member and non-member eLearning, plus the Live Trading Rooms, there is no end your trading education here at the Hit and Run Candlestick, Right Way Option, Strategic Swing Trade Service and Trader Vision.


$XGTI was first presented to HRC members on May 24,

A ran another 5.15% Friday for a total  of 26.94% from the May 24 call. Another case of knowing how to manage a chart with Candlesticks, The T-Line, and Support and resistance.


Eyes On The Market

This is going to be a crazy week for earnings therefore Hit and Run Candlesticks we are taking a very protective and cautious stance when trading this week. Out trading is likely to be very light.


The SPY, IWM and Q’s closed over the bullish trending T-Line while the DIA closed a bit weak. It will be very important that the T-Line continues to trend with the Bulls this week. Support is at the $245.00 area for the SPY.

Over all the market is bullish, price leading the T-Line and support doing its job as of yesterday. 2 ETF’s that might help with the market overview is (VTI) Total Stock Market ETF and (VT) Total World ETF. IWM finally broke out.

What is a Trade Idea Watch-list?

A trade idea watchlist is a list of stocks that we feel will move in our desired direction over a swing trader’s time frame.  That time could be one to 15 days for example. From that watchlist, we wait until price action meets our conditions for a trade.

MEMBERS ONLY


Investing and Trading involve significant financial risk and are not suitable for everyone. No communication from Hit and Run Candlesticks Inc. is financial or trading advice. All information is intended for Educational Purposes Only. Terms of Service.

Rick Saddler is not a licensed financial adviser nor does he offer trade recommendations or advice to anyone except for the trading desk of Hit and Run Candlesticks Inc.
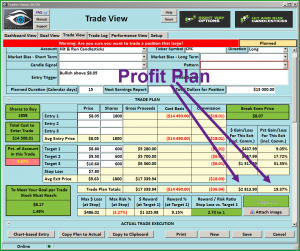
 

Friday Is The Day We Count Our Money

Friday Is The Day We Count Our Money

(It’s Friday) Friday is the day we count our money and reflect on our weeks trading. How did we do? How can we improve? Take time today to pause on trading and consider education. Reevaluate trading goals, are the goals on track?

Learn more about Hit and Run Candlesticks, and today’s trade idea and plan plus the 10 or more members trade ideas, starting at 9:10 EST AM every morning. Every day we teach and trade using the T-Line, Candlesticks, Support and Resistance, Trends, chart patterns and continuation patterns.

HRC Trading Stats

Below you will find the Hit and Run Candlesticks trading stats for the past 30 days.

HRC Trading Stats


We are currently holding 2 double digit winners 8 single digit winners, 9 within 2% of breaking even. We will continue to manage our trades looking for good solid swings.

What would you do with 2-3 or even 4 double-digit trades every week? Education on how to manage a trade from start to finish is key to a swing traders profits.

With on-demand recorded webinars, eBooks, and videos, member and non-member eLearning, plus the Live Trading Rooms, there is no end your trading education here at the Hit and Run Candlestick, Right Way Option, Strategic Swing Trade Service and Trader Vision.


$AGEN was first presented to HRC members on July 5,

With a 3.07% move yesterday the total  now 25.75%. Another case of knowing how to manage a chart with Candlesticks, The T-Line, and Support and resistance and the trend.


Eyes On The Market

The market remains bullish with Thursday’s close. SPY, IWM QQQ, and DIA all above the T-Line and trending. The transports are a little weak (caution). Continue to manage the trades that are working for you.

What is a Trade Idea Watch-list?

A trade idea watchlist is a list of stocks that we feel will move in our desired direction over a swing trader’s time frame.  That time could be one to 15 days for example. From that watchlist, we wait until price action meets our conditions for a trade.

Each day Hit and Run Candlesticks shares with members 10-15 trade ideas for the watchlist.


Investing and Trading involve significant financial risk and are not suitable for everyone. No communication from Hit and Run Candlesticks Inc. is financial or trading advice. All information is intended for Educational Purposes Only. Terms of Service.

Rick Saddler is not a licensed financial adviser nor does he offer trade recommendations or advice to anyone except for the trading desk of Hit and Run Candlesticks Inc.
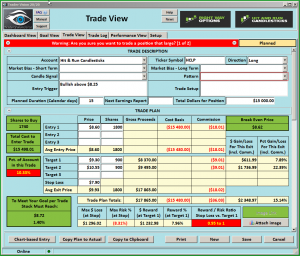
 

BAS – Bullish T-Line Run PBO

BAS – Bullish T-Line Run PBO

BAS – Bullish T-Line Run PBO(Basic Energy Service INC) $BAS Bullish T-Line Run PBO. BAS starterd it’s reversal with a Hammer on the daily chart or a Bullish Morning Start on the 2-day chart. The T-Line Run went to the 50-sma followed buy a PBO (Pull Back Opportunity) BAS is now a RBB stratagy with a Bullish Inverted Head and Shoulders and still a T-Line Run.

Learn more about Hit and Run Candlesticks, and today’s trade idea and plan plus the 10 or more members trade ideas, starting at 9:10 EST AM every morning. Every day we teach and trade using the T-Line, Candlesticks, Support and Resistance, Trends, chart patterns and continuation patterns.

Trade Updates

We sold DEPO yesterday for a 6.05 loss, and we are still holding IPI +23.56% and HIIQ 18.38% We have 3 more about to become double digit trades.

What would you do with 2-3 or even 4 double-digit trades every week? Education on how to manage a trade from start to finish is key to a swing traders profits.

With on-demand recorded webinars, eBooks, and videos, member and non-member eLearning, plus the Live Trading Rooms, there is no end your trading education here at the Hit and Run Candlestick, Right Way Option, Strategic Swing Trade Service and Trader Vision.


$CAR was first presented to HRC members on June 1,

With a 3.92% move yesterday the total  now 42.55%. Another case of knowing how to manage a chart with Candlesticks, The T-Line, and Support and resistance.


Eyes On The Market

Over all the market is bullish, price leading the T-Line and support doing its job as of yesterday. 2 ETF’s that might help with the market overview is (VTI) Total Stock Market ETF and (VT) Total World ETF. IWM finally broke out.

What is a Trade Idea Watch-list?

A trade idea watchlist is a list of stocks that we feel will move in our desired direction over a swing trader’s time frame.  That time could be one to 15 days for example. From that watchlist, we wait until price action meets our conditions for a trade.

MEMBERS ONLY


Investing and Trading involve significant financial risk and are not suitable for everyone. No communication from Hit and Run Candlesticks Inc. is financial or trading advice. All information is intended for Educational Purposes Only. Terms of Service.

Rick Saddler is not a licensed financial adviser nor does he offer trade recommendations or advice to anyone except for the trading desk of Hit and Run Candlesticks Inc.
 

CZR And The Bullish J-Hook Continuation Pattern

CZR And The Bullish J-Hook Continuation Pattern

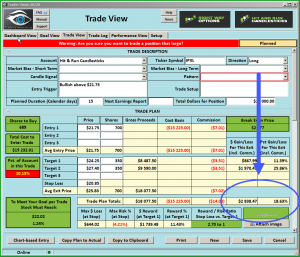
CZR And The Bullish J-Hook Continuation Pattern(Caesars Entertainment Corp) $CZR and The Bullish J-Hook Continuation Pattern Breakout is easy to spot and easy to trade with a trading plan. The 34-ema has been trending while price pulled back to the 50-sma, printed a Bullish Piercing candle followed by a Bullish T-Line Run. Yesterday cleared resistance for the next leg. The 2-Day chart printed a Bullish Morning Star signal on the PBO support line.Learn more about Hit and Run Candlesticks, and today’s trade idea and plan plus the 10 or more members trade ideas, starting at 9:10 EST AM every morning. Every day we teach and trade using the T-Line, Candlesticks, Support and Resistance, Trends, chart patterns and continuation patterns.

Trade Updates

We sold ADRX yesterday for a double digit profit, and we are still holding IPI and HIIQ both double digits.We are still holding IPI +20.08 ARDX +21.59%

What would you do with 2-3 or even 4 double-digit trades every week? Education on how to manage a trade from start to finish is key to a swing traders profits.

With on-demand recorded webinars, eBooks, and videos, member and non-member eLearning, plus the Live Trading Rooms, there is no end your trading education here at the Hit and Run Candlestick, Right Way Option, Strategic Swing Trade Service and Trader Vision.


$FOLD was first presented to HRC members on June 1,

With a 7% move yesterday the total  now 72%. Another case of knowing how to manage a chart with Candlesticks, The T-Line, and Support and resistance.


Eyes On The Market

Over all the market is bullish, price leading the T-Line and support doing its job as of yesterday. 2 ETF’s that might help with the market overview is (VTI) Total Stock Market ETF and (VT) Total World ETF.

What is a Trade Idea Watch-list?

A trade idea watchlist is a list of stocks that we feel will move in our desired direction over a swing trader’s time frame.  That time could be one to 15 days for example. From that watchlist, we wait until price action meets our conditions for a trade.

MEMBERS ONLY

Investing and Trading involve significant financial risk and are not suitable for everyone. No communication from Hit and Run Candlesticks Inc. is financial or trading advice. All information is intended for Educational Purposes Only. Terms of Service.

Rick Saddler is not a licensed financial adviser nor does he offer trade recommendations or advice to anyone except for the trading desk of Hit and Run Candlesticks Inc.
 

VSTM Is Pulling Back To Our T-Line

VSTM Is Pulling Back To Our T-Line

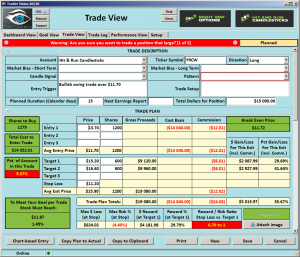
VSTM Is Pulling Back To Our T-Line(Verastem Inc) $VSTM is pulling back to our T-Line, and the V Stop support dots on lower volume. $VSTM broke out a few days ago (3-day chart a flag breakout)and now set up for a possible buy signal; we have VSTM on our trade watch-list for an entry and swing trade.

Learn more about Hit and Run Candlesticks, and today’s trade idea plus the 10 or more members trade ideas, starting at 9:10 EST AM every morning. Every day we teach and trade using the T-Line, Candlesticks, Support and Resistance, Trends, chart patterns and continuation patterns.

We are still holding IPI +20.08 ARDX +21.59%

What would you do with 2-3 or even 4 double-digit trades every week? Education on how to manage a trade from start to finish is key to a swing traders profits.

With on-demand recorded webinars, eBooks, and videos, member and non-member eLearning, plus the Live Trading Rooms, there is no end your trading education here at the Hit and Run Candlestick, Right Way Option, Strategic Swing Trade Service and Trader Vision.


$AGEN was first presented to HRC members on July 5,

Now up 15% with a 5% run yesterday The Rounded Bottom Breakout pattern target direction is the 200-sma and leads to a breakout of the 200-sma a great many times. AGEN is now in a continuation pattern with the 200-sma supporting the move.

Eyes On The Market

After 3 Bullish bars, the doji yesterday is signaling a day of rest. The overall market is still signaling the bulls have control. The 3-Day chart on the SPY is showing a Bullish Engulf Flag Breakout with following through – Bullish pattern

What is a Trade Idea Watch-list?

A trade idea watchlist is a list of stocks that we feel will move in our desired direction over a swing trader’s time frame.  That time could be one to 15 days for example. From that watchlist, we wait until price action meets our conditions for a trade.

MEMBERS ONLY

Investing and Trading involve significant financial risk and are not suitable for everyone. No communication from Hit and Run Candlesticks Inc. is financial or trading advice. All information is intended for Educational Purposes Only. Terms of Service.

Rick Saddler is not a licensed financial adviser nor does he offer trade recommendations or advice to anyone except for the trading desk of Hit and Run Candlesticks Inc.
 

UEC Broke Out With A T-Line Run

UEC Broke Out With A T-Line Run

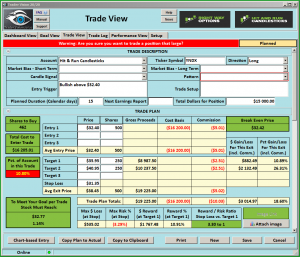
UEC Broke Out With A T-Line Run(Uranium Energy Corp) $UEC broke out with a T-Line Run and finished Friday with a Bullish Morning Star. Step back, and you can see a Bullish Inverted Head and Shoulder in the chart. Using the 3-day chart, you can see a Bullish Cup and Handle. UES could be set up to challenge the 2015 High’s

Learn more about Hit and Run Candlesticks, and today’s trade idea plus the 10 or more members trade ideas, starting at 9:10 EST AM every morning. Every day we teach and trade using the T-Line, Candlesticks, Support and Resistance, Trends, chart patterns and continuation patterns.

Our 3 biggest holdings are IPI and ARDX and HIIQ

Education on how to manage a trade from start is key yo Swing Trading wealth.

With on-demand recorded webinars, eBooks, and videos, member and non-member eLearning, plus the Live Trading Rooms, there is no end your trading education here at the Hit and Run Candlestick, Right Way Option, Strategic Swing Trade Service and Trader Vision.


$OZM was first presented to HRC members on June 5,

Now up 28.10% with a run of 8.39% Friday. Many of our members are being rewarded for there for their education and understanding of how a trade is managed. Great Job!!

Eyes On The Market

The SPY had .47% day which was enough to close at a new high $245.56; the Bulls have had a fun few days with the gap and 3 days of follow through.

What is a Trade Idea Watch-list?

A trade idea watchlist is a list of stocks that we feel will move in our desired direction over a swing trader’s time frame.  That time could be one to 15 days for example. From that watchlist, we wait until price action meets our conditions for a trade.

MEMBERS ONLY


Investing and Trading involve significant financial risk and are not suitable for everyone. No communication from Hit and Run Candlesticks Inc. is financial or trading advice. All information is intended for Educational Purposes Only. Terms of Service.

Rick Saddler is not a licensed financial adviser nor does he offer trade recommendations or advice to anyone except for the trading desk of Hit and Run Candlesticks Inc.
 

MVIS Broke out of a Bullish W Pattern

MVIS Broke out of a Bullish W Pattern

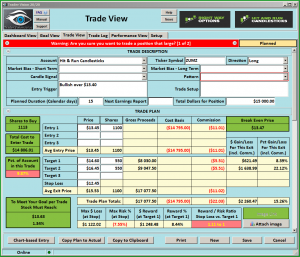
MVIS Broke out of a Bullish W Pattern(Microvision Inc) $MVIS broke out of a Bullish W Pattern with a strong 20% candle after a double bottom. Then on the 2-Day chart rested for four bars followed by a Bullish Morning Star and Bullish Follow through, while holding a T-Line Run for 8 bars.

Learn more about Hit and Run Candlesticks, and today’s trade idea plus the 10 or more members trade ideas, starting at 9:10 EST AM every morning. Every day we teach and trade using the T-Line, Candlesticks, Support and Resistance, Trends, chart patterns and continuation patterns.

We are still holding IPI +15.95 ARDX +24.74%

Education on how to manage a trade from start to finish is vital to a swing traders success.

With on-demand recorded webinars, eBooks, and videos, member and non-member eLearning, plus the Live Trading Rooms, there is no end your trading education here at the Hit and Run Candlestick, Right Way Option, Strategic Swing Trade Service and Trader Vision.


$HTZ was first presented to HRC members on June 29,

Now up 35.52% with a run of 15.75% yesterday. Many of our members took ½ off the table yesterday and raised the stop on the second ½. -Good Trading


Eyes On The Market

As of the close yesterday the Bulls are still winning the game but getting tired and maybe needing a little rest. Maybe just a rest back to support.

What is a Trade Idea Watch-list?

A trade idea watchlist is a list of stocks that we feel will move in our desired direction over a swing trader’s time frame.  That time could be one to 15 days for example. From that watchlist, we wait until price action meets our conditions for a trade.

MEMBERS ONLY

Investing and Trading involve significant financial risk and are not suitable for everyone. No communication from Hit and Run Candlesticks Inc. is financial or trading advice. All information is intended for Educational Purposes Only. Terms of Service.

Rick Saddler is not a licensed financial adviser nor does he offer trade recommendations or advice to anyone except for the trading desk of Hit and Run Candlesticks Inc.
 

P Is Building A J-Hook Continuation Pattern

P Is Building A J-Hook Continuation Pattern

P Is Building A J-Hook Continuation Pattern(Pandora Media Inc) $P is building a J-Hook continuation pattern after a 8 day run to the 50-sma. The pullback ended with a Bullish Engulf, the follow through ended yesterday with a Doji, now creating a Doji Continuation pattern. Other patterns and signal involved are Inverse Head and Shoulder, POB to the 38% Fib line. 2-day chart is supporting a Bullish Morning Star Signal

Learn more about Hit and Run Candlesticks, and today’s trade idea plus the 10 or more members trade ideas, starting at 9:10 EST AM every morning. Every day we teach and trade using the T-Line, Candlesticks, Support and Resistance, Trends, chart patterns and continuation patterns.

We are still holding ARDX 22.64% profit

Education on how to manage a trade from start to finish is vital to a swing traders success.

With on-demand recorded webinars, eBooks, and videos, member and non-member eLearning, plus the Live Trading Rooms, there is no end your trading education here at the Hit and Run Candlestick, Right Way Option, Strategic Swing Trade Service and Trader Vision.

[button_1 text=”%2485.00%20a%20Month%20Cancel%20Anytime%20-%20Keep%20what%20you%20learn%20and%20you%20will%20learn%20a%20lot” text_size=”27″ text_color=”#000000″ text_bold=”Y” text_letter_spacing=”0″ subtext_panel=”Y” subtext=”Take%20A%20Look” subtext_size=”19″ subtext_color=”#f40606″ subtext_bold=”Y” subtext_letter_spacing=”0″ text_shadow_panel=”N” styling_width=”40″ styling_height=”30″ styling_border_color=”#000000″ styling_border_size=”1″ styling_border_radius=”6″ styling_border_opacity=”100″ styling_shine=”Y” styling_gradient_start_color=”#ffff00″ styling_gradient_end_color=”#ffa035″ drop_shadow_panel=”N” inset_shadow_panel=”N” align=”center” href=”https://hitandruncandlesticks.com/hit-and-run-candlesticks/” new_window=”Y”/]


$SPWR was first presented to HRC members on May 31

Now up 24.66%. And popped 12.39% yesterday. SPWR was a Rounded Bottom Breakout and nailed it by the numbers on the daily chart. The 2-day chart is still a Rounded Bottom Breakout pattern, and it looks like another 25% is in the sun.


Eyes On The Market

Yesterday the market loved everything about Miss Janet, will today be the same? Price gapped and held above the downtrend line on the SPY turning the T-Line back up. Stay cautious and let’s make money.

What is a Trade Idea Watch-list?

A trade idea watchlist is a list of stocks that we feel will move in our desired direction over a swing trader’s time frame.  That time could be one to 15 days for example. From that watchlist, we wait until price action meets our conditions for a trade.

MEMBERS ONLY

Investing and Trading involve significant financial risk and are not suitable for everyone. No communication from Hit and Run Candlesticks Inc. is financial or trading advice. All information is intended for Educational Purposes Only. Terms of Service.

Rick Saddler is not a licensed financial adviser nor does he offer trade recommendations or advice to anyone except for the trading desk of Hit and Run Candlesticks Inc.


HZNP Printed A Bullish Engulf Yesterday

HZNP Printed A Bullish Engulf Yesterday

HZNP Printed A Bullish Engulf Yesterday (Horizon Pharma PLC) $HZNP printed a Bullish Engulf yesterday after a 3 Doji pull back. The price action has been rising with the T-Line and the 34-ema crossing over the 50-sma. The past 5 days has created a Pop Out OF The Box Pattern. Learn more about Hit and Run Candlesticks, and today’s trade idea plus the 10 or more members trade ideas, starting at 9:10 EST AM every morning.


We are still holding IPI Plus 13.79%

Education on how to manage a trade from start to finish is vital to a swing traders success.

With on-demand recorded webinars, eBooks, and videos, member and non-member eLearning, plus the Live Trading Rooms, there is no end your trading education here at the Hit and Run Candlestick, Right Way Option, Strategic Swing Trade Service and Trader Vision.


BAS was first presented to HRC members on June 28,

Now up 13.02%. BAS started out as a Pinball set-up then went into the Rounded Bottom Breakout. With a rally followed by a Bullish Morning Star, PBO BAS looks ready to follow through on a J-Hook continuation pattern.


Eyes On The Market

Today is the start of Miss Janet talking to Congress; I suspect the market will be a bit dizzy before it makes a direction decision. Plus, earnings season is about to kick off. I find it very helpful if I watch what price does and compare it to the T-Line performance.

What is a Trade Idea Watch-list?

A trade idea watchlist is a list of stocks that we feel will move in our desired direction over a swing trader’s time frame.  That time could be one to 15 days for example. From that watchlist, we wait until price action meets our conditions for a trade.

MEMBERS ONLY


Investing and Trading involve significant financial risk and are not suitable for everyone. No communication from Hit and Run Candlesticks Inc. is financial or trading advice. All information is intended for Educational Purposes Only. Terms of Service.

Rick Saddler is not a licensed financial adviser nor does he offer trade recommendations or advice to anyone except for the trading desk of Hit and Run Candlesticks Inc.