Price Action, Chart Pattern, Trend, Support FREE Swing Trade Ideas
Price Action, Chart Pattern, Trend, Support
Price Action, Chart Pattern, Trend, Support, and Resistance are playing nice. The close of yesterday the six most important chart indicators are working together.
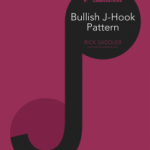
Price action is making higher lows and higher highs, we have come out of a Bullish “W” pattern, currently working on a cup. A Bullish J-Hook is setting up, and I see a possible Doji continuation pattern. The T-Line is trending; price is above support with one resistance hurdle. Bar any bad news the SPY should follow the path of the QQQs.
 FREE Trade Idea – LABD
LABD printed a Bullish Engulf followed by positive Bullish follow. Yesterday price closed over the 34 and 50 moving averages creating our Rounded Bottom Breakout. Possible Bullish “W” pattern may come clear.
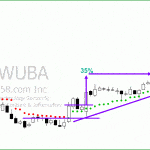
Charts To Study – PBI
PBI has run 17.41% after we informed our members that it was ready to produce on April 27, 2017.
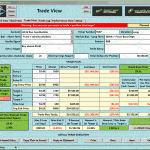
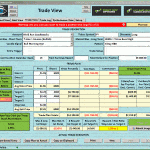
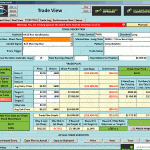
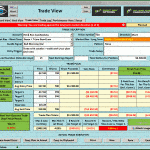
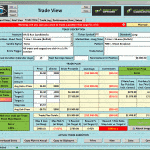
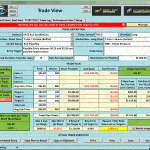
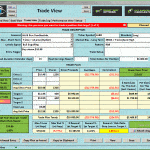
Members Swing Trade Ideas
We post to HRC members 10-15 swing trade ideas each day and post them in the member’s area of the website.
10-15 trade ideas below – for members only
What is a Trade Idea Watch List?
A trade idea watch list is a list of stocks that we feel will move in our desired direction over a swing trader’s time frame. That time could be one to 30 days for example.
From that watchlist, we wait until price action meets our conditions for a trade.
Investing and Trading involve significant financial risk and is not suitable for everyone. No communication from Hit and Run Candlesticks Inc. is not financial or trading advice. All information is intended for Educational Purposes Only. Terms of Service
Campbell or this website is not financial or trading advice. All information is intended for Educational Purposes Only.