
Second star to the right and straight on till morning! Well, not quite, Peter Pan. Those directions will take you to Neverland, but if you’re looking for a Shooting Star candlestick pattern, you’ll need better directions. This bearish reversal signal, which looks uncannily like the Inverted Hammer, is found at the end of an uptrend and heralds a falling price. It is formed by a single candle with a short body, little or no lower shadow, and a very long upper shadow. If you’re wondering exactly what a Shooting Star candlestick pattern looks like or what it might mean for future prices, scroll down. Everything you need to know is below . . .
Shooting Star Candlestick Pattern
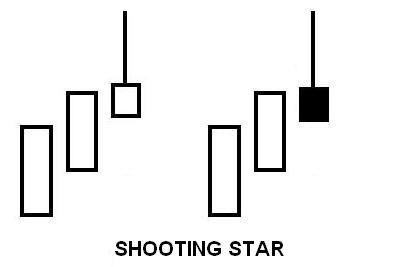
Formation
The Shooting Star candlestick pattern is composed of a single candle, and it looks quite like the Inverted Hammer in appearance. However, as with many candlestick signals, it’s important to consider the candle’s context. A Shooting Star won’t occur at the end of a downtrend, for example. If you’re trying to identify a Shooting Star, look for the following criteria:
First, the candlestick must occur after an uptrend. This should be easy to remember because, as a shooting star, it makes sense for the signal to occur high up, after the price has shot upward. Second, the candlestick must have a short body. Third, the lower shadow must be nonexistent or very small. Fourth, the upper shadow (which conveys the extent of the price movement) must be long, at least twice the length of the real body. This long upper shadow gives the signal its name because, when combined with the small body and the location after an uptrend, it resembles a shooting star.
Meaning
So what does it mean if you spot a Shooting Star candlestick pattern? First of all, don’t make a wish—this isn’t that type of star! Because the Shooting Star is a bearish reversal signal, you know that it is indicating that the price has reached the top of its current uptrend and will soon fall. Basically, the bulls were in command, pushing the prices higher and into an established uptrend. The bulls continued pushing after the market’s open, but then the bears stepped in. The price was driven back down, and it closed near its starting point. The bulls lost control after a period of command.
To better translate the signal’s formation, look for the following characteristics:
- If there is a gap between the real body of the previous period and this period, the likelihood of a strong reversal is high.
- The color of the body is unimportant, but a black body conveys bearish implications.
- The longer the upper shadow, the higher the potential for a reversal.
– – – – –
Traders with open long positions may wish to take heed of the Shooting Star candlestick pattern and close their trades. Traders with new short positions might see it as an opportunity for greater profits. To confirm a Shooting Star, check that the period after the Shooting Star candlestick opens lower. Good luck!
If you’re interested in mastering some simple but effective swing trading strategies, check out Hit & Run Candlesticks. Our methods are simple, yet powerful. We look for stocks positioned to make an unusually large percentage move, using high percentage profit patterns as well as powerful Japanese Candlesticks. Our services include coaching with experienced swing traders, training clinics, and daily trading ideas. To sign up for a membership, please click here.


Comments are closed.