ZOES – Pop Out OF The Box (RBB) Pattern
ZOES – Pop Out OF The Box (RBB) Pattern
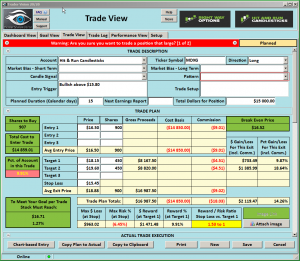
 Pattern") ZOES – The Pop Out of The Box (RBB) pattern alone with the Bullish constructed bottom and the Bullish candle yesterday suggest the Bulls are willing to push this stock higher. I have 2 profit zones on the trade plan, but I do think the Dotted Deuce could be reached. A pullback into the Buy Box and above $11.85 is what we are looking for. Don’t force trades and don’t be in a hurry.
ZOES – The Pop Out of The Box (RBB) pattern alone with the Bullish constructed bottom and the Bullish candle yesterday suggest the Bulls are willing to push this stock higher. I have 2 profit zones on the trade plan, but I do think the Dotted Deuce could be reached. A pullback into the Buy Box and above $11.85 is what we are looking for. Don’t force trades and don’t be in a hurry.
Good Trading – Hit and Run Candlesticks
Learn more about Hit and Run Candlesticks, and today’s trade idea and plan plus the 10 or more members trade ideas, starting at 9:10 EST AM every morning. Every day we teach and trade using the T-Line, Candlesticks, Support and Resistance, Trends, chart patterns and continuation patterns.
Trade Updates – Hit and Run Candlesticks
We added one new long yesterday, and our 2 shorts are working just fine. Currently in 13 position total. Closed 21 positions in the past 30 days with a 57.14% win rate and an average dollar gain of $404.00. It’s been a rough 15 days.
Are you having trouble putting together a winning trade? Not sure what scans to use? So near to having multiple winning trades, but something always goes wrong. Maybe a couple hours with a trading coach could make all the difference in the world. Hit and Run Candlesticks has 4 trading coaches – Learn More about the Coaches
With on-demand recorded webinars, eBooks, and videos, member and non-member eLearning, plus the Live Trading Rooms, there is no end your trading education here at the Hit and Run Candlesticks, Right Way Options, Strategic Swing Trade Service and Trader Vision.
► TECK – You would be up 20.96% or $408.00
If you bought 100 shares when we posted to our members on July 24. Hit and Run Candlesticks members practice trade management and trade planning with Price and Candlesticks, The T-line, Trend, Trend Lines, Chart Patterns, Support, and Resistance.
► Eyes On The Market (SPY) Warning
The SPY has 4 very critical numbers that we will be watching – Above $247.57 would indicate Bullishness and below $247.16 would indicate Bearishness. Then the Bulls would have to attack $248.92, and the Bears would go after $247.16. The last thing in the world the Bull wants is for the price to flirt with the $247.75 low as this would be flirting with a Bearish Blue Ice Failure.
► What is a Trade Idea Watch-list?
A trade idea watchlist is a list of stocks that we feel will move in our desired direction over a swing trader’s time frame. That time could be one to 15 days for example. From that watch list, we wait until price action meets our conditions for a trade.
Rick’s personal trade ideas for the day MEMBERS ONLY
Start your education with wealth and the rewards of a Swing Traders Life – Click Here
Investing and Trading involve significant financial risk and are not suitable for everyone. No communication from Hit and Run Candlesticks Inc. is financial or trading advice. All information is intended for Educational Purposes Only. Terms of Service.
Rick Saddler is not a licensed financial adviser nor does he offer trade recommendations or advice to anyone except for the trading desk of Hit and Run Candlesticks Inc.