
Just because a signal is composed of only one candlestick, that doesn’t mean it can’t pack a big punch. Take the Hammer candlestick pattern. Formed of a small body and a long tail, the Hammer sends a strong message nevertheless. This bullish reversal pattern indicates that after a downtrend, the bears drove down the price until the bulls gained control. If it can be confirmed, it signifies that an uptrend is on the way. Let’s dig in a little further to help you better understand and identify this common trading signal . . .
Hammer Candlestick Pattern
Formation
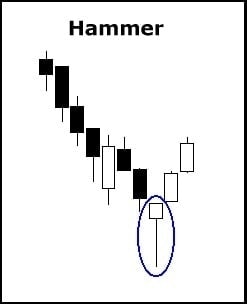
Although the Hammer is composed of only one candlestick (which, unsurprisingly, looks somewhat like a hammer), you will need to take note of the surrounding candles if you want to confirm that you’re truly seeing the Hammer candlestick pattern. So, to identify it properly, confirm that your chart meets the following conditions:
First, the crucial candle must have either a very short upper shadow or no upper shadow at all. Second, the candle’s lower shadow must be quite long (at least two times as long as the real body). Third, the signal must occur after a clear downtrend. Fourth, the candle’s body should be located at the upper end of the trading range. Its color is unimportant (though a white candle hints at a more bullish effect). Fifth and finally, the signal should be confirmed the following day, with the price trading above the Hammer’s real body.
Don’t confuse the Hammer for the Hanging Man, which is identical but only forms at the end of uptrends, while the Hammer occurs after downtrends.
Meaning
So what is a Hammer candlestick pattern trying to tell you?
A downtrend has occurred, and the bears push that downtrend even lower. However, the bulls then step in, driving the price back up. The bears have lost control. This combined action creates a long shadow (sellers drove the prices low during the session) beneath a small body (although the price was pushed low during the session, the open and close are relatively near to each other because the bulls took over and brought the price back up).
To learn a little more about this signal, look for these indicators:
- If the body of the candle is white, the signal has slightly more bullish implications. If the body of the candle is black, there are slightly more bearish implications.
- The longer the lower shadow, the more likely it is that a reversal will occur.
- If the candle gaps down from the previous day’s close, a strong reversal is more likely, assuming the day following the Hammer opens higher.
- If there is a lot of volume on the day the Hammer occurs, it is more likely that a blow-off day has occurred.
– – – – –
When you spot this bullish reversal pattern, have patience and remember to confirm that a Hammer has truly occurred before you take action. Good luck!
If you’re interested in mastering some simple but effective swing trading strategies, check out Hit & Run Candlesticks. Our methods are simple, yet powerful. We look for stocks positioned to make an unusually large percentage move, using high percentage profit patterns as well as powerful Japanese Candlesticks. Our services include coaching with experienced swing traders, training clinics, and daily trading ideas. To sign up for a membership, please click here.


Comments are closed.