1-8-19 e-Learning
Repeating Patterns Every Trader Should Know


After three days of negotiations, the US team is packing up and heading home, and the market has high hopes that a deal is forthcoming. Asian markets rallied strongly when the negotiation extended into the unscheduled 3rd day closing up sharply. European markets are currently bullish across the board as well. As a result, US Futures are suggesting a gap up open extending hopes for a fourth day up, largely ignoring the border wall wrangling and government shutdown entering the 19th day.
The current rally appears a bit stretched in the short-term and bearish hanging man patterns were left behind near resistance levels is a concern so be careful not to chase. A little profit taking is not out of the question, but this bull rally could easily extend if a US/China trade deal happens. Don’t fight the bull but don’t over commit long and watch price action for possible reversals. I guess the moral of the story is to be prepared and remain flexalbe.

On the Earnings Calendar, we have 22 companies reporting earnings. Most notable are LEN and STZ before the bell and BBBY after the closing bell today.
Hopes are high that the US / China negotiations have borne fruit after extending for an unscheduled 3rd day. As the negotiations team packs up to head home, everyone is wondering if there is a deal or if more decessions are necessary. As of now, it would seem the markets are unconcerned about the government entering its 19th day and oval office speech that elevated tension between the warring parties.
Yesterdays gap, pullback and then afternoon rally left behind possible hanging man candle pattern near resistance levels in the indexes. However, on the trade deal hopes futures are currently suggesting a gap up open of more than 50 points. While a hanging man pattern at resistance is a reason for concern, if the bulls can follow through for the 4th day up the pattern loses strength. We will have to see how the day turns out, but it would be wise to pay close attention to the price action after the open and not to over-commit long until the bulls prove they can stretch this rally further.
Trade Wisely,
Doug
Follow-through below yesterdays low could lead price back to test the $254.55 / $252.85 area. The past four days the buyers have been able to string together four new highs and four new lows, however, the $258.00 area is proving to be more of a task then the buyers anticipated with the narrowing of the range. Follow-through below yesterdays low could lead price back to test the $254.55 / $252.85 area. The $258.00 resistance line is what we have talked about the last few days is also where the 60-min. 200-SMA has camped out.
VIX–X Chart – The VIX chart tested our $ 19.70 line with an Inverted Hammer with nine new lows out of ten candles. An oversold bounce seems to be logical within the next day or two. Side note: The T2122 4wk New High/Low Ratio chart is pegged in the overbought area.
HRC Watch list additions – CGC, KL, ROKU, TNDM, FB, PHYS, GE. We cover the details of these trade ideas and others in the trading room throughout the day. We hope you join us to learn the trade details and how we plan to trade our trades.
Past performance does not guarantee future.

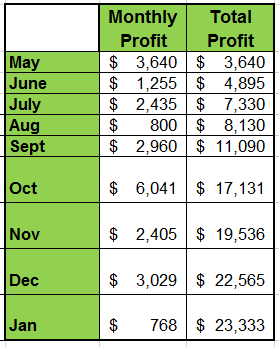
Hit and Run Candlesticks – Join Rick Daily in trading room #1 membership required. Join in, ask questions and learn how Rick picks his trades and trades them. 2018 account + 307% starting with only $5,100. Become a member of Hit and Run Candlesticks and let’s bring on 2019
Read More
2 Hours Private coaching – Read More

Right Way Options Room Update – The RWO trading room is now open all day to share ideas and watchlist suggestions. Watch and learn from Doug as he prepares and explains his trades. Learn More about Right Way Options – Read More
2 Hours Private coaching – Read More

Top Gun Day Trading Room is for the active day/scalp trader looking to profit daily with no overnight risk. Daily trade alerts and trading education. Read More
2 Hours Private coaching – Read More

Road To Wealth Coaching Looking for extended coaching? Serious out trading? Work with Rick Saddler on a daily basis. Read More
Free YouTube Education • Subscription Plans • Private 2-Hour Coaching
DISCLAIMER: Investing/ Trading involves significant financial risk and is not suitable for everyone. No communication from us should be considered as financial or trading advice. All information provided by it and Run Candlesticks Inc, its affiliates or representatives is intended for educational purposes only. You are advised to test any new approach before implementing it. Past performance does not guarantee future results. Terms of Service

The US Futures are suggesting the 3rd straight day of bullishness this morning wish is something the Dow has not seen since the 30th of November. Trade negotiations with China continue today, and according to reports progress is being made, and hopes for an agreement are rising. As we enter day 18 of the government shut down the President will bring his case the people this evening from the oval office. A move, that is sure to create a firestorm of Washington spin and could affect market volatility throughout the day and overnight.
The morning gap raises the possibility of a pop and drop pattern so traders should be careful not to chase into the open until we see if there is follow-through buying that supports the gap. With all the political news swirling traders should stay focused on price action and prepared for whipsaw and quick price action.

On the Earnings Calendar, we have 15 companies reporting with HELE and LNN as the most notable both of which report before the open today.
With two days of bullish price action behind us, the 3rd day in a row with a bullish close a condition not seen since November 30th. Although we are in the 18th day of the Federal Government shutdown, the US Futures are pointing to bullish open this morning with a gap up of more than 150 points. The bullish sentiment appears based upon the positive reports that the US and China trade negations are making progress that may soon result in a deal.
The President will be speaking from the Oval Office this evening taking the border wall debate directly to the people. Expect the political spin to reach new heights and keep in mind the market could be very sensitive to the reports. With a large gap up this morning, we will need to be on the lookout for a possible pop and drop unless buyers prove the ability to support the gap. Please keep in mind that that T2122 is in the bullish reversal zone. That does not mean a selling is imminent, but it does suggest a short-term overbought condition that we must respect when considering new long positions. Today could prove to be a bumpy ride so stay flexible and focused on price action.
Trade Wisely,
Doug
The SPY moved closer to the $258.00 resistance area yesterday on bullish follow-through from the Bullish J-Hook continuation pattern drawn yesterday. We have moved our Bull/Bear line from $248.450 to $250.10. A close above $250.10 we will consider bullish. A close above $258.00 could draw in buyers to challenge $263.75. Keep in mind above $258.00 puts price action in a dangerous area.
VIX–X Chart – Extended it’s downtrend yesterday closing below its 50-SMA, we have seen support approaching, and a bounce could be near. The government shut down, and China will play a big part in how the VIX acts.
Hit and Run Candlesticks Watch-List AMD, GLUU, GE, JD, FDX, LLY, PG Past performance does not guarantee future results. To learn the trade details and how we plan to trade our watch-list and double our trading account in 2019 – Join In
3 Different Service to Choose From – Choose the One That Fits Your Needs
Hit and Run Candlesticks – Join Rick Daily in trading room #1 membership required. Join in, ask questions and learn how Rick picks his trades and trades them. 2018 account + 307% starting with only $5,100. Become a member of Hit and Run Candlesticks and let’s bring on 2019
Read More
Right Way Options Room Update – The RWO trading room is now open all day to share ideas and watchlist suggestions. Watch and learn from Doug as he prepares and explains his trades. Learn More about Right Way Options – Read More
Day Trading Room – Began the new year with some decent trades while risking only $100 or less per trade. If your a day trader or aspiring to be a day trader, this is the place to be. Steve proves

Free YouTube Education • Subscription Plans • Private 2-Hour Coaching
DISCLAIMER: Investing/ Trading involves significant financial risk and is not suitable for everyone. No communication from us should be considered as financial or trading advice. All information provided by it and Run Candlesticks Inc, its affiliates or representatives is intended for educational purposes only. You are advised to test any new approach before implementing it. Past performance does not guarantee future results. Terms of Service

In this E-Learning session we cover the basic rules that I use to trade stock and several options strategies.
The SPY is forming a Bullish J-Hook pattern off what could be a reversal bottom. With bullish follow-through from the close on Friday. Price action will start to feel resistance in the $258.00 area or the 34-EMA. Any close above $248.40 we will consider Bullish, and a challenge of $258.00 – $259.00 is probable.
VIX–X Chart – Closed last week with a Shooting Star candle signal giving the bullish in the broader market a chance to recoup bullish profits. With selling follow through the 50-SMA could be in for a test.
VIX–X Chart – Closed last week with a Shooting Star candle signal giving the bullish in the broader market a chance to recoup bullish profits. With selling follow through the 50-SMA could be in for a test.
Right Way Options Room Update – The RWO trading room is now open all day to share ideas and watchlist suggestions. Watch Doug as he prepares and explains his trades. Learn More about Right Way Options – Click Here
Day Trading Room – B

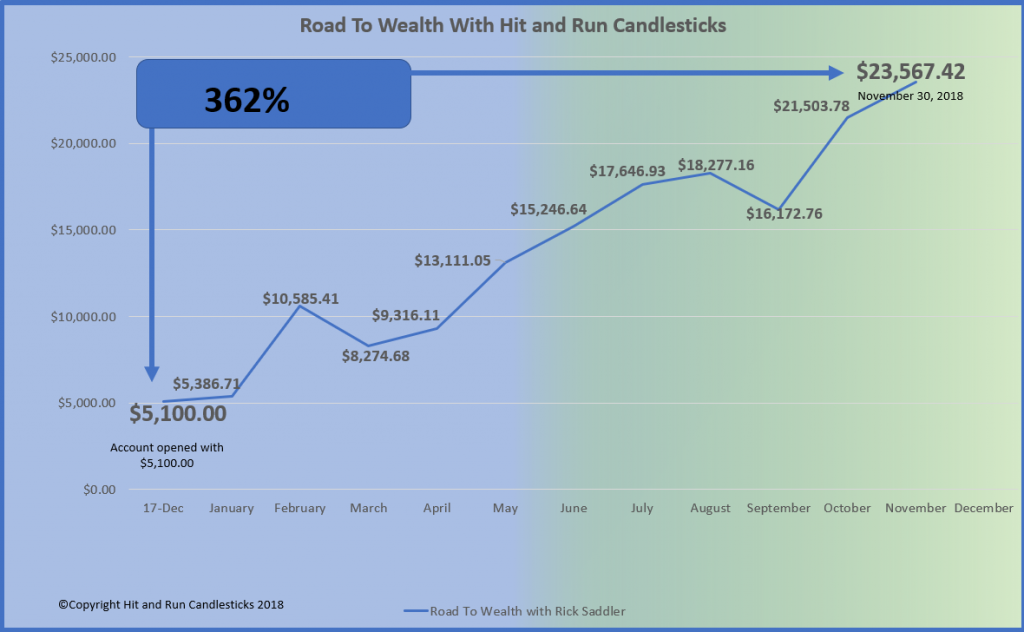
The Road to Wealth • Inner Circle – January of 2018, Rick decided to open a small $5,000.00 trading account to show small and large account traders can make a difference in the financial future.
For 2019 Rick plans on taking the now $23,567.00 account to $50,000.00 before December 31, 2019. Remember he already has increased the account $5,000.00 to $23,567.00 or 362% in 2018.
Dear trader, trading on stock pics alone, even with entries, targets and stops will likely not work out so good for you. You must have the proper discipline and trading education. Stocks we add to our trade watch-list does not mean they are a trade today.
You might not be ready to trade if:
The following tickers are setting up on our trade list: NFLX, JD, LVS, PYPL, MRK, MO, EBAY, GE, PG. Past performance does not guarantee future results. Learn how to trade before you trade.
For 2019 Rick plans on taking the now $23,567.00account to $50,000.00 before December 31, 2019. Remember he already has increased the account $5,000.00 to $23,567.00 or 362% in 2018. Would you like to learn from someone that truly makes money, not just one hit wonders and backs it up with his account statement!

Free YouTube Education • Subscription Plans • Private 2-Hour Coaching
DISCLAIMER: Investing/ Trading involves significant financial risk and is not suitable for everyone. No communication from us should be considered as financial or trading advice. All information provided by it and Run Candlesticks Inc, its affiliates or representatives is intended for educational purposes only. You are advised to test any new approach before implementing it. Past performance does not guarantee future results. Terms of Service